

Abstract
Study Objectives:
The effects of sleep loss on plasma lipids, which play an important role in energy homeostasis and signaling, have not been systematically examined. Our aim was to identify lipid species in plasma that increase or decrease reliably during exposure to total sleep deprivation.
Design:
Twenty individuals underwent sleep deprivation in a laboratory setting. Blood was drawn every 4 h and mass spectrometry techniques were used to analyze concentrations of 263 lipid species in plasma, including glycerolipids, glycerophospholipids, sphingolipids, and sterols.
Setting:
Chronobiology and Sleep Laboratory, Duke-NUS Graduate Medical School.
Participants:
Healthy ethnic-Chinese males aged 21–28 y (n = 20).
Interventions:
Subjects were kept awake for 40 consecutive hours.
Measurements and Results:
Each metabolite time series was modeled as a sum of sinusoidal (circadian) and linear components, and we assessed whether the slope of the linear component differed from zero. More than a third of all individually analyzed lipid profiles exhibited a circadian rhythm and/or a linear change in concentration during sleep deprivation. Twenty-five lipid species showed a linear and predominantly unidirectional trend in concentration levels that was consistent across participants. Choline plasmalogen levels decreased, whereas several phosphatidylcholine (PC) species and triacylglycerides (TAG) carrying polyunsaturated fatty acids increased.
Conclusions:
The decrease in choline plasmalogen levels during sleep deprivation is consistent with prior work demonstrating that these lipids are susceptible to degradation by oxidative stress. The increase in phosphatidylcholines and triacylglycerides suggests that sleep loss might modulate lipid metabolism, which has potential implications for metabolic health in individuals who do not achieve adequate sleep.
Citation:
Chua EC, Shui G, Cazenave-Gassiot A, Wenk MR, Gooley JJ. Changes in plasma lipids during exposure to total sleep deprivation. SLEEP 2015;38(11):1683–1691.
Keywords: circadian, lipids, metabolism, sleep deprivation
INTRODUCTION
Short sleep duration is associated with increased risk for obesity and negative cardiometabolic outcomes.1,2 As shown in laboratory studies, exposure to short sleep (e.g., 4 h per night) or total sleep deprivation impairs glucose regulation and increases blood markers of inflammation in individuals who are otherwise healthy.2–5 Additionally, sleep loss results in increased cellular stress in brain and peripheral tissues,6,7 and increases expression of genes in human blood associated with oxidative stress.8 These studies suggest that sleep deprivation disrupts metabolic function and taxes the body's defense systems.
To date, few studies have examined the effect of sleep deprivation on lipid metabolism. Lipids exhibit staggering chemical diversity and play an integral role in cell membrane structure and function, lipoprotein homeostasis, and cell signaling. Emerging evidence indicates that exposure to partial daily sleep loss or total sleep deprivation influences lipid concentrations in plasma (e.g., cholesterol, fatty acids, and phosphatidylcholine),9–12 suggesting that sleep might play a modulatory role in lipid homeostasis. Given that chronic sleep restriction and shift work are thought to contribute to metabolic syndrome and triglyceridemia, we hypothesized that exposure to sleep deprivation would result in widespread changes in plasma lipids, including increased levels of triacylglycerides. Recent advances in lipidomics research have made it possible to analyze hundreds of lipids in a single biological specimen using mass spectrometry techniques.13 Hence, lipidomics approaches can be used to provide a functional readout of many lipid pathways at the same time, and potentially reveal mechanistic insights on the effect of sleep deprivation on lipid metabolic function.
In previous work, we used a targeted lipidomics-based strategy to profile the time-course of 263 plasma lipids in healthy male subjects who underwent 40 h of total sleep deprivation.14,15 In that study, we focused on identifying lipids that showed a circadian (“about a day”) rhythm, after removing linear trends that were present in the time series. Here, we have taken the opposite approach. That is, taking into account circadian variation in each time series, we focused on identifying lipid species that showed either a linear decrease or increase in concentration levels during sustained wakefulness. In the current study, we provide evidence that a subset of phosphatidylcholine (PC) and triacylglyceride (TAG) species are influenced by the circadian timing system and time spent awake.
METHODS
Subjects
Twenty ethnic-Chinese male subjects aged 21–28 y (mean age ± standard deviation [SD] = 24.4 ± 1.8 y) were recruited from the general population. Participants were healthy, as assessed by screening questionnaires and self-reported medical history. Subjects reported no use of medications or nicotine products. Only nonobese individuals were enrolled, including 17 subjects in the normal weight range (18.5–25 kg/m2) and three subjects who were overweight but otherwise healthy (25–30 kg/m2). Definite morning types and evening types were excluded using the Horne-Östberg morningness-eveningness questionnaire (MEQ score < 31 or > 69).16 Subjects were ineligible if they reported poor sleep quality in the month prior to the laboratory study, which was determined using the Pittsburgh Sleep Quality Index (PSQI score > 5).17 The PSQI was further used to exclude individuals whose regular bedtime occurred before 22:00 or after 02:00, or who spent ≤ 6 h of time in bed for sleep per night. During the prescreening period, the average self-reported bedtime of participants was 24:24 ± 52 min (SD), and the average time in bed was 7 h, 45 min ± 54 min (SD). Subjects were also ineligible if they had a history of working night shifts (between 23:00 to 07:00), or if they travelled across time zones within 3 w prior to the start of the laboratory protocol. Subjects were required to maintain a regular sleep-wake schedule in the week before the study, with 8 h of time in bed for sleep each night. This was verified by actigraphy monitoring (Actiwatch 2, MiniMitter, Inc., Bend, OR). Subjects also agreed to avoid caffeine, alcohol, and over-the-counter medications during the screening period. Written informed consent was obtained from all participants, and research procedures were approved by the SingHealth Centralized Institutional Review Board. Research was compliant with ethical principles for medical research outlined in the Declaration of Helsinki.
Laboratory Protocol
Subjects took part in a 4-d laboratory study at the Chronobiology and Sleep Laboratory, Duke-National University of Singapore Graduate Medical School. Subjects lived individually in a research suite that consisted of a windowless environment without access to environmental time cues. Participants arrived in the evening and were put to bed at their regular prestudy bedtime. After 8 h of time in bed for sleep in darkness, subjects were kept awake for 40 consecutive hours using constant routine procedures, as previously described.14 Subjects were kept awake by research technicians who were present at all times to carry out the protocol. During periods when participants exhibited signs of sleepiness, research staff remained in the room to help the subject stay awake (e.g., by engaging in conversation, playing games, etc.). At other times, sleep-wake state was monitored by technicians in the control room using a surveillance camera. During computer-based testing (results not reported here), eye closures were monitored using a head-mounted eye tracker (ISCAN, Inc., Woburn, MA). As part of the constant routine procedure, participants remained in bed in dim ambient lighting (< 5 lux) and were given equicaloric snacks every hour.
Each snack consisted of a small portion of granola (Lizi's Original Granola, GoodCarb Food Company, Ltd, United Kingdom: 250 kcal per standard serving including 15 g fat, 23 g carbohydrate, and 5 g protein) and juice (Marigold Peel Fresh Powerberries juice drink, Malaysia Dairy Industries, Pte, Ltd, Malaysia: 45 kcal per standard serving including 0.1 g fat, 10.8 g carbohydrate, and 0.3 g protein). Total calories per snack were based on each subject's age, height, and weight according to the Mifflin-St. Jeor equation.18 Because this method is used to estimate basal metabolic rate (BMR) in a postabsorptive state, we multiplied the BMR by a factor of 1.1, as participants consumed snacks hourly while being restricted to bed with minimal physical activity. The amounts of granola and juice were varied together in 1-g and 5-mL increments, respectively. Snacks ranged from 6–10 g of granola per subject, whereas the volume of juice ranged from 50 mL to 90 mL. Most participants (16 of 20 individuals) were able to fully consume all snacks during the constant routine procedure. One participant did not eat his granola during a single snack in the late evening (Subject J), another participant was unable to complete two consecutive snacks in the early morning hours (Subject A), and in two participants the amount of granola was reduced part way during the protocol due to complaints of being given too much food (Subjects B and Q).
About 4 h after waking, a cannula was inserted into the antecubital vein to allow for periodic collection of blood samples. Blood was drawn every 4 h over a span of 28 h (from 8 h to 36 h after wake time) and collected in vacutainer tubes containing EDTA. Samples were centrifuged immediately at 1,000 × g for 5 min at 4°C. Plasma was aliquoted into microtubes and stored at −80°C until being assayed.
Identification of Lipids in Plasma
Lipids were analyzed as described in our previous work.14,19–22 In brief, individual classes of glycerophospholipids (GP) and sphingolipids (SP) were separated using a Shimadzu LD20 high performance liquid chromatography (HPLC) system before being analyzed using a Q-Trap mass spectrometer (Applied Biosystems, Singapore). Multiple reaction monitoring transitions for individual lipid species were set up at different elution stages, and concentrations were determined by mass spectrometry (MS) using spiked internal standards. The sample concentrations were preadjusted such that the final adjusted concentrations for mass spectrometric analyses fell within the linear dynamic range of the lipid classes analyzed. In the current study, we only report those lipid species for which the coefficient of variation was less than 15% (ranging from 3% to 15%). Based on this criterion, we analyzed 142 species of GP, including phosphatidylcholine (PC, 53 species), phosphatidylethanolamine (PE, 44 species), phosphatidylglycerol (PG, 9 species), phosphatidylinositol (PI, 17 species), phosphatidylserine (PS, 15 species), and phosphatidic acid (4 species). The GP fraction included plasmenyl analogues for lipids with ethanolamine and choline head groups (18 PEp and 20 PCp species, respectively), more commonly referred to as plasmalogens. We also determined concentrations for 43 species of SP, including sphingomyelin (SM, 11 species), ceramide (Cer, 9 species), glucosyl-ceramide (GluCer, 7 species), and ganglioside mannoside 3 (GM3, 16 species). Glycerolipids (GL) including triacylglycerides (TAG, 64 species) and diacylglycerides (DAG, 12 species) were analyzed using a modified version of reverse phase HPLC/electrospray ionization/ MS.21 Free cholesterol and cholesterol esters were analyzed by HPLC/MS as previously described.20
Determination of Metabolites that Showed a Linear Change in Concentration over Time
In each subject, we analyzed the time course of 263 lipids with two replicates per time point. Because there were substantial between-subject differences in lipid concentrations, we first z-scored each subject's data for each lipid metabolite time series (20 subjects × 263 lipid profiles per subject = 5,260 lipid profiles). Each lipid profile was then fitted with a nonlinear regression model that represented the sum of a sinusoidal component and a linear trend:
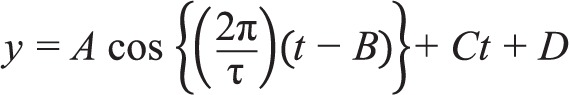 |
where is t time since wake in hours; τ is the period which was fixed at 24 h; A is the amplitude of the sinusoid; B is the phase of the sinusoid; C is the slope of the linear trend; and D is the y-intercept of the linear trend. For each metabolite profile, we assessed whether the slope differed from zero using a two-tailed Student's t-test, whereby the test statistic was computed as the slope divided by the standard error. We used a threshold of α = 0.05 for determining whether the linear trend in metabolite concentrations was greater or less than a slope of zero. As described in detail in our previous work, circadian variation in lipid metabolite levels was assessed using the JTK_CYCLE algorithm.14,23 Analyses and statistics were performed using MATLAB software (MathWorks, Natick, MA).
RESULTS
To identify lipids that increased or decreased during exposure to total sleep deprivation, we modeled each metabolite time series as the sum of circadian and linear components (Figure 1). As shown in our previous work,14 17.8% of individually analyzed lipid profiles (i.e., 935 of 5,260 traces) showed a significant circadian rhythm (Figure 2A). Circadian-regulated lipids were observed across each of the categories of lipids examined, including GL, GP, and SP. Next, we evaluated those lipids that showed a linear increase or decrease in concentration levels, taking into account underlying circadian variation (Figure 2B). We found that 9.3% of individually analyzed lipid profiles showed a significant decrease during the sleep deprivation protocol, whereas 17.8% of lipid profiles showed increasing concentration levels. Of those metabolites that were circadian regulated, 12.8% showed a decreasing linear trend and 35.2% showed an increasing trend (Figure 2C). Overall, 36.3% of individually analyzed lipid profiles showed a circadian rhythm and/or a linear change in concentration levels during prolonged wakefulness. Across lipid categories (GL, GP, and SP), the proportion of cycling and decreasing/increasing lipids was generally similar, although the percentage of circadian-regulated metabolites that increased over time was substantially higher for GLs, which consisted of DAG and TAG species (Figure 2D).
Figure 1.
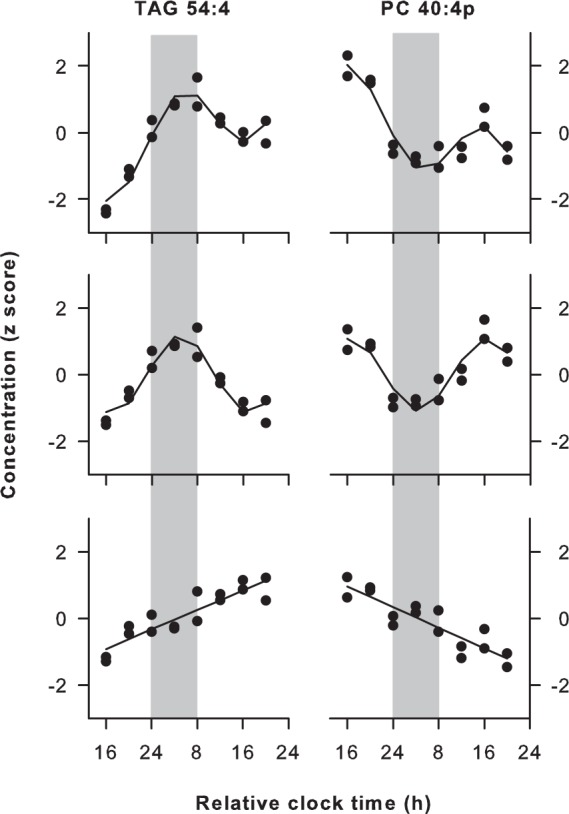
Circadian and linear trends in lipid metabolite concentrations during prolonged wakefulness. Representative lipids are shown that exhibited circadian variation and either a linear increase (TAG 54:4, Subject F) or decrease (PC 40:4p, Subject I) in plasma concentrations during total sleep deprivation. For each subject and metabolite, the time course of concentrations was modeled as a sum of sinusoidal and linear components (top), which allowed for separate analysis of circadian (middle) and linear trends (bottom) in the time series. Black circles show z-scored concentration values for replicate samples at each time point, and the traces indicate the best-fit regression line. Vertical gray bars show the usual hours of sleep. Results are shown using relative clock time with relative bedtime defined as midnight, as study events were timed according to each person's prestudy sleep-wake schedule. The total number of acyl carbons and double bonds is indicated for each metabolite (carbons:double bonds).
Figure 2.

Plasma lipid concentrations show substantial variation during total sleep deprivation. (A) The heat map shows circadian-regulated lipid metabolites across a group of 20 subjects. Colors show z-scored concentration levels. Individual metabolite traces are organized from top to bottom by lipid categories including glycerolipids (GL), glycerophospholipids (GP), and sphingolipids (SP). Within each lipid category, metabolites are arranged from top to bottom by the timing of their peak concentration levels. (B) The heat map shows lipids that exhibited a decreasing or increasing linear trend during prolonged wakefulness, after taking into account underlying circadian variation in the metabolite time-series. Data are displayed as in A, with hotter colors corresponding to higher concentrations, and cooler colors showing lower concentration levels in plasma. (C) The Venn diagram shows the number and overlap of individual lipid profiles that exhibited circadian (cycling) behavior and either a linear decrease or increase during the sleep deprivation protocol. The sizes of the rings correspond to the number of metabolites, and percentages are shown relative to all individual metabolite traces examined (i.e., of 5,260 lipid profiles). (D) Pie charts show the proportions of lipid metabolites that exhibited cycling and/or linear trends in each of the major lipid categories examined. The size of each pie corresponds to the number of lipids analyzed within each category.
Next, we identified lipid species that either decreased or increased reliably across study participants (Figure 3). For each lipid, we determined the number of participants who showed a linear slope that differed from zero. We shortlisted those metabolites that showed a linear trend in concentration levels in the same direction in at least half of the participants (Figure 4). Out of the 263 lipid species that were screened, there were four lipids that decreased reliably during the sleep deprivation protocol (in 14 to 16 subjects). These consisted of three choline plasmalogens (PC 34:1p, PC 34:2p, and PC 36:2p) and one TAG species carrying a monounsaturated fatty acid (TAG 50:1). By comparison, there were 21 lipid species that increased in at least half of the subjects. These lipids consisted primarily of PC species (lysoPC 16:1, PC 32:2, PC 34:3, PC 34:2, PC 36:3, PC 38:3, and PC 40:7), and TAGs carrying polyunsaturated fatty acids (TAG 48:2, TAG 48:3, TAG 50:4, TAG 52:5, TAG 52:6, TAG 54:3, TAG 54:4, TAG 54:5, TAG 54:6, TAG 54:7, TAG 56:3). The majority of lipids (17 of 25) showed a unidirectional pattern of change, or included a single participant who trended in the opposite direction (7 of 25; most often Subject Q). Because the subset of PC and TAG species identified in these analyses are found in moderate abundance in plasma,14,24 we considered whether changes in the concentrations of these lipid species were representative of their respective lipid classes. Additionally, the aforementioned analyses do not reveal the relative strength of the linear change over time, as compared with underlying circadian variation. To address this, we examined the time course for the total molar concentration of choline plasmalogens (20 species), diacyl PCs (21 species), and TAGs (64 species) in plasma. In addition to a circadian component in the time series, the concentration of total choline plasmalogen decreased during prolonged wakefulness (Figure 5), as did the concentration of total ethanolamine plasmalogen (18 species). By comparison, total levels of PC and TAG exhibited an increase in plasma during the sleep deprivation procedure.
Figure 3.

Linear decrease in choline plasmalogen levels during total sleep deprivation. The linear trend is shown for a representative plasmalogen species (PC 34:2p), after taking into account the circadian component. The concentration of PC 34:2p decreased over time in 15 of 20 subjects. Subject codes are shown at the top of each plot and vertical gray bars highlight the usual hours of sleep. One participant showed a linear increase in PC 34:2p (Subject Q), whereas the slope in the other four subjects was not significant (Subjects J, L, O, and T; not shown). Black circles show z-scored concentration values in replicate samples at each time point with the best-fit linear regression.
Figure 4.

Lipid species that increased or decreased reliably across subjects during total sleep deprivation. The heat map shows lipid species that exhibited a significant linear trend in at least half of study participants. In each subject (labeled A to T), metabolites that decreased are shown in dark blue, and metabolites that increased are shown in red. Lipids that did not show a significant increasing or decreasing trend over time are shown in light blue. The horizontal bar graph on the right summarizes the number of subjects who showed an increasing or decreasing trend in plasma concentration levels for each lipid species labeled on the left of the heat map. The suffix “p” indicates the plasmalogen form of PC. The total number of acyl carbons and double bonds is indicated for each metabolite (carbons:double bonds). DAG, diacylglyceride; PC, phosphatidylcholine; PI, phosphatidylinositol; SM, sphingomyelin; TAG, triacylglyceride.
Figure 5.
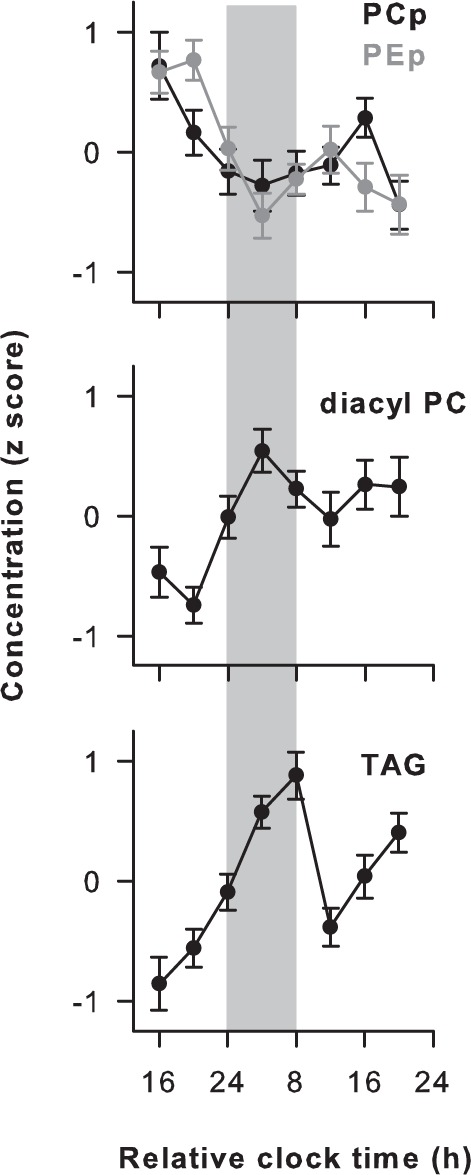
Time course of phosphatidylcholine (PC) and triacylglyceride (TAG) levels in human plasma during sleep deprivation. Changes in total molar concentration of the plasmalogen form of PC (PCp, 20 species), diacyl PC (21 species), and TAG (64 species) are shown for 20 subjects who were kept awake for 40 consecutive hours using constant routine procedures. In addition to circadian variation in the time series, there was a decrease in choline plasmalogen over time (top). As shown by the gray trace, a decreasing trend in total ethanolamine plasmalogen (PEp, 18 species) was also observed. In contrast, the total concentration of diacyl PC (middle) and TAG (bottom) increased in plasma. Vertical gray bars highlight the usual hours of sleep. Each trace shows the average of z-scored concentrations across subjects. Error bars show the standard error of the mean.
DISCUSSION
To our knowledge, our study is the first to use targeted lipidomics-based approaches to examine changes in plasma lipids that occur during exposure to total sleep deprivation. Importantly, lipid profiles were examined at the level of individual subjects, in addition to group-level analyses, as prior work has shown that there are large between-subject differences in the time course of lipid concentrations in plasma. Lipid species that decreased reliably across participants over time included choline plasmalogens, whereas a subset of PCs and TAGs increased in plasma. As discussed next, these changes could potentially reflect increased oxidative stress or altered lipid homeostasis in response to sleep deprivation, as well as changes related to the study diet.
Implications of Decreased Plasmalogen Levels in Plasma during Total Sleep Deprivation
Plasmalogens play an important role in membrane structure and function, and are ubiquitous in cell membranes and lipo-protein particles. The defining feature of plasmalogens is the presence of a fatty alcohol linked by a vinyl ether double bond at the sn-1 position, in addition to a fatty acid at the sn-2 position and a hydrophilic head group at the sn-3 position (usually ethanolamine or choline).25,26 The vinyl ether linkage confers increased susceptibility to oxidation compared to diacyl GP. Hence, decreased plasmalogen levels are associated with increased oxidative stress, and they have been proposed to function as endogenous antioxidants due to their ability to scavenge reactive oxygen species.27
Although studies in rats suggest that sleep deprivation does not result in oxidative damage or stress in brain, liver, and skeletal muscle,28 it was recently shown that sleep insufficiency results in increased expression of genes in human blood involved in cellular responses to oxidative stress and reactive oxygen species.8 It is therefore possible that the decrease in plasmalogen levels that we observed over time was due to increased oxidative stress associated with increasing time spent awake. Interestingly, previous work has demonstrated that plasmalogen levels in plasma are lower in normal aging and in patients with schizophrenia and Alzheimer disease,29–31 all of which are associated with increased oxidative stress and a higher frequency of sleep disturbances relative to healthy young individuals. Our findings raise the possibility that disrupted sleep might contribute to decreased plasmalogen levels in aging and aging-related diseases; however, this hypothesis requires further testing.
Plasma plasmalogen is synthesized and secreted primarily by liver as a structural component of lipoproteins. Growing evidence indicates that decreased choline plasmalogen levels in plasma are associated with hyperlipidemia and might also represent a biomarker for atherogenic state. For example, choline plasmalogen concentrations correlate positively with high-density lipoprotein (HDL) cholesterol and negatively with TAGs, C-reactive protein, body weight, and waist circumference.30 A pair of recent studies showed that, among ether-linked GPs, the concentration of choline plasmalogen carrying oleic acid (18:1) or linoleic acid (18:2) correlated most strongly with risk factors for atherosclerosis in patients with coronary heart disease or who were asymptomatic.32,33 The specific choline plasmalogen species identified in those studies is remarkably consistent with those that decreased across subjects during exposure to sleep deprivation in the current study (PC 34:1p, PC 34:2p, PC 36:2p). Given that most choline plasmalogen in plasma contains the long-chain fatty alcohols hexadecanol (16:0), octadecanol (18:0), and octadecenol (18:1) in the sn-1 position, it is likely that choline plasmalogen species that decreased during sleep deprivation were rich in oleic acid and linoleic acid (e.g., 34:1p and 34:2p could carry oleic acid and linoleic acid, respectively, and PC 36:2p could carry either of these fatty acids at the sn-2 position). Hence, choline plasmalogen species that decreased during total sleep deprivation might represent the same lipid species that are lower in patients at higher risk for atherogenesis, which is intriguing given that short sleep duration has been linked to atherosclerosis.34
Implications of Increased Diacyl PC and TAG in Plasma during Total Sleep Deprivation
Most of the lipids in our panel that increased reliably across subjects during sleep deprivation were diacyl PC and TAG species. PC is an important constituent of cellular membranes and lipoproteins and is the most abundant phospholipid component in plasma. TAGs are an important source of energy and carry fatty acids to tissues of the body via circulating lipoproteins. The increase in plasma concentration of these lipids during sleep deprivation could occur through several different mechanisms. First, sleep deprivation has been shown to alter the expression of genes involved in regulating PC homeostasis,8 which could in turn affect PC levels measured in plasma.11,35 The gradual increase in TAGs during sleep deprivation could potentially be explained by increased absorption of dietary lipids, an increase in de novo synthesis of TAGs in liver, or a reduced capacity to catabolize dietary fat that is absorbed. The linear rise in plasma TAGs might also reflect, in part, the cumulative effects of eating hourly snacks. Since we did not determine the source of TAGs, these possibilities should be explored in future studies. Although increasing TAG concentrations remained in the normal range during our sleep deprivation protocol (< 120 mg/dL in all subjects), epidemio-logic evidence indicates that self-reported short sleep (< 5 h) is associated with hyperlipidemia,36 which itself is linked with atherosclerosis and considered a risk factor for heart disease. Given that our study was conducted under highly controlled laboratory conditions in healthy participants who were fed frequent snacks, it remains to be determined whether our results for individual PC and TAG species have real-world clinical relevance for individuals exposed to chronic sleep deprivation.
Effects of Sleep Deprivation and Circadian Rhythms on Lipid Levels
In the current study, 9.5% of lipid species examined (25 of 263 lipids) showed either a linear increase or decrease in concentration levels (in the same direction) in at least half of study participants. In our earlier work using the same dataset, we found that 13.3% of lipid species (35 of 263 lipids) showed a significant circadian rhythm in group-level analyses.14 Notably, 16 of 25 lipid species that were identified as increasing or decreasing over time in the current study were identified as circadian-regulated in our earlier work. Each of the choline plasmalogen species that decreased during sleep deprivation was also under circadian control (PC 34:1p, PC 34:2p, PC 36:2p), and the majority of metabolites in plasma that increased with time spent awake were likewise regulated by the circadian system (PC 32:2, TAG 48:2, TAG 48:3, TAG 50:4, TAG 52:5, TAG 52:6, TAG 54:3, TAG 54:4, TAG 54:5, TAG 54:6, TAG 54:7, TAG 56:3, and DAG 36:2). Our findings therefore establish that the concentrations of a substantial number of choline plasmalogen and TAG species were modulated by both the sleep deprivation procedure and internal body time. For some TAGs (e.g., as shown in Figure 1), the time course closely resembled that observed for behavioral and physiologic measures known to be regulated by the sleep homeostat and circadian mechanisms, including self-rated sleepiness, lapses in attention, percentage eyelid closure over the pupil over time, variability in heart rate, and electroencephalogram activity in the delta frequency band.37 Our findings therefore raise the possibility that some lipids are influenced by the interaction of the sleep homeostat and the circadian timing system. This question could be explored in future studies using forced de-synchrony procedures, in which circadian and homeostatic sleep mechanisms can be separated.38
The increase in diacyl PC that we observed during sleep deprivation is consistent with a recent study that compared metabolite concentrations between 24:00 and 06:00 during a night of sleep deprivation versus the same time period on the previous night as subjects slept.11 In that study, there were eight diacyl PC species that increased significantly during prolonged wakefulness. Five choline plasmalogen species were also reported to increase in response to sleep deprivation (PC 32:1p, PC 36:0p, PC 38:4p, PC 40:5p, and PC 40:6p), but levels of these lipids in plasma did not appear to increase during extended wakefulness based on group-averaged data. In another study that used similar sleep deprivation procedures as those used here,10 several lipid species were shown to increase during sleep deprivation, although the metabolite panel used did not include diacyl PCs or plasmalogens, nor did it include TAG species. Similarly, a study that used metabolomics approaches to examine changes in fasting plasma samples following a week of sleep restriction (5.5 h of time in bed per night) versus longer sleep (8.5 h of time in bed) found that a small number of lipids increased significantly after sleep loss, including cholesterol and some lipids involved in bile acid metabolism9; however, there was no overlap in lipid species examined with the current study. More recently, it was shown that following exposure to 5 days of sleep restriction with 4 h of time in bed per night, the concentrations of several GP and GL species changed relative to baseline, as assessed in blood samples collected in the morning after fasting.12 Consistent with our findings, the levels of several PC species increased following exposure to sleep restriction, but a small number of DAG and TAG species decreased, including some metabolites that increased during exposure to total sleep deprivation in the current study (DAG 36:2, TAG 54:3, TAG 54:4, and TAG 54:5). The aforementioned studies, which implemented different methodologies and examined largely different sets of metabolites, demonstrate that some lipid pathways are affected by sleep loss. More work is needed, however, to understand the underlying mechanisms and to compare the effect of different types of sleep loss on plasma lipids, including exposure to total sleep deprivation, sleep restriction, and fragmented sleep caused by a sleep disorder.
Limitations and Considerations
Here, we identified lipid species that showed a linear change over time. As shown in another study with similar experimental procedures, some metabolites showed an increase or decrease only very late during the sleep deprivation protocol.10 Therefore, our approach might not detect substances that show a non-linear increase or decrease. Although our study examined major components of the plasma lipidome,24 focusing on GL (diacyl and triacyl forms), GP, and SP, we did not systematically examine various sterol lipids, fatty acids, or prenol lipids. As noted previously, the source of plasma TAGs was not determined, which could be explored in future studies by manipulating the content and timing of meals or by introducing a fasting condition. Although most subjects completed all snacks given during the constant routine procedure, there were four participants who missed one or more snacks (see Methods section), which might have influenced levels of plasma lipids derived from the diet in these individuals. To evaluate whether the plasma lipid profile in our subjects reflected their unique diet (granola and juice), we compared the relative concentrations of 94 lipids (GLs and GPs) that were also identified in a previous study in which participants were fasted prior to collection of blood samples.24 In the earlier study, pooled blood was examined across 100 individuals (equal number of males and females) aged 40–50 y. Despite marked differences in subject characteristics and diet, the relative concentrations of lipids were similar across studies (Spearman rho = 0.83, P < 0.001), suggesting that the unique diet in the current study was not a major determinant of the plasma lipid profile. Nonetheless, we cannot rule out the possibility that the increase in TAG and PC levels during the sleep deprivation protocol was caused by a buildup in postprandial lipids related to consumption of frequent small snacks.
Another limitation of our study is that the lipid species we identified are present across different lipoproteins, but we did not examine changes in lipids across different lipoprotein fractions. In the clinical setting, levels of cholesterol carried by very-low-density, low-density, and high-density lipoproteins (VLDL-C, LDL-C, and HDL-C) are often used to assess risk of cardiovascular disease. Based on exploratory analyses using samples collected in the present study, levels of LDL-C did not show a linear increase during the constant routine procedure (data not shown), but we did not examine VLDL-C, HDL-C, or other lipoprotein particles. Prior work has shown that experimentally induced sleep restriction increases LDL-C,39 and short sleep is associated with lower HDL-C,40,41 suggesting that chronic inadequate sleep might contribute to increased risk for atherosclerosis. Because the half-life of different lipoprotein particles differs substantially (ranging from tens of minutes to days), the half-life of an individual lipid species in plasma is dependent on its distribution among lipoproteins. It is therefore possible that our study failed to detect sleep deprivation-induced changes for some lipids with long half-lives, as such changes might not have been evident by the end of the research protocol. Finally, we would like to highlight that we studied a relatively homogenous group of participants who were healthy ethnic-Chinese males in their 20s. Although this group was chosen to minimize potential sources of variance, it should be noted that prior work has demonstrated sex differences in lipid and glucose metabolism, and plasma lipid profiles change in healthy aging and in metabolic disease.42,43 Additional studies are therefore needed to assess whether our findings extend to individuals who differ in age, sex, and health status.
CONCLUSIONS
The concentrations of lipids in plasma are influenced by the circadian system and by exposure to sleep deprivation. A subset of choline plasmalogens was circadian regulated and decreased reliably across study participants who underwent total sleep deprivation. Given that decreased plasmalogen levels are associated with increased oxidative stress and poor psychiatric and cardiometabolic outcomes, our results suggest that sleep deprivation might contribute to disrupted plasmalogen homeostasis with implications for mental and physical health. During the sleep deprivation procedures, a subset of PC and TAG species increased in plasma, which could reflect altered function of genes and pathways involved in lipid metabolism and transport. Our studies therefore establish a putative link between sleep deprivation and markers of disease risk and severity, i.e., decreased choline plasmalogen and increased TAGs in plasma.
DISCLOSURE STATEMENT
This was not an industry supported study. This work was supported by the Duke-NUS Signature Research Program funded by the Agency for Science, Technology and Research, Singapore, and the Ministry of Health, Singapore; the National Medical Research Council, Singapore under a New Investigator Grant (NMRC/NIG/1000/2009, to Dr. Gooley); the SingHealth Foundation, Singapore (SHF/FG410P/2009, to Dr. Gooley as co-PI); and the National University of Singapore via the Life Sciences Institute and Competitive Research Program Award from the National Research Foundation, Singapore (No. 2007-04, to Dr. Wenk). The authors have indicated no financial conflicts of interest. Work for this study was performed at Duke-NUS Graduate Medical School and the National University of Singapore.
ACKNOWLEDGMENTS
The authors thank Dr. Ivan Ho Mien, Eric Fang, Wen-Qi Tan, Jonathan Chua, Ivan Lee, Sing-Chen Yeo, Luuan-Chin Tan, Buu Duyen Lam, and Pauline Lau for their assistance in carrying out these studies.
Footnotes
A commentary on this article appears in this issue on page 1665.
REFERENCES
- 1.Cappuccio FP, Taggart FM, Kandala NB, et al. Meta-analysis of short sleep duration and obesity in children and adults. Sleep. 2008;31:619–26. doi: 10.1093/sleep/31.5.619. [DOI] [PMC free article] [PubMed] [Google Scholar]
- 2.Magee L, Hale L. Longitudinal associations between sleep duration and subsequent weight gain: a systematic review. Sleep Med Rev. 2012;16:231–41. doi: 10.1016/j.smrv.2011.05.005. [DOI] [PMC free article] [PubMed] [Google Scholar]
- 3.Haack M, Lee E, Cohen DA, Mullington JM. Activation of the prostaglandin system in response to sleep loss in healthy humans: potential mediator of increased spontaneous pain. Pain. 2009;145:136–41. doi: 10.1016/j.pain.2009.05.029. [DOI] [PMC free article] [PubMed] [Google Scholar]
- 4.Mullington JM, Haack M, Toth M, Serrador JM, Meier-Ewert HK. Cardiovascular, inflammatory, and metabolic consequences of sleep deprivation. Prog Cardiovasc Dis. 2009;51:294–302. doi: 10.1016/j.pcad.2008.10.003. [DOI] [PMC free article] [PubMed] [Google Scholar]
- 5.Schmid SM, Hallschmid M, Jauch-Chara K, Bandorf N, Born J, Schultes B. Sleep loss alters basal metabolic hormone secretion and modulates the dynamic counterregulatory response to hypoglycemia. J Clin Endocrinol Metab. 2007;92:3044–51. doi: 10.1210/jc.2006-2788. [DOI] [PubMed] [Google Scholar]
- 6.Anafi RC, Pellegrino R, Shockley KR, Romer M, Tufik S, Pack AI. Sleep is not just for the brain: transcriptional responses to sleep in peripheral tissues. BMC Genomics. 2013;14:362. doi: 10.1186/1471-2164-14-362. [DOI] [PMC free article] [PubMed] [Google Scholar]
- 7.Naidoo N, Ferber M, Master M, Zhu Y, Pack AI. Aging impairs the unfolded protein response to sleep deprivation and leads to proapoptotic signaling. J Neurosci. 2008;28:6539–48. doi: 10.1523/JNEUROSCI.5685-07.2008. [DOI] [PMC free article] [PubMed] [Google Scholar]
- 8.Moller-Levet CS, Archer SN, Bucca G, et al. Effects of insufficient sleep on circadian rhythmicity and expression amplitude of the human blood transcriptome. Proc Natl Acad Sci U S A. 2013;110:E1132–41. doi: 10.1073/pnas.1217154110. [DOI] [PMC free article] [PubMed] [Google Scholar]
- 9.Bell LN, Kilkus JM, Booth JN, 3rd, Bromley LE, Imperial JG, Penev PD. Effects of sleep restriction on the human plasma metabolome. Physiol Behav. 2013;122:25–31. doi: 10.1016/j.physbeh.2013.08.007. [DOI] [PMC free article] [PubMed] [Google Scholar]
- 10.Dallmann R, Viola AU, Tarokh L, Cajochen C, Brown SA. The human circadian metabolome. Proc Natl Acad Sci U S A. 2012;109:2625–9. doi: 10.1073/pnas.1114410109. [DOI] [PMC free article] [PubMed] [Google Scholar]
- 11.Davies SK, Ang JE, Revell VL, et al. Effect of sleep deprivation on the human metabolome. Proc Natl Acad Sci U S A. 2014;111:10761–6. doi: 10.1073/pnas.1402663111. [DOI] [PMC free article] [PubMed] [Google Scholar]
- 12.Weljie AM, Meerlo P, Goel N, et al. Oxalic acid and diacylglycerol 36:3 are cross-species markers of sleep debt. Proc Natl Acad Sci U S A. 2015;112:2569–74. doi: 10.1073/pnas.1417432112. [DOI] [PMC free article] [PubMed] [Google Scholar]
- 13.Wenk MR. Lipidomics: new tools and applications. Cell. 2010;143:888–95. doi: 10.1016/j.cell.2010.11.033. [DOI] [PubMed] [Google Scholar]
- 14.Chua EC, Shui G, Lee IT, et al. Extensive diversity in circadian regulation of plasma lipids and evidence for different circadian metabolic phenotypes in humans. Proc Natl Acad Sci U S A. 2013;110:14468–73. doi: 10.1073/pnas.1222647110. [DOI] [PMC free article] [PubMed] [Google Scholar]
- 15.Gooley JJ, Chua EC. Diurnal regulation of lipid metabolism and applications of circadian lipidomics. J Genet Genomics. 2014;41:231–50. doi: 10.1016/j.jgg.2014.04.001. [DOI] [PubMed] [Google Scholar]
- 16.Horne JA, Ostberg O. A self-assessment questionnaire to determine morningness-eveningness in human circadian rhythms. Int J Chronobiol. 1976;4:97–110. [PubMed] [Google Scholar]
- 17.Buysse DJ, Reynolds CF, 3rd, Monk TH, Berman SR, Kupfer DJ. The Pittsburgh Sleep Quality Index: a new instrument for psychiatric practice and research. Psychiatry Res. 1989;28:193–213. doi: 10.1016/0165-1781(89)90047-4. [DOI] [PubMed] [Google Scholar]
- 18.Mifflin MD, St Jeor ST, Hill LA, Scott BJ, Daugherty SA, Koh YO. A new predictive equation for resting energy expenditure in healthy individuals. Am J Clin Nutr. 1990;51:241–7. doi: 10.1093/ajcn/51.2.241. [DOI] [PubMed] [Google Scholar]
- 19.Lam SM, Tong L, Duan X, Petznick A, Wenk MR, Shui G. Extensive characterization of human tear fluid collected using different techniques unravels the presence of novel lipid amphiphiles. J Lipid Res. 2014;55:289–98. doi: 10.1194/jlr.M044826. [DOI] [PMC free article] [PubMed] [Google Scholar]
- 20.Shui G, Cheong WF, Jappar IA, et al. Derivatization-independent cholesterol analysis in crude lipid extracts by liquid chromatography/mass spectrometry: applications to a rabbit model for atherosclerosis. J Chromatogr A. 2011;1218:4357–65. doi: 10.1016/j.chroma.2011.05.011. [DOI] [PubMed] [Google Scholar]
- 21.Shui G, Guan XL, Low CP, et al. Toward one step analysis of cellular lipidomes using liquid chromatography coupled with mass spectrometry: application to Saccharomyces cerevisiae and Schizosaccharomyces pombe lipidomics. Molecular Biosyst. 2010;6:1008–17. doi: 10.1039/b913353d. [DOI] [PubMed] [Google Scholar]
- 22.Shui G, Stebbins JW, Lam BD, et al. Comparative plasma lipidome between human and cynomolgus monkey: are plasma polar lipids good biomarkers for diabetic monkeys? PloS One. 2011;6:e19731. doi: 10.1371/journal.pone.0019731. [DOI] [PMC free article] [PubMed] [Google Scholar]
- 23.Hughes ME, Hogenesch JB, Kornacker K. JTK_CYCLE: an efficient nonparametric algorithm for detecting rhythmic components in genome-scale data sets. J Biol Rhythms. 2010;25:372–80. doi: 10.1177/0748730410379711. [DOI] [PMC free article] [PubMed] [Google Scholar]
- 24.Quehenberger O, Armando AM, Brown AH, et al. Lipidomics reveals a remarkable diversity of lipids in human plasma. J Lipid Res. 2010;51:3299–305. doi: 10.1194/jlr.M009449. [DOI] [PMC free article] [PubMed] [Google Scholar]
- 25.Braverman NE, Moser AB. Functions of plasmalogen lipids in health and disease. Biochim Biophys Acta. 2012;1822:1442–52. doi: 10.1016/j.bbadis.2012.05.008. [DOI] [PubMed] [Google Scholar]
- 26.Nagan N, Zoeller RA. Plasmalogens: biosynthesis and functions. Prog Lipid Res. 2001;40:199–229. doi: 10.1016/s0163-7827(01)00003-0. [DOI] [PubMed] [Google Scholar]
- 27.Engelmann B. Plasmalogens: targets for oxidants and major lipophilic antioxidants. Biochem Soc Trans. 2004;32:147–50. doi: 10.1042/bst0320147. [DOI] [PubMed] [Google Scholar]
- 28.Gopalakrishnan A, Ji LL, Cirelli C. Sleep deprivation and cellular responses to oxidative stress. Sleep. 2004;27:27–35. doi: 10.1093/sleep/27.1.27. [DOI] [PubMed] [Google Scholar]
- 29.Kaddurah-Daouk R, McEvoy J, Baillie R, et al. Impaired plasmalogens in patients with schizophrenia. Psychiatry Res. 2012;198:347–52. doi: 10.1016/j.psychres.2012.02.019. [DOI] [PubMed] [Google Scholar]
- 30.Maeba R, Maeda T, Kinoshita M, et al. Plasmalogens in human serum positively correlate with high-density lipoprotein and decrease with aging. J Atheroscler Thromb. 2007;14:12–8. doi: 10.5551/jat.14.12. [DOI] [PubMed] [Google Scholar]
- 31.Wood PL, Mankidy R, Ritchie S, et al. Circulating plasmalogen levels and Alzheimer Disease Assessment Scale-Cognitive scores in Alzheimer patients. J Psychiatry Neurosci. 2010;35:59–62. doi: 10.1503/jpn.090059. [DOI] [PMC free article] [PubMed] [Google Scholar]
- 32.Nishimukai M, Maeba R, Ikuta A, et al. Serum choline plasmalogens-those with oleic acid in sn-2-are biomarkers for coronary artery disease. Clin Chim Acta. 2014;437C:147–54. doi: 10.1016/j.cca.2014.07.024. [DOI] [PubMed] [Google Scholar]
- 33.Nishimukai M, Maeba R, Yamazaki Y, et al. Serum choline plasmalogens, particularly those with oleic acid in sn-2, are associated with proatherogenic state. J Lipid Res. 2014;55:956–65. doi: 10.1194/jlr.P045591. [DOI] [PMC free article] [PubMed] [Google Scholar]
- 34.Nakazaki C, Noda A, Koike Y, Yamada S, Murohara T, Ozaki N. Association of insomnia and short sleep duration with atherosclerosis risk in the elderly. Am J Hypertens. 2012;25:1149–55. doi: 10.1038/ajh.2012.107. [DOI] [PubMed] [Google Scholar]
- 35.Quazi F, Molday RS. Differential phospholipid substrates and directional transport by ATP-binding cassette proteins ABCA1, ABCA7, and ABCA4 and disease-causing mutants. J Biol Chem. 2013;288:34414–26. doi: 10.1074/jbc.M113.508812. [DOI] [PMC free article] [PubMed] [Google Scholar]
- 36.Grandner MA, Chakravorty S, Perlis ML, Oliver L, Gurubhagavatula I. Habitual sleep duration associated with self-reported and objectively determined cardiometabolic risk factors. Sleep Med. 2014;15:42–50. doi: 10.1016/j.sleep.2013.09.012. [DOI] [PMC free article] [PubMed] [Google Scholar]
- 37.Chua EC, Tan WQ, Yeo SC, et al. Heart rate variability can be used to estimate sleepiness-related decrements in psychomotor vigilance during total sleep deprivation. Sleep. 2012;35:325–34. doi: 10.5665/sleep.1688. [DOI] [PMC free article] [PubMed] [Google Scholar]
- 38.Scheer FA, Hilton MF, Mantzoros CS, Shea SA. Adverse metabolic and cardiovascular consequences of circadian misalignment. Proc Natl Acad Sci U S A. 2009;106:4453–8. doi: 10.1073/pnas.0808180106. [DOI] [PMC free article] [PubMed] [Google Scholar]
- 39.Kerkhofs M, Boudjeltia KZ, Stenuit P, Brohee D, Cauchie P, Vanhaeverbeek M. Sleep restriction increases blood neutrophils, total cholesterol and low density lipoprotein cholesterol in postmenopausal women: a preliminary study. Maturitas. 2007;56:212–5. doi: 10.1016/j.maturitas.2006.07.007. [DOI] [PubMed] [Google Scholar]
- 40.Kaneita Y, Uchiyama M, Yoshiike N, Ohida T. Associations of usual sleep duration with serum lipid and lipoprotein levels. Sleep. 2008;31:645–52. doi: 10.1093/sleep/31.5.645. [DOI] [PMC free article] [PubMed] [Google Scholar]
- 41.Williams CJ, Hu FB, Patel SR, Mantzoros CS. Sleep duration and snoring in relation to biomarkers of cardiovascular disease risk among women with type 2 diabetes. Diabetes Care. 2007;30:1233–40. doi: 10.2337/dc06-2107. [DOI] [PubMed] [Google Scholar]
- 42.Gonzalez-Covarrubias V. Lipidomics in longevity and healthy aging. Biogerontology. 2013;14:663–72. doi: 10.1007/s10522-013-9450-7. [DOI] [PubMed] [Google Scholar]
- 43.Varlamov O, Bethea CL, Roberts CT., Jr Sex-specific differences in lipid and glucose metabolism. Front Endocrinol. 2014;5:241. doi: 10.3389/fendo.2014.00241. [DOI] [PMC free article] [PubMed] [Google Scholar]