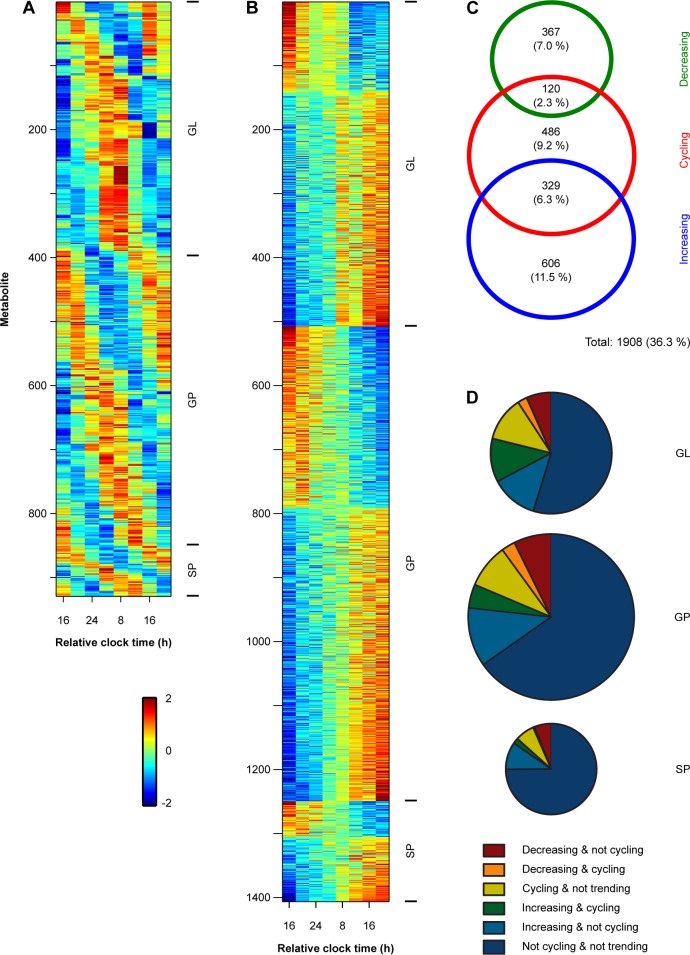
Figure 2.
Plasma lipid concentrations show substantial variation during total sleep deprivation. (A) The heat map shows circadian-regulated lipid metabolites across a group of 20 subjects. Colors show z-scored concentration levels. Individual metabolite traces are organized from top to bottom by lipid categories including glycerolipids (GL), glycerophospholipids (GP), and sphingolipids (SP). Within each lipid category, metabolites are arranged from top to bottom by the timing of their peak concentration levels. (B) The heat map shows lipids that exhibited a decreasing or increasing linear trend during prolonged wakefulness, after taking into account underlying circadian variation in the metabolite time-series. Data are displayed as in A, with hotter colors corresponding to higher concentrations, and cooler colors showing lower concentration levels in plasma. (C) The Venn diagram shows the number and overlap of individual lipid profiles that exhibited circadian (cycling) behavior and either a linear decrease or increase during the sleep deprivation protocol. The sizes of the rings correspond to the number of metabolites, and percentages are shown relative to all individual metabolite traces examined (i.e., of 5,260 lipid profiles). (D) Pie charts show the proportions of lipid metabolites that exhibited cycling and/or linear trends in each of the major lipid categories examined. The size of each pie corresponds to the number of lipids analyzed within each category.

