

Abstract
Study Objectives:
Sleep deprivation (SDp) performed before stroke induces an ischemic tolerance state as observed in other forms of preconditioning. As the mechanisms underlying this effect are not well understood, we used DNA oligonucleotide microarray analysis to identify the genes and the gene-pathways underlying SDp preconditioning effects.
Design:
Gene expression was analyzed 3 days after stroke in 4 experimental groups: (i) SDp performed before focal cerebral ischemia (IS) induction; (ii) SDp performed before sham surgery; (iii) IS without SDp; and (iv) sham surgery without SDp. SDp was performed by gentle handling during the last 6 h of the light period, and ischemia was induced immediately after.
Settings:
Basic sleep research laboratory.
Measurements and Results:
Stroke induced a massive alteration in gene expression both in sleep deprived and non-sleep deprived animals. However, compared to animals that underwent ischemia alone, SDp induced a general reduction in transcriptional changes with a reduction in the upregulation of genes involved in cell cycle regulation and immune response. Moreover, an upregulation of a new neuroendocrine pathway which included melanin concentrating hormone, glycoprotein hormones-α-polypeptide and hypocretin was observed exclusively in rats sleep deprived before stroke.
Conclusion:
Our data indicate that sleep deprivation before stroke reprogrammed the signaling response to injury. The inhibition of cell cycle regulation and inflammation are neuroprotective mechanisms reported also for other forms of preconditioning treatment, whereas the implication of the neuroendocrine function is novel and has never been described before. These results therefore provide new insights into neuroprotective mechanisms involved in ischemic tolerance mechanisms.
Citation:
Pace M, Baracchi F, Gao B, Bassetti C. Identification of sleep-modulated pathways involved in neuroprotection from stroke. SLEEP 2015;38(11):1707–1718.
Keywords: stroke, sleep deprivation, preconditioning, neuroprotection
INTRODUCTION
Despite recent progress in the understanding of pathways involved in neuronal damage during stroke, limited advances have been achieved in developing therapies to limit ischemia. Reperfusion therapy remains the only approved treatment, and it is delivered in fewer than 10% of admitted patients due to the narrow therapeutic window and safety concern.1 This emphasizes the need for alternative therapies that can enhance neuroprotection by antagonizing the molecular cascades underlying cellular damage and mortality.
In the last few years, both clinical and preclinical settings suggested a beneficial role for sleep on stroke recovery. Indeed, it has been established that not only do sleep disorders contribute to stroke vascular pathology,2 but that sleep alterations following stroke are usually linked with poorer rehabilitation and long-term outcomes.3 Recent studies on animal models clearly showed that increasing length and repetition of sleep deprivation (SDp) during the acute phase of ischemia has detrimental effects, both on stroke evolution and functional recovery.4,5 In contrast, the pharmacological enhancement of sleep after stroke has been linked with faster behavioral recovery in mice,6 as well as axonal sprouting and neurogenesis in rats.7 We and others have shown that SDp protocols prior to an experimentally induced stroke did not have a detrimental impact on recovery, but instead induced a protective effect on the brain, resulting in a reduction of the neuronal damage 7 days after stroke with a concomitant improvement in the recovery of sensorimotor performance and motor coordination.8–11 Since these beneficial effects were associated also to a reduction in post-stroke inflammatory response,8,9 SDp prior to stroke has been compared to a phenomenon known as ischemic tolerance, or preconditioning. This phenomenon has been described in the literature for several type of stimuli (hypothermia, hypoxia, oxidative stress, and others) and it is defined as the application of a potentially harmful stimulus, near to but below the threshold of cell damage, which promotes the tolerance of the brain to subsequent ischemic injury.12 Although the mechanisms underlying this tolerance remain unclear, a reduction in the post-stroke inflammatory response, which is considered to contribute to ischemic brain injury, seems to be a common pathway in other forms of preconditioning.13 However, since sleep is involved in the central and peripheral modulation of many molecular functions,14,15 some of which also involved in stroke pathophysiology,12,16 other pathways such as energy balance,17–19 thermoregulation,20,21 or anti-oxidant systems22,23 might play a role in the ischemic tolerance induced by SDp. The aim of this study was to investigate which are the mechanisms and the pathways involved in neuroprotection induced by pre-stroke SDp, in order to identify functional and molecular targets for future therapeutic approaches. We therefore performed a microarray study to characterize brain gene expression alterations in rats sleep deprived prior to cerebral ischemia. Moreover based on microarray results we decided to further investigate the peripheral effects of a newly identified pathway so to elucidate its possible role in neuroprotection.
METHODS
Animals
Male Sprague-Dawley rats (n = 24), 8–10 weeks old and weighing 296 ± 35 g at the time of surgery, were used in this study. They were housed under a 12 h light/dark cycle (light on 08:00–20:00) with ambient temperature at 22 ± 0.5°C. Animals were provided ad libitum with food and water except for the 18 h preceding stroke surgery, during which they were food deprived.10 All experiments were conducted according to local guidelines with governmental approval (Kantonales Veterinäramt Zürich, Switzerland) for the care and use of laboratory animals.
Experimental Design
Rats were assigned to 4 experimental groups: (i) sleep deprivation followed by ischemia (SDp.IS); (ii) sleep deprivation followed by sham surgery (SDp); (iii) ischemia (IS); and (iv) sham surgery (Sham). SDp was performed by gentle handling during the last 6 h of the dark period, and ischemia/sham surgery was performed immediately after. Sixteen rats (n = 4/group) were sacrificed 3 days after surgery. Eight additional rats, assigned to SDp.IS and IS group (n = 4/group), were instead sacrificed after 7 days. Focal cerebral ischemia was induced by electro-coagulation of the distal middle cerebral artery (MCA) and permanent ligation of the ipsilateral common carotid artery (CCA), associated with temporary occlusion (60 min) of the contralateral CCA as previously described.5,11,24 Sham-control animals were subjected to the same procedure except for the occlusion of the MCA and CCAs. At the end of the protocol, blood was collected before sacrifice and brains were extracted for molecular analysis and ischemic damage evaluation.
Microarray analysis was performed only in rats sacrificed after 3 days, on tissue obtained from the whole ischemic hemisphere. Quantitative Real-time PCR (qRT-PCR) and enzyme-linked immunoassays (ELISA) were performed for animals sacrificed both at 3 and 7 days.
Infarct Volume Evaluation
Rats were decapitated while deeply anesthetized (Isoflurane 5%) and brains dissected and frozen immediately on dry ice; 20 μm coronal sections were cut on a cryostat at 6 predefined levels with 1 mm interval (L-1: 2.7 mm; L-2: 1.7 mm; L-3: 0.7 mm; L-4: −0.3 mm; L-5: −1.3 mm and L-6: −2.3 mm from bregma24,25). Twenty sections at each level were mounted on SuperFrostr Plus slides (Menzel GmbH, Braunschweig, Germany) for histology. The remaining tissue between these sections was cut at 50 μm and hemispheres collected separately. Sections were then stored at −80°C for further molecular biology analysis. To determine the volume of the lesion, one section for each level was stained with cresyl violet and digitized. The infarct area was measured at each level by ImageJ software (NIH, Bethesda, MD, USA). The volume was assessed by converting with the known distance between each levels and eventually correcting for edema by multiplying the ratio of the contralateral to ipsilateral volume as described.26
Microarray Analysis
RNA was isolated separately from ipsilateral and contralateral hemisphere from the 50 μm sections by means of TRIzol/tissue (Sigma Aldrich, Midtown-St Louis, MO, USA) according to manufacturer's instruction.27 RNA concentration was then determined by a NanoDrop 2000c spectrophotometer.
Quantities of 100 ng of RNA per sample from the ischemic hemisphere were independently used to perform the target prepara tion using the whole transcript sense target labeling protocol procedure (Affymetrix, High Wycombe, UK). Then, 2.5 μg of each fragmented cDNA was end labeled with biotin and hybridized to a GeneChip Rat Gene 1.0 ST array (Affymetrix). Nor malized expression signals for each animal were calculated from Affymetrix CEL files using RMA normalization method implemented in the Affymetrix Expression Console software, version 1.1. 2800. Statistical analyses were per formed using the R language, version 2.14.2. P values were adjusted for multiple testing with the Benjamini and Hochberg method.
We fitted a model with a coefficient for each of the 4 factor combinations (IS, SDp, SDp.IS, Sham) and extracted the comparisons of interest as contrasts. Four total contrasts were performed: (1) IS versus Sham (IS/vs/Sham), to evaluate the alterations in gene expression induced by ischemia; (2) SDp. IS versus SDp (SDp.IS/vs/SDp), to evaluate the changes induced by ischemia while controlling possible SDp effects; (3) SDp versus Sham (SDp/vs/Sham), to assess gene alterations induced by SDp alone; and (4) SDp.IS versus IS (SDp.IS/vs/ IS), to evaluate the effects of SDp on ischemia. Following MAA-NOVA analyses of all data for each condition, we identified the significantly differentially expressed genes (adjusted qVal cutoff criteria ≤ 0.05). An initial hierarchical clustering analysis was performed to evaluate the segregation of the different samples according to treatment. One animal in the SDp. IS group clustered with sham treated groups and for this reason it was discarded from all subsequent analysis. Due to an unclear separation, 3 other samples (2 SDp and 1 Sham) were excluded from all microarray analysis but included in the following qRT-PCR study as the values of the genes examined were in line with the group mean value.
Data were further analyzed by Ingenuity Pathway Analysis (IPA) Software (Qiagen, Redwood City, CA). Two types of analysis were performed in IPA: the downstream effects analysis (DEA) and functional network generation. DEA was performed in IPA in order to identify biological functions and canonical pathways which were relevant for each contrast. For each biological function, in addition to the P value, another statistical quantity, activation z-score, was computed to infer the state of activation of specific functional annotations associated with a particular biological function. A z-score ≥ 2 predicts “increased activation” whereas a z-score ≤ 2 predicts “decreased activation.” The generation of functional networks was performed only for the SDp.IS/vs/IS contrast.
Quantitative Real-Time PCR
To validate microarray results we examined the expression of 18 genes (Table S1, supplemental material) by quantitative Real-Time PCR (qRT-PCR) using TaqMan Gene Expression Assay (Life Technologies, Carlsbad, CA, USA). Genes were selected within the functional networks identified for the SDp. IS/vs/IS contrast on the basis of P value and difference in fold change. cDNA for qRT-PCR was obtained from up to 2 μg of total RNA by using a high-capacity RNA-to-cDNA kit (Life Technologies, Carlsbad, CA, USA) and stored at −20°C. qRT-PCR was performed in rats sacrificed at 3 days on both hemispheres and in rats sacrificed at 7 days exclusively on ipsilateral hemisphere.
ELISA Immunoassays
After sampling, blood was centrifuged at 10,000 rpm for 10 min at 4°C to separate the serum. Serum was then stored at −80°C for further use. ELISA immunoassays were performed using kits for testosterone and 17β-estradiol (Abnova, Taipei City, Taiwan) following the manufacturer's protocol.
Statistics
Results of infarct volume, qRT-PCR and ELISA are presented as means ± SD. Differences in lesion volume were assessed by means of t-test for independent samples. qRT-PCR data at day 3 were analyzed by 2-way ANOVA (factors: group and hemisphere), whereas qRT-PCR data comparisons between day 3 and day 7 were analyzed by 1-way ANOVA. ELISA data were also tested by a 2-way ANOVA (factors: group and day). Whenever statistical significant was achieved, post hoc contrasts with Tukey correction were run separately for each factor.
RESULTS
Infarct Volume
In order to confirm the neuroprotective effect of pre-stroke SDp, infarct size was evaluated in both IS and SDp.IS groups 3 and 7 days after stroke. After 7 days, the infarct lesion was significantly smaller in animals which were sleep deprived prior to stroke compared to animals which underwent ischemia without sleep deprivation (SDp.IS: 25.6 ± 7.5 vs IS: 54.4 ± 14.0 mm3; t-test P ≤ 0.008). No significant difference between the 2 experimental groups was observed in rats sacrificed after 3 days (IS: 93.7 ± 16.1 vs SDp.IS: 97.2 ± 28.7 mm3).
Gene Expression Data
As described in the Methods, microarray analysis was performed on 4 different contrasts in order to evaluate separately the effects of the 2 treatments (ischemia and SDp) and also their possible interactions. Contrast 1 (IS/vs/Sham) showed that ischemia altered significantly (adj. P ≤ 0.05) the expression of 9,303 genes and in particular induced a downregulation of 5,141 genes and an upregulation of 4,162 (Figure 1A). In contrast 2 (SDp.IS/vs/SDp), the number of genes affected by ischemia was lower (7,154; 3,868 downregulated and 3,286 up-regulated), indicating a possible interaction between ischemia and SDp effect (Figure 1A). SDp alone (contrast 3) induced an alteration in the expression of 941 genes, of which 401 were downregulated and 540 upregulated (Figure 1A). This was different from what we observed in contrast 4 (SDp.IS/vs/IS) since the effect of SDp induced significant changes in a lower number of genes (820) with a predominant downregulation (555 genes downregulated vs 265 upregulated), indicating an interaction between ischemia and SDp (Figure 1A).
Figure 1.
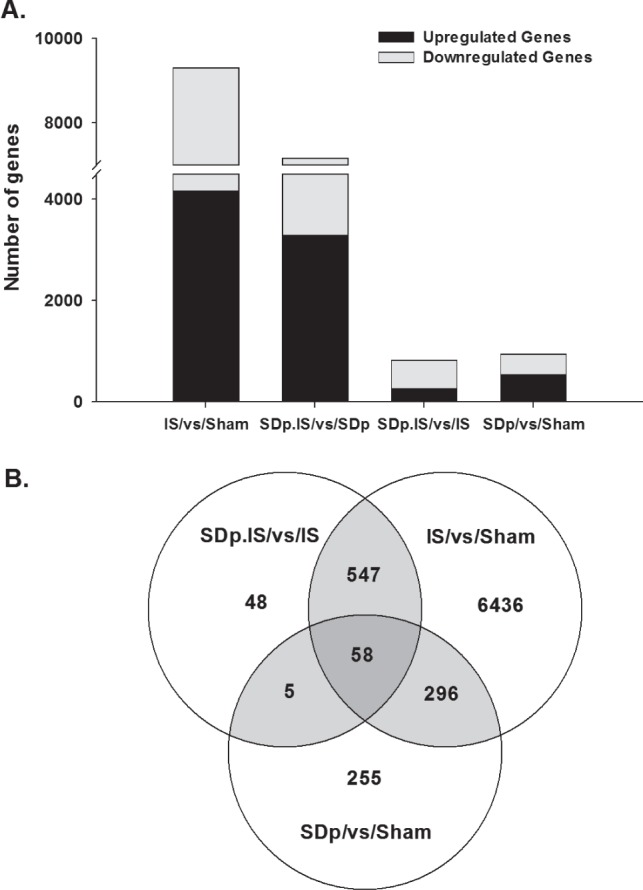
(A) Total number of genes significantly altered (adj. P ≤ 0.05) in each of the 4 contrasts investigated (IS/vs/Sham; SDp.IS/vs/SDp; SDp/vs/Sham; SDp.IS/vs/IS). Black bars indicate the number of genes which were upregulated; gray bars indicate the number of genes which were downregulated. (B) Venn diagram showing the numbers of the common and exclusively expressed genes in the 3 different contrasts: a. IS/vs/Sham; b. SDp/vs/Sham; and c. SDp.IS/vs/IS. Only the identified genes were included in this analysis.
The interaction between treatments was further analyzed in a Venn diagram (Figure 1B) including contrast 1 (IS/vs/Sham), 3 (SDp/vs/Sham), and 4 (SDp.IS/vs/IS). The expression of 6,436 genes (60% upregulated; 40% downregulated) was altered exclusively in the IS/vs/Sham contrast. Of the 547 genes shared between contrast 1 and contrast 4, almost 100% (545 out of 547 genes) showed an opposite regulation in the 2 contrasts, and in particular 80.6% was downregulated in SDp.IS/vs/IS and up-regulated in IS/vs/Sham (Table S1). This suggests that the up-regulation of these genes induced by IS is actually inhibited by pre-stroke SDp. Fifty-eight genes were found to be common to the 3 contrasts. Compared to the expression in SDp.IS/vs/IS contrast most of these genes (98.3%) showed again an opposite regulation in IS/vs/Sham contrast; only 32.7% were oppositely regulated in the SDp/vs/Sham contrast (Table S2, supplemental material). Forty-eight genes were identified to be altered exclusively in the SDp.IS/vs/IS contrast (Table S3, supplemental material). Among these 48 genes, the 2 most affected were pMch (0.915-fold; adj. P = 0.001) and Hcrt (2.209-fold; adj. P = 0.005).
Biological Functions and Canonical Pathways
Microarray dataset was analyzed by the downstream effects analysis in IPA (see Methods section). The 2 ischemia-associated contrasts (IS/vs/Sham and SDp.IS/vs/SDp; Figure 2A, 2B) showed the same top 5 biological functions. All the functional annotations relative to these functions were linked to the immune response and showed a positive activation z-score (≥ 2) (Figure 2A, 2B), indicating, as expected, a major activation of the immune system in ischemia. The same biological functions (except for cellular function and maintenance) were also identified in the SDp/vs/Sham contrast (Figure 2C). However, all functional annotations, again linked with immunity, showed a negative activation z-score (≤ 2), indicating that SDp in Sham animals induced an inhibition of the immune system. Cellular growth and proliferation was also identified in the SDp.IS/vs/ IS contrast, with a negative z-score for the functional annotations confirming an inhibiting effect of SDp on the immune function (Figure 2D). In the SDp.IS/vs/IS contrast we found 3 biological functions that were exclusive to this condition: cell cycle, DNA replication and repair and cellular assembly and organization. For this contrast delay in mitosis and senescence of cells were the only 2 functional annotations with a positive z-score, while all the others showed a negative z-score (Figure 2D). The direction of the activation of the functional annotations in the SDp.IS/vs/IS contrast indicates that SDp preconditioning induced a further delay in mitosis and inhibits DNA replication.
Figure 2.

Biological functions (on the left of the graphs) and relative functional annotations (on the right) identified by Ingenuity Pathway Analysis (IPA) in the 4 different contrasts: (A) IS/vs/Sham; (B) SDp.IS/vs/SDp; (C) SDp/vs/Sham; (D) SDp.IS/vs/IS. Biological functions and functional annotations were identified based on two different metrics: z-score (bars - lower X axis) and P value (white dots - upper X axis). A z-score value ≥ 2 or ≤ 2 indicates that a function is predicted to be respectively increased or decreased within that contrast. The P value, calculated with the Fischer exact test, reflects the likelihood that the association between a set of genes in our dataset and a related biological function is significant. In this graph the top 5 biological functions and the relative top 5 functional annotations are summarized for each contrast, except for the SDp.IS/vs/IS in which only 4 functions were identified.
The inhibiting effect of SDp on the immune system and on the cell cycle regulation of ischemic rats was confirmed by canonical pathways (Figure 3). Six canonical pathways, all associated with inflammatory response and all showing an up-regulation of the genes involved, were common between the ischemia associated contrast (Figure 3A, 3B). Two of these pathways were also found in the SDp.IS/vs/IS (Figure 3D); however, for this contrast genes were mostly downregulated. The only pathway common among all conditions (hepatic fibrosis/hepatic stellate cell activation) showed also this trend, with several genes upregulated in contrasts associated with the IS effect (Figure 3A, 3B) and downregulated in SDp.IS/vs/ IS (Figure 3D) and SDp/vs/Sham (Figure 3C). The canonical pathways specific to SDp.IS/vs/IS (Figure 3D) were associated with inflammation (LXR/RXR activation and LPS/IL-1 mediated inhibition of RXR function) and cell cycle regulation (mitotic roles of Polo-Like Kinase, Cell cycle: G2/M checkpoint regulation, DNA damage induced 14-3-3o' signalling and Cyclins), and they all showed a general downregulation of the genes involved.
Figure 3.

Canonical pathways identified by Ingenuity Pathway Analysis (IPA) in the 4 different contrasts: (A) IS/vs/Sham; (B) SDp.IS/vs/SDp; (C) SDp/vs/ Sham; (D) SDp.IS/vs/IS. The number of focus genes in each pathway are shown as percentages of all the genes associated with that pathways (numbers on top of bars). Expression changes are shown as upregulated (black bars) or downregulated (gray bars). The P value associated with a pathway is a measure of the likelihood that the association between the set of focus genes and the given pathway is due to random chance. P values less than 0.05 indicate a statistically significant, non-random association. The P value is calculated using the right-tailed Fisher exact test. Respective P values are indicated as white dots (right Y axis) on each graph.
Validation of Microarray Results with qRT-PCR
The 18 genes investigated with qRT-PCR were selected within the top 5 functional networks identified by IPA for the SDp.IS/vs/IS contrast (Table 1). Among these 5 networks, on the basis of the analysis of biological functions and canonical pathways only 3 (network 1, 2, and 4) were selected for further investigations (Figure 4). Selected genes included the 5 genes that were the most upregulated (pMch, Cga, Hcrt, Calcr, and Agt) and downregulated (Itgax, Ccl7, Cd14, Ccna2, and Cdk1). Moreover, based on the fold change and P values from the affimetrix dataset, we chose to asses 3 more genes within the first network and 5 more genes within the fourth network.
Table 1.
Top five functional networks identified in the SDp.IS/vs/IS contrast with respective molecules involved.
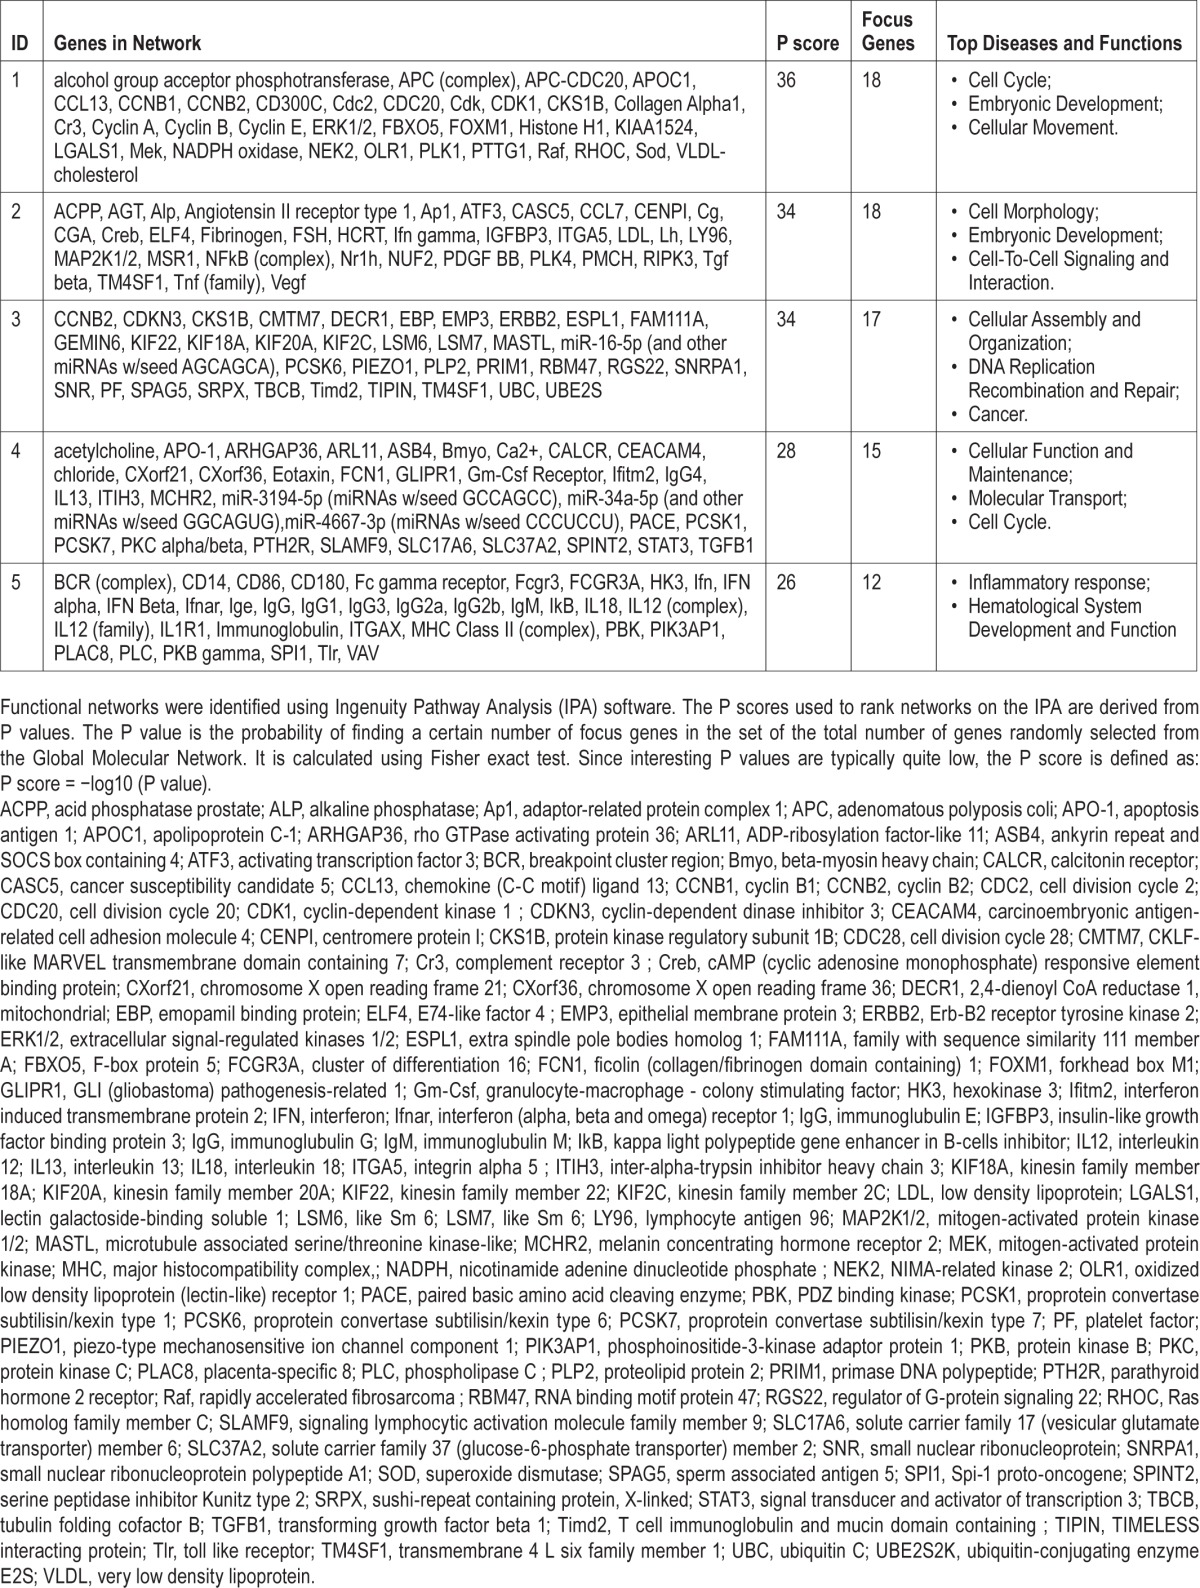
Figure 4.

Expression of selected genes at 3 days after stroke in ipsilateral (dark bar) and contralateral hemisphere (white bar) within the 3 functional networks selected. Gene expression (mean ± standard deviation) was assessed by qRT-PCR in rats belonging to the 4 experimental groups: i. SDp.IS; ii. IS; iii. SDp.Sham, and iv. Sham. The candidate genes were selected based on fold change (≤ 1.5 or ≥ 1.5) and adj. P values observed in the microarray dataset. GAPDH was used as the reference gene. The ΔΔCt method was used to determine the fold change in gene expression. Statistics were performed by mean of a 2-way ANOVA (factors: group and hemisphere) and post hoc analysis with Tukey correction were run afterwards. Asterisks (*) indicate a statistical difference between groups (*P ≤ 0.05; **P ≤ 0.01) whereas double-S (§) indicate a statistical difference between ipsilateral and contralateral hemisphere in the same group (§ P ≤ 0.05; §§ P ≤ 0.01).
Figure 4A shows the expression 3 days after stroke of the genes investigated within the first network. All genes were significantly increased in the ipsilateral hemisphere of the IS group when compared both to the contralateral hemisphere in the same group and to the ipsilateral hemisphere in all others groups investigated. In SDp.IS group no genes except Cdk1 were significantly different in the ipsilateral hemisphere when compared to the same hemisphere of the 2 control groups Sham and SDp. However, when compared to the contralateral hemisphere within the same group, a significant increase in the expression of Cdk1, Plk1, and Ccna2 was observed. In contrasts, the expression of the genes Cdc20 and Pttg1 was not different between the 2 hemispheres. After 7 days from stroke no differences were detected between groups for any of the aforementioned genes (Table 2).
Table 2.
Expression of selected genes 3 and 7 days after ischemia in IS and SDp.IS.
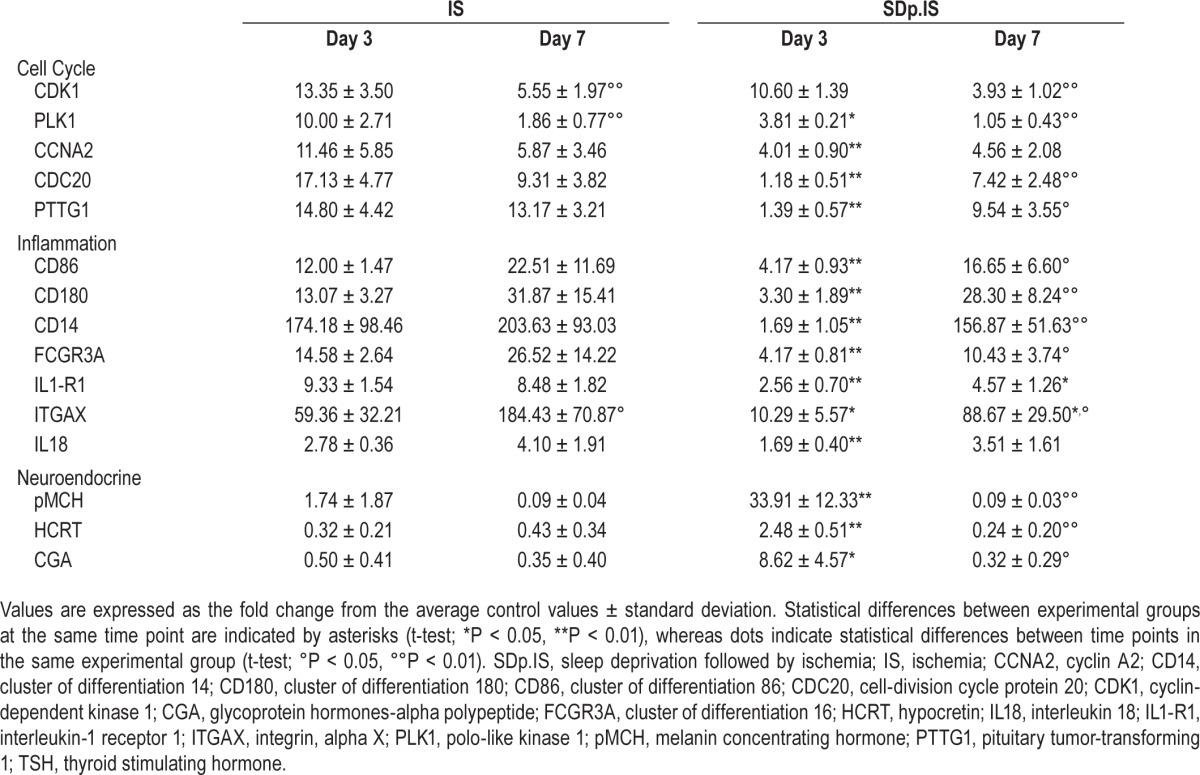
Within the second network 5 genes were investigated (Figure 4B). pMch, Hcrt, and Cga were significantly increased in the ipsilateral hemisphere of SDp.IS animals when compared to the contralateral hemisphere. This increase was also significant when compared to all the other experimental groups, with the exception of Cga, which was not different from the Sham group. For AGT, no difference in the expression was observed between hemispheres or between groups (data not shown). Ccl7 showed a significant increase of gene expression in the ipsilateral hemisphere of both IS and SDp.IS groups compared to the contralateral hemisphere. However no difference was observed between SDp.IS animals and the other experimental groups; for this reason, no further analysis were performed on this gene. At day 7, due to a significant decrease with respect to day 3, the expression level of pMch, Hcrt and Cga was no longer different between the SDp.IS and the IS group (Table 2).
Similar to what observed in network 1, in network 4 (Figure 4C) the genes in IS group were significantly increased in the ipsilateral hemisphere compared both to the contralateral hemisphere and to all the other groups. In the SDp.IS group a significant increase in the ipsilateral hemisphere was observed only for Cd86, Cd16, and IL18; however, this increase was lower than that observed in IS. No statistical difference was observed between SDp.IS and the control groups (Sham and SDp groups) with the exception of Cd86 and IL1-r1. Gene expression at day 7 was similar between SDp.IS and IS, except for IL1-r1 and Itgax, due to a significant increase in the gene levels observed in SDp.IS group with respect to day 3 (Table 2). No differences were observed in the IS group between the 2 time points (Table 2).
Peripheral Sex Hormone Levels
To assess if the alterations in gene expression of pMch, Hcrt, and Cga had an effect on the regulation of sex hormones at a peripheral level, we measured 17β-estradiol and testosterone in the serum of rats from SDp.IS and IS groups both at 3 and 7 days after stroke (Figure 5). Both hormones were differently regulated in SDp.IS compared to IS group at 3 days after stroke. In particular, the plasma concentration of 17β-estradiol was higher in the SDp.IS, whereas testosterone level was lower. However no difference in 17β-estradiol and testosterone level was observed between Sham group and both IS and SDp.IS animals (data not shown). After 7 days from stroke a decrease of 17β-estradiol with respect to day 3 was observed in both groups, and no more difference was observed between groups. Instead, testosterone levels increased from day 3 to day 7 in SDp.IS, reaching similar levels to those observed in the IS group at both 3 and 7 days.
Figure 5.
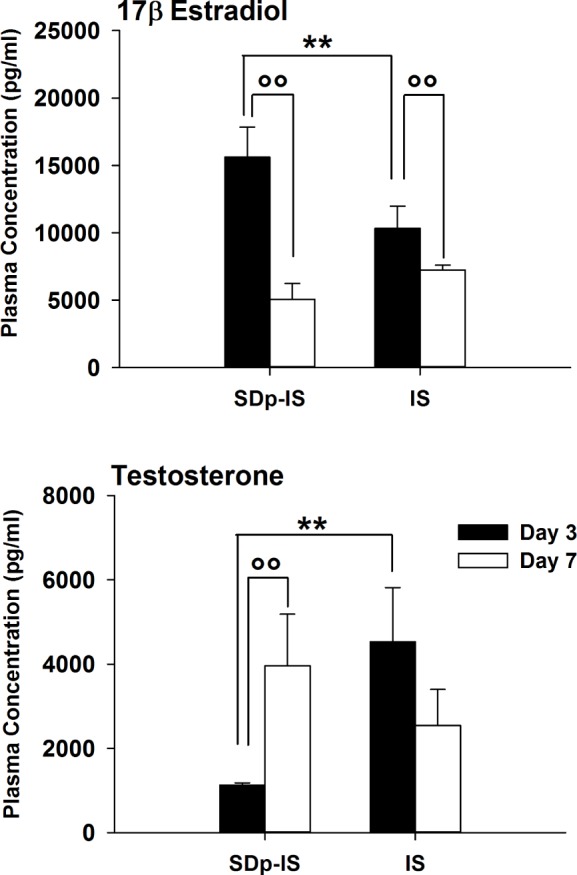
Concentration of 17β estradiol and testosterone in the plasma of rats of the SDp.IS and IS group at 3 (black bars) and 7 days after stroke (white bars) assessed by ELISA immunoassay. Data are presented as mean ± standard deviation. Statistics were performed by mean of a 2-way ANOVA (factors: group and day) and post hoc analysis with Tukey correction were run afterwards. Asterisks (*) indicate a statistical difference between groups (**P ≤ 0.01), whereas dots (°) indicate a statistical difference between days within the same group (°°P ≤ 0.01).
DISCUSSION
Several studies have reported that SDp before ischemia induces neuroprotection,8,9 leading to a significant reduction of infarct volume after 7 days from stroke.10,11 This study confirms this effect and provides for the first time a comprehensive investigation of the molecular pathways involved. We identified three main functions which are altered by performing SDp prior to ischemia: inflammatory response, cell cycle, and neuroendocrine regulation. Although microarray analysis was performed 4 days prior to when evidence of ischemic tolerance was observed, the process essential for the improvement of the outcome are likely to be already activated at this time point. Since all the functions we found altered at day 3 returned to baseline levels by day 7, when the reduction in the lesion was observed in the preconditioned animals, it is possible to assume that the critical time window for the action of the neuroprotective mechanisms induced by pre-ischemic SDp is within 7 days from stroke.
In general, the molecular response to ischemic damage was characterized, as expected,28 by an upregulation of a large number of genes involved in immune response and cell cycle regulation. However, both the inflammatory response and the cell division mechanisms were reduced after SDp preconditioning. A reduction of the inflammatory response to ischemia has also been reported for other preconditioning treatments.12 It has been suggested that the neuroprotective effect of these stimuli is exerted by a pre-activation of the immune system before stroke. Several forms of preconditioning produce an inflammatory response through the activation of toll like receptors (TLRs) leading to the subsequent activation of transcription factor nuclear factor κB (NFκB).13 The importance of the TLRs activation in mediating ischemic tolerance has also been confirmed by direct administration of TLR ligands.29 In addition, sleep loss has been reported to induce alterations in immune parameters,30–33 and interestingly, the molecular mechanisms underlying these modifications have been linked to the NFκB pathway.32 The fact that the two inflammatory pathways specifically altered in SDp.IS/vs/IS contrast are mediated by TLRs activity is therefore noteworthy. LXR and RXR are two types of nuclear receptors which regulate inflammation and lipid metabolism and that are activated through TLRs.34 Moreover, several genes linked to TLR4 activity (Cd14, Cd180, and Il1-r) are not only downregulated in SDp.IS animals with respect to the IS group, but their expression is not different with respect to the control groups. Together these results suggests that the neuroprotective effect of SDp could be partially driven by a post-ischemic attenuation of the TLRs response.
For cell cycle regulation, biological functions and canonical pathway analysis indicated an increased delay in mitosis and an inhibition of DNA replication in SDp.IS rats. Moreover also several genes identified in the first network (Cdk1, Plk1, Ccna2, Cdc20, and Pttg) were implicated once again in the entry of cells into mitosis and in other processes such the G1/S transition, differentiation, proliferation, and cell death. Cell cycle checkpoints are activated to ensure correct completion of critical events such as DNA replication and chromosome segregation. Activation of checkpoints in response to DNA damage and inhibition of DNA replication are known to lead to a reversible cell cycle arrest to allow time for damage repair.35 It has actually been demonstrated that the inhibition of the cell cycle, either by administration of inhibitors or modulation of cell cycle related genes, suppresses neuronal death or provides neuroprotection after ischemia.36–38 This observation is consistent with the fact that rats treated with pre-stroke SDp display a reduction in apoptosis.10 An inhibition of cell cycle mechanisms with beneficial effects on stroke has been reported for mild ischemia and hypoxia preconditioning39,40; however, this is the first time that such effect has been linked with SDp. This effect was compared with adaptive neuroprotective strategies seen during hibernation as the activation of some endogenous genetic mechanisms inducing tolerance to low oxygen levels.39,40 Rats sleep deprived for 6 h prior to stroke showed a significant sleep rebound characterized by an increase of 30% of total sleep time in the first 12 h of the acute phase of stroke recovery.11 The general decrease in the energetic demand of both the brain and the body17,19,41 and the concomitant lower temperature42,43 characterizing sleep might therefore induce neuroprotective mechanisms similar to those observed in hibernating animals.
The last pathway identified in this study was the only one including genes which were upregulated by SDp preconditioning. In particular three of these genes, PMch, Hcrt and Cga, were the most upregulated of the entire dataset. PMch and Hcrt were expressed exclusively in the SDp.IS/vs/IS contrast, whereas Cga was common in the two contrasts associated with IS. However Cga showed an inverse regulation in the two conditions, being downregulated by ischemia alone and upregulated with SDp preconditioning. This was particularly surprising as 80% of the genes shared between SDp.IS/vs/IS and IS/vs/Sham showed instead the opposite trend. It has been shown already that Hcrt alters the pathological mechanisms involved in brain ischemia and has a neuroprotective effect.44,45 Instead, to our knowledge, this is the first time that pMch has been identified as a possible neuroprotective peptide. Mch and Hcrt neurons both represent key components of the system that regulates the sleep-wake cycle.46,47 Both peptides are involved also in other functions such as feeding behavior and energy balance and homeostasis.48–52 As far as the sleep-wake cycle is concerned Hcrt neurons play an important role in arousal regulation,53,54 whereas Mch neurons are more involved in the regulation of sleep states, particularly REM sleep. Prolonged activation of Mch neurons both pharmacologically55 and by repeated optogenetic stimulation56 induces both NREM and REM sleep. Mch neurons are strongly activated during homeostatic sleep rebound, discharging maximally during REM sleep.57,58 REM sleep is usually significantly reduced after ischemia4,59; however, animals sleep deprived before stroke show a sleep rebound characterized by an increase in REM sleep amount.11 The increase in pMch observed in our animals might be therefore linked to the REM sleep rebound observed in the acute phase of stroke. The mechanisms through which Mch can induce neuroprotection are although unclear and further studies are necessary. However Mch together with Hcrt and Cga are involved in the control of endocrine functions, known to be neuroprotective. Mch and Hcrt, when injected in the hypothalamus, can indeed exert stimulatory effects on the gonadotropin-releasing hormone,60–62 which is in turn responsible for the release of luteinizing hormone (LH) and follicle stimulating hormone (FSH). Moreover Cga constitutes the common alpha subunit of four glycoprotein hormones: LH, FSH, chorionic gonadotropin (CG), and thyroid stimulating hormone (TSH).63 Our results showed a peripheral increase of 17β-estradiol level 3 days after stroke and a concomitant decrease in testosterone. It is well accepted that estradiol provides robust neuroprotection in a variety of acute experimental brain injury models including stroke,64,65 whereas the role of testosterone is still not completely clarified. However brain damaging effects of testosterone treatment have been reported in a rodent model of stroke66 and, in vitro.67 Nevertheless reactive gliosis after neuronal injury seemed to be downregulated by testosterone but this effect has been largely attributed to testosterone conversion into estradiol.68 We therefore suggest that SDp preconditioning may affect the hypothalamic-pituitary-adrenal axis inducing modifications in the peripheral levels of sex-hormones which could ultimately play a role in neuroprotection.
CONCLUSIONS
The microarray analysis carried out in this study is the first to investigate the changes in gene expression elicited by SDp preconditioning. Besides confirming two mechanisms that appear to be common to several forms of preconditioning treatments (i.e., downregulation of the inflammatory responses and inhibition of the cell cycle) we discovered a novel pathway that concerned endocrine signaling and that included genes such pMch, Hcrt, and Cga that has not been previously implicated in SDp preconditioning or other preconditioning treatments. Our study provides the basis for exploring new approaches for the development of potential therapeutic and neuroprotective intervention for clinical use in stroke patients. In order to better understand the role and the mechanisms of this pathway in mediating neuroprotection, investigation of the expression of pMch and Hcrt and their relationship with sleep behavior and metabolism during both the acute and sub-acute phase of stroke, are currently undergoing in our laboratory.
DISCLOSURE STATEMENT
This was not an industry supported study. The authors have indicated no financial conflicts of interest. Microarray data were uploaded on ArrayExpress database (E-MTAB-3148).
ACKNOWLEDGMENTS
Microarray analysis were performed at the Genomic Technologies Facility (GTF) of the University of Lausanne. The authors would like to thank Leonore Wigger at GTF for the technical work and Prof. Paul Franken from the Center for Integrative Genomics of the University of Lausanne for the initial guidance and advice and comments of the manuscript. Remarks and suggestions from Prof. Antoine Adamantidis, director of the Zentrum für Experimentelle Neurologie at the Inselspital in Bern, were also appreciated. Moreover, the support with Ingenutity Pathway Analysis software from Cedric Simil-lion at the Interfaculty Bioinformatics Unit of the University of Bern is gratefully acknowledged.
ABBREVIATIONS
- AGT
angiotensin
- Ccl7
chemokine (C-C motif) ligand 7
- Ccna2
cyclin A2
- Cd14
cluster of differentiation 14
- Cd16/Fcgr3a
cluster of differentiation 16
- Cd180
cluster of differentiation 180
- Cd86
cluster of differentiation 86
- Cdc20
cell-division cycle protein 20
- Cdk1
cyclin-dependent kinase 1
- CG
chorionic gonadotropin
- Cga
glycoprotein hormones-alpha polypeptide
- FSH
follicle stimulating hormone
- GAPDH
glyceraldehyde-3-phosphate dehydrogenase
- Hcrt
hypocretin
- IL18
interleukin 18
- IL1-r1
interleukin-1 receptor 1
- IS
ischemia
- Itgax
integrin, alpha X
- LH
luteinizing hormone
- Plk1
polo-like kinase 1
- pMch
melanin concentrating hormone
- Pttg1
pituitary tumor-transforming 1
- SDp
sleep deprivation
- TSH
thyroid stimulating hormone
Footnotes
A commentary on this article appears in this issue on page 1671.
SUPPLEMENTAL MATERIAL
List of Taqman assays used for the qRT-PCR analysis.
Top 25 up and down-regulated genes found to be common in the Venn diagram between SDp.IS/vs/IS and IS/vs/Sham contrasts.
Top 25 up and down-regulated genes found to be common between all the contrasts analyzed in the Venn diagram.
Set of the 48 altered genes expressed exclusively in SDp.IS/vs/S contrast.
REFERENCES
- 1.Fonarow GC, Smith EE, Saver JL, et al. Timeliness of tissue-type plasminogen activator therapy in acute ischemic stroke: patient characteristics, hospital factors, and outcomes associated with door-to-needle times within 60 minutes. Circulation. 2011;123:750–8. doi: 10.1161/CIRCULATIONAHA.110.974675. [DOI] [PubMed] [Google Scholar]
- 2.Grandner MA, Jackson NJ, Pak VM, Gehrman PR. Sleep disturbance is associated with cardiovascular and metabolic disorders. J Sleep Res. 2012;21:427–33. doi: 10.1111/j.1365-2869.2011.00990.x. [DOI] [PMC free article] [PubMed] [Google Scholar]
- 3.Hermann DM, Bassetti CL. Sleep-related breathing and sleep-wake disturbances in ischemic stroke. Neurology. 2009;73:1313–22. doi: 10.1212/WNL.0b013e3181bd137c. [DOI] [PubMed] [Google Scholar]
- 4.Gao B, Cam E, Jaeger H, Zunzunegui C, Sarnthein J, Bassetti CL. Sleep disruption aggravates focal cerebral ischemia in the rat. Sleep. 2010;33:879–87. doi: 10.1093/sleep/33.7.879. [DOI] [PMC free article] [PubMed] [Google Scholar]
- 5.Zunzunegui C, Gao B, Cam E, Hodor A, Bassetti CL. Sleep disturbance impairs stroke recovery in the rat. Sleep. 2011;34:1261–9. doi: 10.5665/SLEEP.1252. [DOI] [PMC free article] [PubMed] [Google Scholar]
- 6.Gao B, Kilic E, Baumann CR, Hermann DM, Bassetti CL. Gamma-hydroxybutyrate accelerates functional recovery after focal cerebral ischemia. Cerebrovasc Dis. 2008;26:413–9. doi: 10.1159/000151683. [DOI] [PubMed] [Google Scholar]
- 7.Hodor A, Palchykova S, Baracchi F, Noain D, Bassetti C. Baclofen facilitates sleep, neuroplasticity and recovery after stroke in rats. Ann Clin Transl Neurol. 2014;1:765–77. doi: 10.1002/acn3.115. [DOI] [PMC free article] [PubMed] [Google Scholar]
- 8.Hsu JC, Lee YS, Chang CN, Ling EA, Lan CT. Sleep deprivation prior to transient global cerebral ischemia attenuates glial reaction in the rat hippocampal formation. Brain Res. 2003;984:170–81. doi: 10.1016/s0006-8993(03)03128-7. [DOI] [PubMed] [Google Scholar]
- 9.Weil ZM, Norman GJ, Karelina K, et al. Sleep deprivation attenuates inflammatory responses and ischemic cell death. Exp Neurol. 2009;218:129–36. doi: 10.1016/j.expneurol.2009.04.018. [DOI] [PMC free article] [PubMed] [Google Scholar]
- 10.Moldovan M, Constantinescu AO, Balseanu A, Oprescu N, Zagrean L, Popa-Wagner A. Sleep deprivation attenuates experimental stroke severity in rats. Exp Neurol. 2010;222:135–43. doi: 10.1016/j.expneurol.2009.12.023. [DOI] [PubMed] [Google Scholar]
- 11.Cam E, Gao B, Imbach L, Hodor A, Bassetti CL. Sleep deprivation before stroke is neuroprotective: a pre-ischemic conditioning related to sleep rebound. Exp Neurol. 2013 doi: 10.1016/j.expneurol.2013.03.003. [DOI] [PubMed] [Google Scholar]
- 12.Dirnagl U, Becker K, Meisel A. Preconditioning and tolerance against cerebral ischaemia: from experimental strategies to clinical use. Lancet Neurol. 2009;8:398–412. doi: 10.1016/S1474-4422(09)70054-7. [DOI] [PMC free article] [PubMed] [Google Scholar]
- 13.Kariko K, Weissman D, Welsh FA. Inhibition of toll-like receptor and cytokine signaling--a unifying theme in ischemic tolerance. J Cereb Blood Flow Metab. 2004;24:1288–304. doi: 10.1097/01.WCB.0000145666.68576.71. [DOI] [PubMed] [Google Scholar]
- 14.Cirelli C, Gutierrez CM, Tononi G. Extensive and divergent effects of sleep and wakefulness on brain gene expression. Neuron. 2004;41:35–43. doi: 10.1016/s0896-6273(03)00814-6. [DOI] [PubMed] [Google Scholar]
- 15.Mackiewicz M, Naidoo N, Zimmerman JE, Pack AI. Molecular mechanisms of sleep and wakefulness. Ann N Y Acad Sci. 2008;1129:335–49. doi: 10.1196/annals.1417.030. [DOI] [PubMed] [Google Scholar]
- 16.Durukan A, Tatlisumak T. Acute ischemic stroke: overview of major experimental rodent models, pathophysiology, and therapy of focal cerebral ischemia. Pharmacol Biochem Behav. 2007;87:179–97. doi: 10.1016/j.pbb.2007.04.015. [DOI] [PubMed] [Google Scholar]
- 17.Kennedy C, Gillin JC, Mendelson W, et al. Local cerebral glucose utilization in non-rapid eye movement sleep. Nature. 1982;297:325–7. doi: 10.1038/297325a0. [DOI] [PubMed] [Google Scholar]
- 18.Kong J, Shepel PN, Holden CP, Mackiewicz M, Pack AI, Geiger JD. Brain glycogen decreases with increased periods of wakefulness: implications for homeostatic drive to sleep. J Neurosci. 2002;22:5581–7. doi: 10.1523/JNEUROSCI.22-13-05581.2002. [DOI] [PMC free article] [PubMed] [Google Scholar]
- 19.Netchiporouk L, Shram N, Salvert D, Cespuglio R. Brain extracellular glucose assessed by voltammetry throughout the rat sleep-wake cycle. Eur J Neurosci. 2001;13:1429–34. doi: 10.1046/j.0953-816x.2001.01503.x. [DOI] [PubMed] [Google Scholar]
- 20.Franken P, Dijk DJ, Tobler I, Borbely AA. Sleep deprivation in rats: effects on EEG power spectra, vigilance states, and cortical temperature. Am J Physiol. 1991;261:R198–208. doi: 10.1152/ajpregu.1991.261.1.R198. [DOI] [PubMed] [Google Scholar]
- 21.Lack LC, Gradisar M, Van Someren EJ, Wright HR, Lushington K. The relationship between insomnia and body temperatures. Sleep Med Rev. 2008;12:307–17. doi: 10.1016/j.smrv.2008.02.003. [DOI] [PubMed] [Google Scholar]
- 22.Ramanathan L, Gulyani S, Nienhuis R, Siegel JM. Sleep deprivation decreases superoxide dismutase activity in rat hippocampus and brainstem. Neuroreport. 2002;13:1387–90. doi: 10.1097/00001756-200208070-00007. [DOI] [PMC free article] [PubMed] [Google Scholar]
- 23.Singh R, Kiloung J, Singh S, Sharma D. Effect of paradoxical sleep deprivation on oxidative stress parameters in brain regions of adult and old rats. Biogerontology. 2008;9:153–62. doi: 10.1007/s10522-008-9124-z. [DOI] [PubMed] [Google Scholar]
- 24.Chen ST, Hsu CY, Hogan EL, Maricq H, Balentine JD. A model of focal ischemic stroke in the rat: reproducible extensive cortical infarction. Stroke. 1986;17:738–43. doi: 10.1161/01.str.17.4.738. [DOI] [PubMed] [Google Scholar]
- 25.Ashwell KW, Paxinos G, Watson CR. Precerebellar and vestibular nuclei of the short-beaked echidna (Tachyglossus aculeatus) Brain Struct Funct. 2007;212:209–21. doi: 10.1007/s00429-007-0139-z. [DOI] [PubMed] [Google Scholar]
- 26.Junge CE, Sugawara T, Mannaioni G, et al. The contribution of protease-activated receptor 1 to neuronal damage caused by transient focal cerebral ischemia. Proc Natl Acad Sci U S A. 2003;100:13019–24. doi: 10.1073/pnas.2235594100. [DOI] [PMC free article] [PubMed] [Google Scholar]
- 27.Chomczynski P, Mackey K. Short technical reports. Modification of the TRI reagent procedure for isolation of RNA from polysaccharide- and proteoglycan-rich sources. BioTechniques. 1995;19:942–5. [PubMed] [Google Scholar]
- 28.Gidday JM. Cerebral preconditioning and ischaemic tolerance. Nat Rev Neurosci. 2006;7:437–48. doi: 10.1038/nrn1927. [DOI] [PubMed] [Google Scholar]
- 29.Marsh BJ, Williams-Karnesky RL, Stenzel-Poore MP. Toll-like receptor signaling in endogenous neuroprotection and stroke. Neuroscience. 2009;158:1007–20. doi: 10.1016/j.neuroscience.2008.07.067. [DOI] [PMC free article] [PubMed] [Google Scholar]
- 30.Irwin MR, Carrillo C, Olmstead R. Sleep loss activates cellular markers of inflammation: sex differences. Brain Behav Immun. 2010;24:54–7. doi: 10.1016/j.bbi.2009.06.001. [DOI] [PMC free article] [PubMed] [Google Scholar]
- 31.Matsumoto Y, Mishima K, Satoh K, et al. Total sleep deprivation induces an acute and transient increase in NK cell activity in healthy young volunteers. Sleep. 2001;24:804–9. [PubMed] [Google Scholar]
- 32.Opp MR. Sleep and psychoneuroimmunology. Neurol Clin. 2006;24:493–506. doi: 10.1016/j.ncl.2006.03.002. [DOI] [PubMed] [Google Scholar]
- 33.Vgontzas AN, Zoumakis E, Bixler EO, et al. Adverse effects of modest sleep restriction on sleepiness, performance, and inflammatory cytokines. J Clin Endocrinol Metab. 2004;89:2119–26. doi: 10.1210/jc.2003-031562. [DOI] [PubMed] [Google Scholar]
- 34.Freeman MW, Moore KJ. eLiXiRs for restraining inflammation. Nat Med. 2003;9:168–9. doi: 10.1038/nm0203-168. [DOI] [PubMed] [Google Scholar]
- 35.Singh SV, Herman-Antosiewicz A, Singh AV, et al. Sulforaphane-induced G2/M phase cell cycle arrest involves checkpoint kinase 2-mediated phosphorylation of cell division cycle 25C. J Biol Chem. 2004;279:25813–22. doi: 10.1074/jbc.M313538200. [DOI] [PubMed] [Google Scholar]
- 36.Wang W, Redecker C, Yu ZY, et al. Rat focal cerebral ischemia induced astrocyte proliferation and delayed neuronal death are attenuated by cyclin-dependent kinase inhibition. J Clin Neurosci. 2008;15:278–85. doi: 10.1016/j.jocn.2007.02.004. [DOI] [PubMed] [Google Scholar]
- 37.Zhu Z, Zhang Q, Yu Z, et al. Inhibiting cell cycle progression reduces reactive astrogliosis initiated by scratch injury in vitro and by cerebral ischemia in vivo. Glia. 2007;55:546–58. doi: 10.1002/glia.20476. [DOI] [PubMed] [Google Scholar]
- 38.Osuga H, Osuga S, Wang F, et al. Cyclin-dependent kinases as a therapeutic target for stroke. Proc Natl Acad Sci U S A. 2000;97:10254–9. doi: 10.1073/pnas.170144197. [DOI] [PMC free article] [PubMed] [Google Scholar]
- 39.Prasad SS, Russell M, Nowakowska M, Williams A, Yauk C. Gene expression analysis to identify molecular correlates of pre- and postconditioning derived neuroprotection. J Mol Neurosci. 2012;47:322–39. doi: 10.1007/s12031-012-9751-3. [DOI] [PubMed] [Google Scholar]
- 40.Stenzel-Poore MP, Stevens SL, Xiong Z, et al. Effect of ischaemic preconditioning on genomic response to cerebral ischaemia: similarity to neuroprotective strategies in hibernation and hypoxia-tolerant states. Lancet. 2003;362:1028–37. doi: 10.1016/S0140-6736(03)14412-1. [DOI] [PubMed] [Google Scholar]
- 41.Dash MB, Tononi G, Cirelli C. Extracellular levels of lactate, but not oxygen, reflect sleep homeostasis in the rat cerebral cortex. Sleep. 2012;35:909–19. doi: 10.5665/sleep.1950. [DOI] [PMC free article] [PubMed] [Google Scholar]
- 42.Busto R, Dietrich WD, Globus MY, Ginsberg MD. Postischemic moderate hypothermia inhibits CA1 hippocampal ischemic neuronal injury. Neurosci Lett. 1989;101:299–304. doi: 10.1016/0304-3940(89)90549-1. [DOI] [PubMed] [Google Scholar]
- 43.Busto R, Dietrich WD, Globus MY, Ginsberg MD. The importance of brain temperature in cerebral ischemic injury. Stroke. 1989;20:1113–4. doi: 10.1161/01.str.20.8.1113. [DOI] [PubMed] [Google Scholar]
- 44.Kitamura E, Hamada J, Kanazawa N, et al. The effect of orexin-A on the pathological mechanism in the rat focal cerebral ischemia. Neurosci Res. 2010;68:154–7. doi: 10.1016/j.neures.2010.06.010. [DOI] [PubMed] [Google Scholar]
- 45.Kotan D, Deniz O, Aygul R, Yildirim A. Acute cerebral ischaemia: relationship between serum and cerebrospinal fluid orexin-A concentration and infarct volume. J Int Med Res. 2013;41:404–9. doi: 10.1177/0300060513477002. [DOI] [PubMed] [Google Scholar]
- 46.Bittencourt JC, Presse F, Arias C, et al. The melanin-concentrating hormone system of the rat brain: an immuno- and hybridization histochemical characterization. J Comp Neurol. 1992;319:218–45. doi: 10.1002/cne.903190204. [DOI] [PubMed] [Google Scholar]
- 47.Sakurai T, Amemiya A, Ishii M, et al. Orexins and orexin receptors: a family of hypothalamic neuropeptides and G protein-coupled receptors that regulate feeding behavior. Cell. 1998;92 doi: 10.1016/s0092-8674(00)80949-6. 1 page following 696. [DOI] [PubMed] [Google Scholar]
- 48.Berridge CW, Espana RA, Vittoz NM. Hypocretin/orexin in arousal and stress. Brain Res. 2010;1314:91–102. doi: 10.1016/j.brainres.2009.09.019. [DOI] [PMC free article] [PubMed] [Google Scholar]
- 49.King PJ. The hypothalamus and obesity. Curr Drug Targets. 2005;6:225–40. doi: 10.2174/1389450053174587. [DOI] [PubMed] [Google Scholar]
- 50.Machaalani R, Hunt NJ, Waters KA. Effects of changes in energy homeostasis and exposure of noxious insults on the expression of orexin (hypocretin) and its receptors in the brain. Brain Res. 2013;1526:102–22. doi: 10.1016/j.brainres.2013.06.035. [DOI] [PubMed] [Google Scholar]
- 51.Peyron C, Sapin E, Leger L, Luppi PH, Fort P. Role of the melanin-concentrating hormone neuropeptide in sleep regulation. Peptides. 2009;30:2052–9. doi: 10.1016/j.peptides.2009.07.022. [DOI] [PubMed] [Google Scholar]
- 52.Griffond B, Risold PY. MCH and feeding behavior-interaction with peptidic network. Peptides. 2009;30:2045–51. doi: 10.1016/j.peptides.2009.07.008. [DOI] [PubMed] [Google Scholar]
- 53.Saper CB, Chou TC, Scammell TE. The sleep switch: hypothalamic control of sleep and wakefulness. Trends Neurosci. 2001;24:726–31. doi: 10.1016/s0166-2236(00)02002-6. [DOI] [PubMed] [Google Scholar]
- 54.Adamantidis AR, Zhang F, Aravanis AM, Deisseroth K, de Lecea L. Neural substrates of awakening probed with optogenetic control of hypocretin neurons. Nature. 2007;450:420–4. doi: 10.1038/nature06310. [DOI] [PMC free article] [PubMed] [Google Scholar]
- 55.Monti JM, Torterolo P, Lagos P. Melanin-concentrating hormone control of sleep-wake behavior. Sleep Med Rev. 2013;17:293–8. doi: 10.1016/j.smrv.2012.10.002. [DOI] [PubMed] [Google Scholar]
- 56.Konadhode RR, Pelluru D, Blanco-Centurion C, et al. Optogenetic stimulation of MCH neurons increases sleep. J Neurosci. 2013;33:10257–63. doi: 10.1523/JNEUROSCI.1225-13.2013. [DOI] [PMC free article] [PubMed] [Google Scholar]
- 57.Modirrousta M, Mainville L, Jones BE. Orexin and MCH neurons express c-Fos differently after sleep deprivation vs. recovery and bear different adrenergic receptors. Eur J Neurosci. 2005;21:2807–16. doi: 10.1111/j.1460-9568.2005.04104.x. [DOI] [PubMed] [Google Scholar]
- 58.Hanriot L, Camargo N, Courau AC, Leger L, Luppi PH, Peyron C. Characterization of the melanin-concentrating hormone neurons activated during paradoxical sleep hypersomnia in rats. J Comp Neurol. 2007;505:147–57. doi: 10.1002/cne.21482. [DOI] [PubMed] [Google Scholar]
- 59.Ahmed S, Meng H, Liu T, et al. Ischemic stroke selectively inhibits REM sleep of rats. Exp Neurol. 2011;232:168–75. doi: 10.1016/j.expneurol.2011.08.020. [DOI] [PMC free article] [PubMed] [Google Scholar]
- 60.Chiocchio SR, Gallardo MG, Louzan P, Gutnisky V, Tramezzani JH. Melanin-concentrating hormone stimulates the release of luteinizing hormone-releasing hormone and gonadotropins in the female rat acting at both median eminence and pituitary levels. Biol Reprod. 2001;64:1466–72. doi: 10.1095/biolreprod64.5.1466. [DOI] [PubMed] [Google Scholar]
- 61.Naufahu J, Cunliffe AD, Murray JF. The roles of melanin-concentrating hormone in energy balance and reproductive function: are they connected? Reproduction. 2013;146:R141–50. doi: 10.1530/REP-12-0385. [DOI] [PubMed] [Google Scholar]
- 62.Small CJ, Goubillon ML, Murray JF, et al. Central orexin A has site-specific effects on luteinizing hormone release in female rats. Endocrinology. 2003;144:3225–36. doi: 10.1210/en.2002-0041. [DOI] [PubMed] [Google Scholar]
- 63.Bieche I, Latil A, Parfait B, et al. CGA gene (coding for the alpha subunit of glycoprotein hormones) overexpression in ER alpha-positive prostate tumors. Eur Urol. 2002;41:335–41. doi: 10.1016/s0302-2838(02)00020-9. [DOI] [PubMed] [Google Scholar]
- 64.McCullough LD, Hurn PD. Estrogen and ischemic neuroprotection: an integrated view. Trends Endocrinol Metab. 2003;14:228–35. doi: 10.1016/s1043-2760(03)00076-6. [DOI] [PubMed] [Google Scholar]
- 65.Li J, Siegel M, Yuan M, et al. Estrogen enhances neurogenesis and behavioral recovery after stroke. J Cereb Blood Flow Metab. 2011;31:413–25. doi: 10.1038/jcbfm.2010.181. [DOI] [PMC free article] [PubMed] [Google Scholar]
- 66.Gatson JW, Singh M. Activation of a membrane-associated androgen receptor promotes cell death in primary cortical astrocytes. Endocrinology. 2007;148:2458–64. doi: 10.1210/en.2006-1443. [DOI] [PubMed] [Google Scholar]
- 67.Caruso A, Di Giorgi Gerevini V, Castiglione M, et al. Testosterone amplifies excitotoxic damage of cultured oligodendrocytes. J Neurochem. 2004;88:1179–85. doi: 10.1046/j.1471-4159.2004.02284.x. [DOI] [PubMed] [Google Scholar]
- 68.Garcia-Estrada J, Del Rio JA, Luquin S, Soriano E, Garcia-Segura LM. Gonadal hormones down-regulate reactive gliosis and astrocyte proliferation after a penetrating brain injury. Brain Res. 1993;628:271–8. doi: 10.1016/0006-8993(93)90964-o. [DOI] [PubMed] [Google Scholar]
Associated Data
This section collects any data citations, data availability statements, or supplementary materials included in this article.
Supplementary Materials
List of Taqman assays used for the qRT-PCR analysis.
Top 25 up and down-regulated genes found to be common in the Venn diagram between SDp.IS/vs/IS and IS/vs/Sham contrasts.
Top 25 up and down-regulated genes found to be common between all the contrasts analyzed in the Venn diagram.
Set of the 48 altered genes expressed exclusively in SDp.IS/vs/S contrast.