Abstract
Study Objectives:
To identify the role of end-tidal carbon dioxide (EtCO2) monitoring during polysomnography in evaluation of children with obstructive sleep apnea syndrome (OSAS), including the correlation of EtCO2 with other measures of OSAS and prediction of changes in cognition and behavior after adenotonsillectomy.
Design:
Analysis of screening and endpoint data from the Childhood Adenotonsillectomy Trial, a randomized, controlled, multicenter study comparing early adenotonsillectomy (eAT) to watchful waiting/supportive care (WWSC) in children with OSAS.
Setting:
Multisite clinical referral settings.
Participants:
Children, ages 5.0 to 9.9 y with suspected sleep apnea.
Interventions:
eAT or WWSC.
Measurements and Results:
Quality EtCO2 waveforms were present for ≥ 75% of total sleep time (TST) in 876 of 960 (91.3%) screening polysomnograms. Among the 322 children who were randomized, 55 (17%) met pediatric criteria for hypoventilation. The mean TST with EtCO2 > 50 mmHg was modestly correlated with apnea-hypopnea index (AHI) (r = 0.33; P < 0.0001) and with oxygen saturation ≤ 92% (r = 0.26; P < 0.0001). After adjusting for AHI, obesity, and other factors, EtCO2 > 50 mmHg was higher in African American children than others. The TST with EtCO2 > 50 mmHg decreased significantly more after eAT than WWSC. In adjusted analyses, baseline TST with EtCO2 > 50 mmHg did not predict postoperative changes in cognitive and behavioral measurements.
Conclusions:
Among children with suspected obstructive sleep apnea syndrome, overnight end-tidal carbon dioxide (EtCO2) levels are weakly to modestly correlated with other polysomnographic indices and therefore provide independent information on hypoventilation. EtCO2 levels improve with adenotonsillectomy but are not as responsive as AHI and do not provide independent prediction of cognitive or behavioral response to surgery.
Clinical Trial Registration:
Childhood Adenotonsillectomy Study for Children with OSAS (CHAT). ClinicalTrials.gov Identifier #NCT00560859.
Citation:
Paruthi S, Rosen CL, Wang R, Weng J, Marcus CL, Chervin RD, Stanley JJ, Katz ES, Amin R, Redline S. End-tidal carbon dioxide measurement during pediatric polysomnography: signal quality, association with apnea severity, and prediction of neurobehavioral outcomes. SLEEP 2015;38(11):1719–1726.
Keywords: capnography, CO2, end-tidal, hypercapnia, hypoventilation, pediatric, polysomnogram, sleep apnea
INTRODUCTION
The American Academy of Sleep Medicine (AASM) Manual for Scoring of Sleep and Associated Events recommends monitoring for hypoventilation on diagnostic polysomnograms (PSGs) in children.1 Nasal exhaled end-tidal carbon dioxide (EtCO2) by capnography is the most commonly used surrogate for CO2 measurement in children. This signal is relatively easy to measure from the same cannula-type sensor that measures the nasal pressure signal. Furthermore, a PSG pattern of obstructive hypoventilation, defined as at least 25% of total sleep time (TST) with hypercapnia (partial pressure of carbon dioxide [PaCO2] > 50 mmHg) in association with other clinical sleep disordered breathing findings is a diagnostic criteria for pediatric obstructive sleep apnea syndrome (OSAS).2 However, the recommendation for the scoring of hypoventilation is based on consensus with limited evidence of the added value of EtCO2 monitoring in the diagnosis of OSAS. Collection of capnographic data increases equipment costs and staff time, so any additional justification for the measurement is important.
Smaller studies have previously described EtCO2 correlations with polysomnographic variables and demographic variables such as obesity and age.3–8 However, the added value of the EtCO2 signal in identification of OSAS and its severity, beyond measurement of apneas, hypopneas, oxygen saturation, arousals, and sleep stage distribution, has not been established with a large pediatric sample; neither has the important question of whether hypercapnia identifies subgroups who respond differently to OSAS treatment.
In this report, we analyze rigorously collected, multicenter capnography data, with an explicit interest in quantifying EtCO2 signal quality in children likely to have nasal obstruction from adenoid hypertrophy. We tested the added value of capnography data in characterizing OSAS disease severity by quantifying its correlation with the apnea- hypopnea index (AHI) and other polysomnographic indices. Last, we determined whether baseline level of hypercapnia is associated with lower measures of cognition and behavior at baseline, shows responsiveness to adenotonsillectomy, or predicts greater improvements in health outcomes following early adenotonsillectomy (eAT) compared with watchful waiting with supportive care (WWSC). We hypothesized that: (1) increased hypercapnia would correlate with greater severity of OSAS as measured by AHI and other polysomnographic indices; (2) hypercapnia would improve following adenotonsillectomy; and (3) the presence of hypercapnia would be associated with worse cognitive and behavioral outcomes.
METHODS
The study was approved by the Institutional Review Board of each participating institution. Informed consent was obtained from caregivers, and assent from children at least 7 y of age.
Data were examined for descriptive analyses and for longitudinal analyses at multiple time points from the Childhood Adenotonsillectomy Trial (CHAT): 960 screening PSGs for cross-sectional analyses; and 366 baseline PSGs (randomized participants) and 325 follow-up PSGs (endpoint) for longitudinal analyses (see Figure 1).
Figure 1.
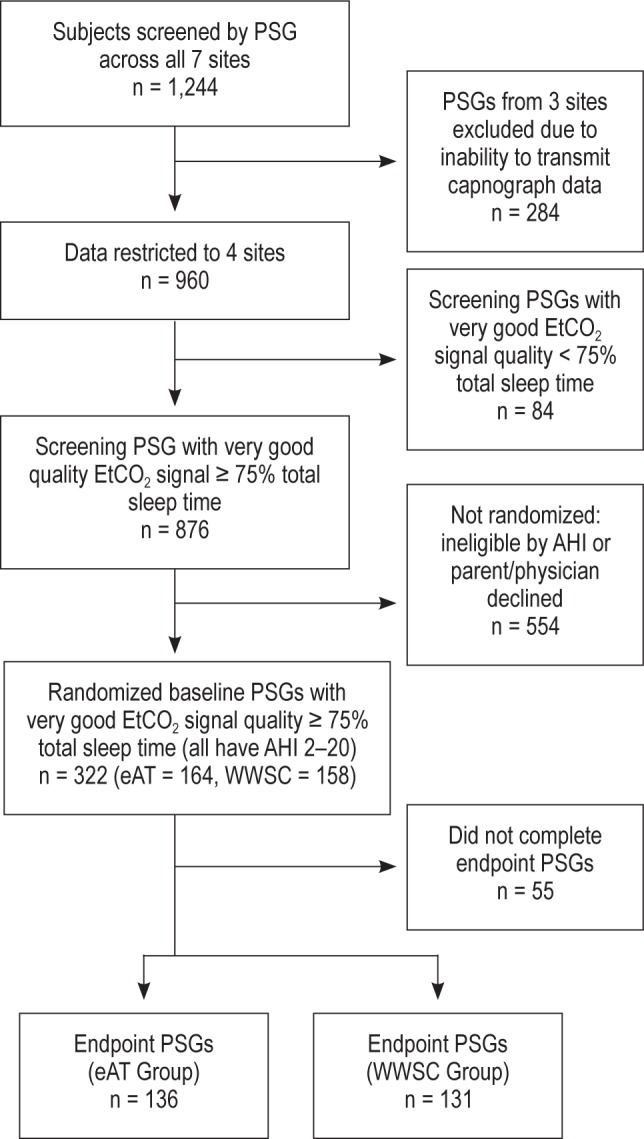
Recruitment through study completion. Data were analyzed from: screening PSGs for descriptive analyses, and randomized baseline PSGs and endpoint PSGs for longitudinal analyses. PSG, polysomnogram; EtCO2, end-tidal carbon dioxide; AHI, apneahypopnea index; eAT, early adenotonsillectomy group; WWSC, watchful waiting with supportive care group.
The design of the CHAT study has been previously described in detail9 and the primary cognitive and behavioral outcomes have been published.10 In brief, the CHAT study screened children ages 5.0–9.9 y with parental report of snoring. Exclusion criteria included recurrent tonsillitis, cardiovascular comorbidities, medication use for attention deficit/hyperactivity disorder or psychiatric disorders, body mass index (BMI) z-score ≥ 3, developmental delays requiring school accommodations, and known genetic, craniofacial, or neurological disorders likely to affect the airway, cognition, or behavior.
Seven sites recruited children from sleep centers, otolaryngology clinics, general pediatrics clinics, and the general community; three sites (n = 284 of 1,244) were excluded in the current analyses because of inability to transmit the capnography data from local polysomnographic systems to a central reading center. Children who snored and were adenotonsillectomy candidates with PSGs showing an obstructive apnea index (OAI) ≥ 1/h or AHI ≥ 2/h were eligible for randomization. Children with severe OSAS, defined as OAI > 20, AHI > 30, or percentage of sleep time with an oxygen saturation < 90% for > 2% TST were ineligible for randomization.
Children underwent standardized evaluations of anthropo-metric characteristics, cognitive and behavioral functions, and other measures at baseline and 6 mo after the intervention period. The following neurocognitive and behavioral assessments were completed: Developmental Neuropsychological Assessment (NEPSY)11 Attention/Executive Function using subtests Tower, Auditory, Visual Attention, Inhibition, and Word Generation to create the Core Domain score, the Conners Rating Scale Revised: long version using the Global Index Total T-score,12 and the Behavior Rating Inventory of Executive Function (BRIEF) using the Global Executive Composite score.13
Description of Signal Collection
Each child underwent a standardized screening PSG at baseline and endpoint, which were centrally scored by registered PSG technologists. All PSGs were performed in an accredited academic sleep laboratory.
Sites collected EtCO2 data on either the Novametrix Capno-graph (Respironics, Wallingford, CT) or the BCI Capnocheck (Smiths Medical, Waukesha, WI). BCI capnographs were used for EtCO2 collection on 43 PSGs in Cincinnati and 60 PSGs in Cleveland. Novametrix capnographs were used for EtCO2 collection in the other 857 PSGs. Because a small systematic difference in values from the two capnographs was observed in a substudy of 19 PSGs where both devices were used simultaneously (e.g., mean peak EtCO2 52.6 ± 4.1 SD versus 51.8 ± 4.3 mmHg for BCI versus Novametrix), the values from the BCI capnographs were adjusted using calibration equations as shown in the Appendix. No participants had blood gas measurements to validate EtCO2 values.
PSGs were performed, and scored in a manner consistent with recommendations of the AASM.14 The number of obstructive apneas and hypopneas per hour of sleep were calculated and reported as the AHI. Hypopneas were scored if a ≥ 50% reduction in airflow was accompanied by an arousal or ≥ 3% oxygen desaturation.14 For analyses, hypoventilation was defined as > 25% TST with EtCO2 > 50 mmHg1,14 and hypercapnia was quantified as the percentage of sleep time > 50 mmHg. Wake EtCO2 values were measured on the PSG, at the time of lights out and prior to sleep onset. An endpoint PSG was performed 7 mo following randomization.
Evaluation of Signal Quality
Data quality was assessed by a technologist using a five-point scale indicating percentage of sleep time when the EtCO2 signal was available, with excellent waveform and ideal plateau signal, and free from artifact. Categories were designated by signal quality present for > 95% TST (excellent); 75–94% TST (very good); 50–74% TST (fair); 25–49% TST (poor); or < 25% TST (very poor).
Statistical Approach
Continuous variables are presented as means and standard deviations (SD) and categorical variables as percentages. Spearman correlations were used to assess associations between EtCO2 variables and PSG variables, and between sleep measures and cognitive and behavior measures. Strength of correlations were categorized as strong (> 0.5), moderate (0.3–0.5), and weak (< 0.3).15 A kappa coefficient was used to describe agreement of classifications using EtCO2 and AHI variables. As 13% of screening PSGs met criteria for hypoventilation, we compared this group to the top 13% of PSGs with highest AHI values (AHI > 8.7). Two-sample t-tests were used to test whether the distributions of a continuous variable were similar between two independent groups. Paired t-tests were used to assess whether the distributions of a continuous variable were similar at screening and at endpoint. Chi-squared or Fisher exact tests (when the cell counts were small) were used to compare categorical variables. Multiple linear regression models were performed to assess association of EtCO2 with cognitive and behavioral measures while controlling for age, sex, and race. Analyses were restricted to only PSGs with “very good” quality EtCO2 signal for ≥ 75% of TST (n = 876; 91%). P values of less than 0.05 were considered to indicate statistical significance without multiple comparison adjustment. All statistical analyses were performed using SAS, version 9.3 (SAS Institute, Inc., Cary, NC).
RESULTS
Descriptive Analyses of Screening PSGs
EtCO2 Sensor Device Comparison and Signal Quality
Screening data were available for 960 subjects from four clinical sites. In general, the acquisition of “very good” quality signal (i.e., ≥ 75% TST) across the four sites was comparable, with more site-to-site variability in the proportion of signals with “excellent” signal quality (i.e., ≥ 95% of TST). Interpretable EtCO2 waveforms, graded as “very good,” were present for > 90% of children (n = 876) using a standardized protocol performed by certified technicians. Of the 325 children who were randomized and completed the endpoint PSG, 296 (91%) had EtCO2 signals graded as “very good”. Reasons listed by technicians for signal loss included mouth breathing, moisture in the nasal cannula, incorrect position of cannula in nares, or equipment and technical difficulties. The signal quality for baseline PSGs of randomized subjects was similar between the eAT arm and the WWSC arm (P = 0.44).
EtCO2 Correlations with Demographic Variables
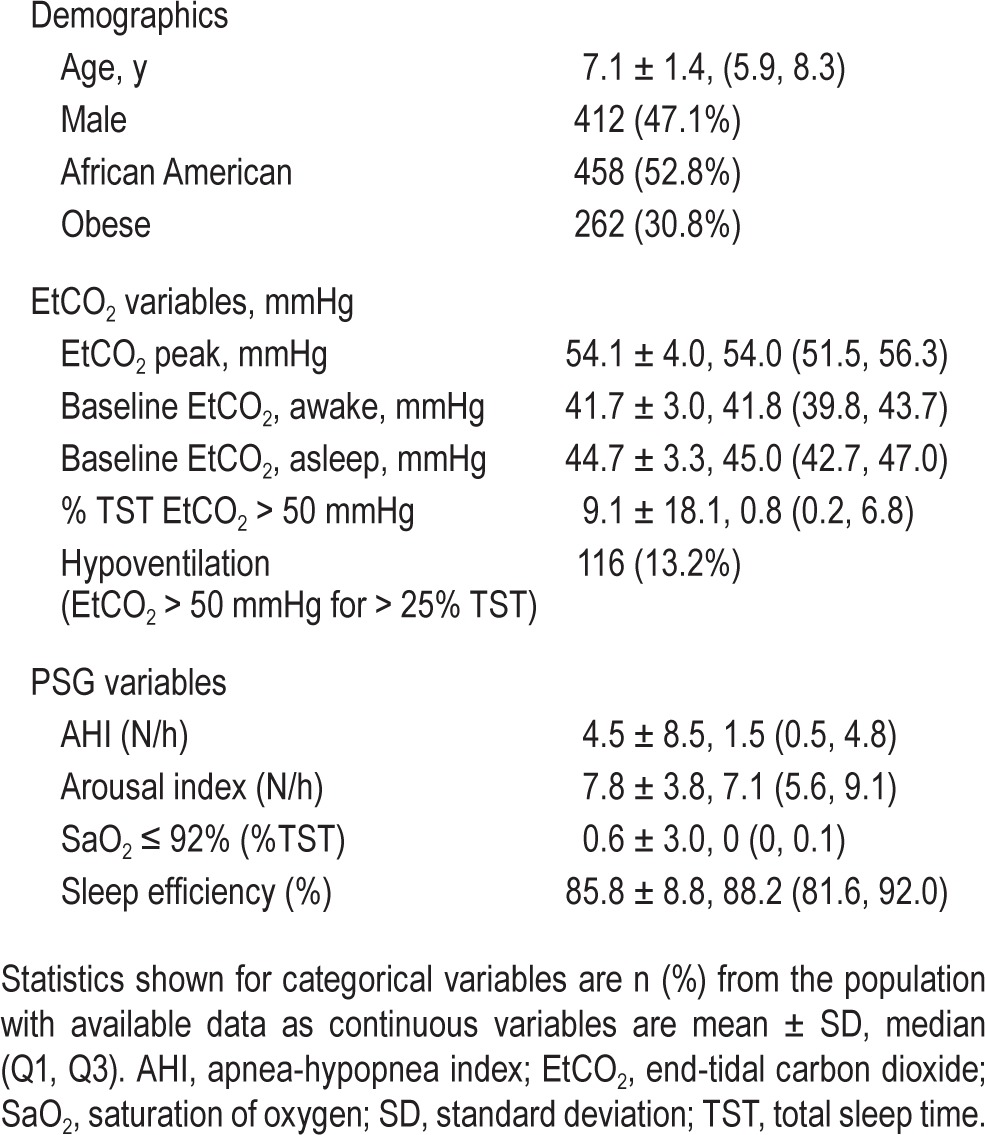
Table 1 summarizes the patient demographics and PSG variables in the screening sample with “very good” or better signal quality: 412 participants (47.1%) were boys, 458 (52.8%) were African American (AA), and 262 (30.8%) were obese. African American children had a higher percentage of TST with EtCO2 > 50 mmHg than non-AA children (P = 0.0004). Compared to non-AA children, AA children also had higher values for baseline wake EtCO2, baseline sleep EtCO2, maximum (peak) EtCO2, mean rapid eye movement EtCO2, and mean non-rapid eye movement EtCO2. These associations persisted after adjustment for age, sex, obesity and AHI (all P values < 0.03). EtCO2 variables were not associated with age or sex.
Table 1.
Baseline demographics, EtCO2 values and PSG variables in children with EtCO2 signal quality interpretable ≥ 75% total sleep time (n = 876).
Relationships between EtCO2 Values and PSG Variables
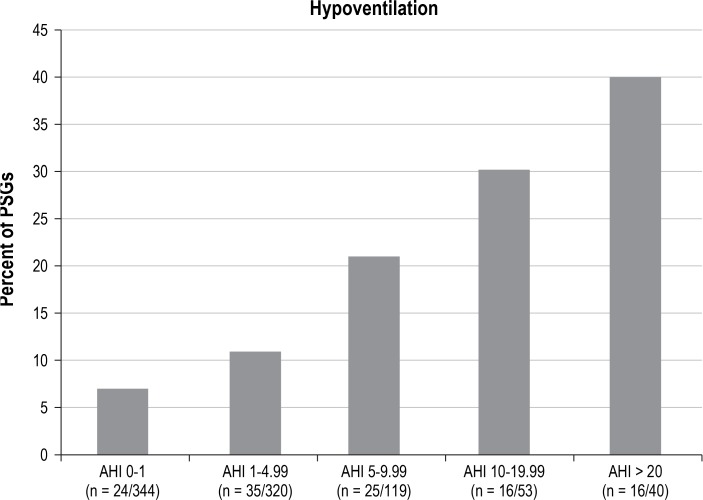
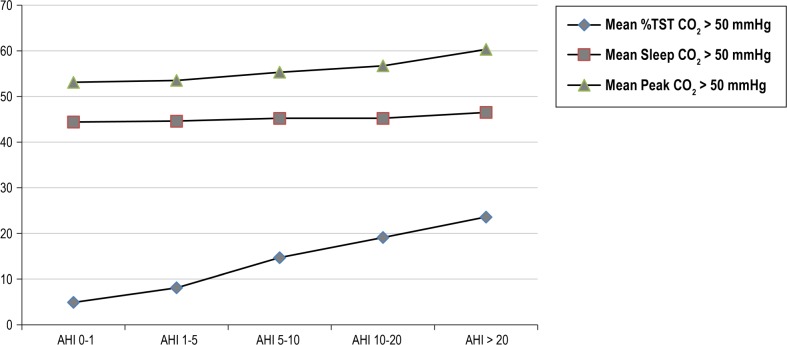
Increasing EtCO2 values were associated with AHI severity levels (Figures 2 and 3). Percentage of TST with EtCO2 > 50mmHg was modestly correlated with AHI (r = 0.33; P < 0.0001) and with percentage of TST spent with oxygen saturation ≤ 92% (r = 0.26; P < 0.0001); and weakly corre -lated with sleep efficiency (r = 0.08; P = 0.017). Similarly, peak EtCO2 values were modestly correlated with obstructive AHI (r = 0.31; P < 0.0001) and percentage of TST with oxygen saturation ≤ 92% (r = 0.29; P < 0.0001), and weakly correlated with sleep efficiency (r = 0.11; P = 0.0012). Arousal index did not correlate with either percent of TST with EtCO2 > 50 mmHg or peak EtCO2 (P = 0.085 and 0.64); neither did average saturation of oxygen (SaO2, P = 0.16 and P = 0.36).
Figure 2.
Hypoventilation and AHI categories. Among screening PSGs, an increase in hypoventilation was observed with an increase in AHI severity. AHI, apnea hypopnea index; PSGs, polysomnograms.
Figure 3.
End-tidal carbon dioxide (EtCO2) variables by AHI severity levels. The peak EtCO2 value was greater than 50 mmHg in 761 (86.9%) of screening polysomnograms. Test of linear trend of AHI severity P < 0.0001 for all categories. AHI, apnea-hypopnea index; TST, total sleep time.
Among the 876 screening PSGs, 116 (13.2%) showed EtCO2 > 50 mmHg for > 25% TST, meeting the criteria for hypoventilation. The agreement between percentage of TST with EtCO2 > 50 mmHg and AHI severity was compared using the top 13th percentiles of these two variables. Of 116 subjects with hypoventilation, 40 had AHI values in the top 13th percentile, showing only a modest agreement (kappa = 0.24, 95% confidence interval [CI]: 0.16–0.33).
EtCO2 Levels Compared during Wake and Sleep
Among the 876 screening PSGs with at least very good signal quality, mean sleep EtCO2 values were higher than wake values by an average of 3.0 mmHg ± 1.8 mmHg (P < 0.0001); with a maximum difference of 9 mmHg.
Longitudinal Analyses of Baseline and Endpoint PSGs of Randomized Participants
Change in EtCO2 Values at Endpoint: eAT Compared with WWSC
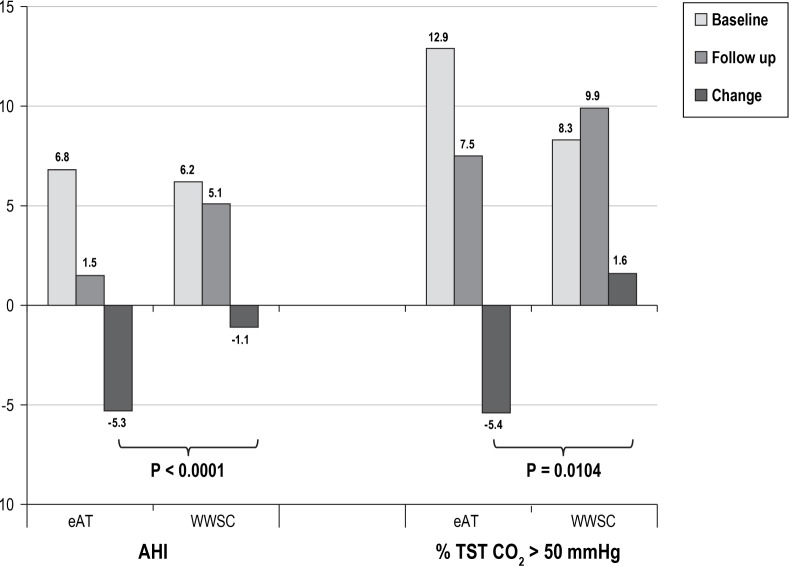
The %TST EtCO2 > 50 mmHg showed significantly more improvement after 6 mo in the eAT group compared to the WWSC group (P = 0.010, Cohen d effect size of 0.32). In contrast, the AHI improvement in the eAT group relative to the WWSC group was approximately twice as high as the improvement in EtCO2 between groups (P < 0.0001, Cohen d effect size of −0.61). See Figure 4.
Figure 4.
Comparison of AHI and percentage TST end-tidal carbon dioxide > 50 mmHg before and after adenotonsillectomy. A total of 267 children had baseline and endpoint polysomnogram data available (n = 136 eAT group; n = 131 WWSC group). AHI, apnea hypopnea index; eAT, early adenotonsillectomy; TST, total sleep time; WWSC, watchful waiting with supportive care.
Change in Hypoventilation on PSGs
Among the 876 screening PSGs evaluated, 116 (13%) met the criteria for hypoventilation and OSAS. Among the 322 children randomized, 55 (17%) met criteria for hypoventilation, 40 of whom had baseline and endpoint PSGs (25 from the eAT group; 15 from the WWSC group). Of these 40 children, 7 of 25 children in the eAT group had persistent hypoventilation and 13 of 25 had persistent AHI > 1 at follow-up.
In the WWSC group, 6 of 15 children had persistent hypoventilation and 11 of 15 had persistent AHI > 1 at follow-up. Of the 25 children in the eAT group who met criteria for baseline hypoventilation, the mean sleep EtCO2 was 49.5 mmHg on the baseline PSG and improved to 46.6 mmHg on the endpoint PSG, with a change of −2.8 mmHg (95% CI [−3.9, −1.7], P < 0.0001). A similar change was observed in the 15 children in the WWSC group who met criteria for hypoventilation, with a mean sleep EtCO2 of 49.4 mmHg on the baseline PSG that improved to 46.7 mmHg on the endpoint PSG, with a change of −2.7 mmHg (95% CI [−4.5, −1.0], P = 0.05). See Figure 5.
Figure 5.
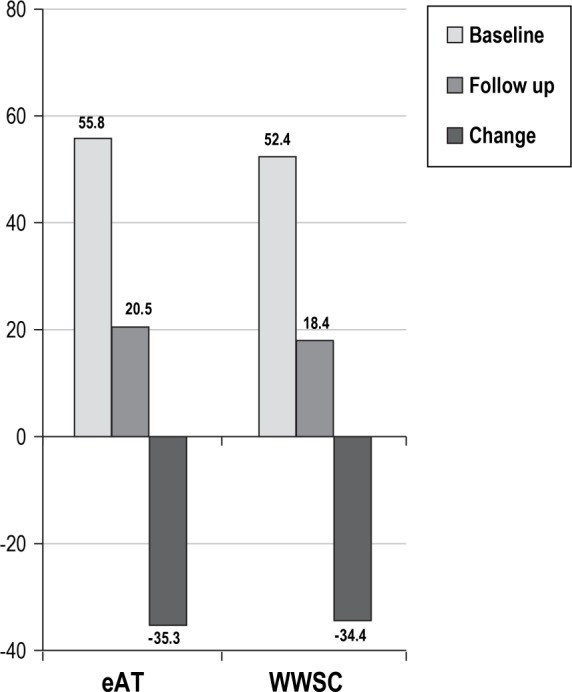
Change in hypercapnia in children with hypoventilation. Change in %total sleep time end-tidal carbon dioxide > 50 mmHg in randomized subjects who had hypoventilation on the baseline polysomnogram with follow-up data on endpoint polysomnogram (n = 25 eAT group; n = 15 WWSC group). eAT, early adenotonsillectomy; WWSC, watchful waiting with supportive care.
In the subset of children who underwent adenotonsillectomy and had a subsequent AHI < 1/h (n = 84), the %TST EtCO2 > 50 mmHg decreased significantly from 11.7% ± 20.9% at baseline to 6.7% ± 12.8% at follow-up (P = 0.03). Of these 84 children, 12 met criteria for hypoventilation on the baseline PSG whereas 3 children still met criteria for hypoventilation on the endpoint PSG. Mean wake EtCO2 values and mean sleep EtCO2 values were similar for baseline and endpoint PSGs (P = 0.91 and P = 0.69).
There were 227 randomized children who did not meet criteria for hypoventilation at baseline and had follow-up PSGs. In the eAT group, hypoventilation developed in 5 of the children (4.5%) and 39 (35%) had an AHI > 1 at endpoint. In the WWSC group, hypoventilation developed in 14 (12%) and 84 (72%) had an AHI > 1 at endpoint.
Change in Wake EtCO2 Levels
Among the baseline PSGs, 15.7% (42 of 267) showed mean wake EtCO2 values > 45 mmHg (eAT = 26 and WWSC = 16). Among endpoint PSGs, 14.6% (39 of 267) PSGs showed average wake EtCO2 > 45 mmHg (eAT = 19 and WWSC = 20). Only two screening baseline PSGs showed an average wake EtCO2 > 50 mmHg, one each, in the eAT and WWSC groups. Only one endpoint PSG was identified with an average wake EtCO2 > 50 mmHg in the WWSC group.
Hypercapnia and Cognitive or Behavioral Outcomes
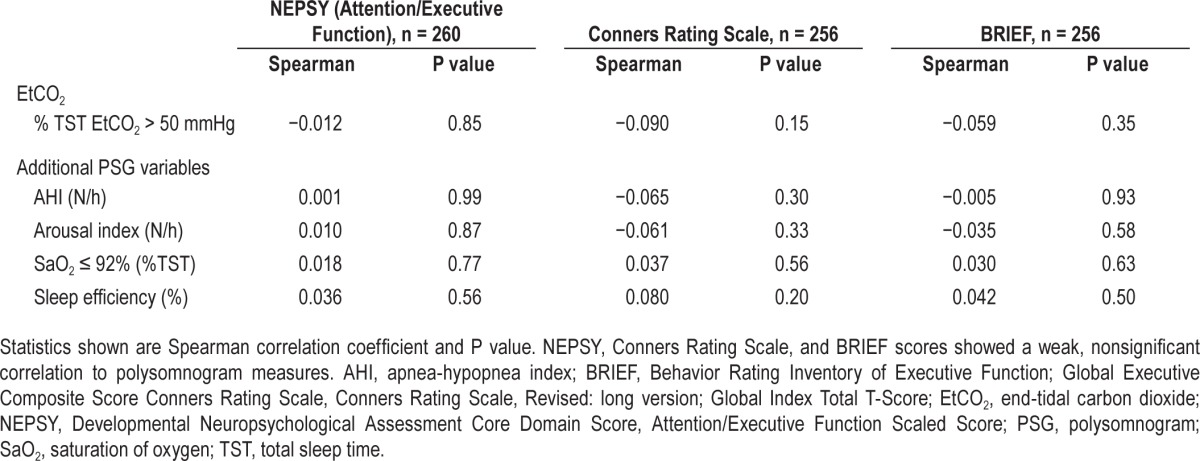
Baseline cognitive and behavioral parameters did not differ between children with hypercapnia and those without hypercapnia at baseline (P > 0.6). The baseline percentage of TST with EtCO2 > 50 mmHg did not correlate with changes on the cognitive and behavioral assessments at follow-up (see Table 2, r = −0.09 to −0.012, all P > 0.15). When controlling for age, sex, race, and the treatment assignment, the baseline percentage of TST with EtCO2 > 50 mmHg did not predict changes on the cognitive and behavioral assessments at follow-up (P > 0.3).
Table 2.
Polysomnographic variables and changes in cognitive measures.
DISCUSSION
This analysis of rigorously collected data from a large, randomized controlled trial of adenotonsillectomy for the treatment of pediatric OSAS identified several novel findings regarding EtCO2 levels in children undergoing polysomnography: (1) high-quality EtCO2 waveforms can be obtained from multiple sites in children with suspected OSAS using a standardized protocol performed by trained technicians; (2) approximately 13% of adenotonsillectomy candidates meet criteria for hypoventilation, including 5% with AHI levels < 1; (3) increasing EtCO2 values are associated with increasing AHI levels as well as levels of hypoxemia, although the correlations are modest; (4) increased EtCO2 levels and hypoventilation are more common in African American children than other children, even after adjusting for AHI and obesity; (5) EtCO2 levels improve significantly more with eAT than WWSC, but the effect size (or “responsiveness to surgery”) is less than for AHI change; (6) approximately 30% of children with hypoventilation at baseline have persistence of this after surgery; (7) neither baseline hypercapnia or change in EtCO2 levels predict baseline or change in cognitive and behavioral parameters. In aggregate, these findings indicate that collection of high-quality EtCO2 data in children with OSAS is feasible in multicenter studies; that there is unique information in EtCO2 signals, including identification of children with hypoventilation (and groups at risk for hypoventilation such as African Americans); but that there is no evidence supporting a role of EtCO2 monitoring for predicting behavioral or cognitive outcomes.
Although capnography data collection may be difficult, particularly in younger children with limited ability to cooperate with nasal sensors, our study shows that the capnography waveform was interpretable for more than 90% of children, even in the presence of adenotonsillar hypertrophy. Pediatric-focused technicians trained to perform basic troubleshooting protocols for this sensor was an important strategy for quality data collection. Sleep laboratory supervisors and technicians participated in monthly conference calls with the centralized scoring center to identify areas of improvement in data collection, which may have contributed to data quality. Despite these standardized protocols and training for all technicians in the CHAT study, a small amount of site-to-site variability in signal quality was observed. This may be due to different technical expertise in managing these sensors and highlights the importance of experienced pediatric technicians when high-quality data are needed. Nevertheless, the overall proportion of PSGs with very good EtCO2 signal was high.
We found that 13.2% of the CHAT participants met criteria for hypoventilation. This prevalence is higher than the reported prevalence of 2.2% children with hypercapnia in normative pediatric samples.3,6 This higher prevalence in our sample is likely related to a PSG-based diagnosis of OSA in all participants who were also clinically symptomatic.
As we had hypothesized, increased OSAS severity as measured by the AHI and time at low oxygen saturation levels, correlated with increased TST with EtCO2 > 50 mmHg, providing evidence for convergent validity for these measures, though modestly. In particular, classification of normal or severe OSAS using various threshold values for the AHI, level of overnight hypoxemia, and level of EtCO2 identified overlapping, but not synonymous subsets of children. Our results do not indicate whether the children uniquely identified with high EtCO2 levels are a subset that require alternative management or have a different prognosis. However, the finding that African American children were more likely to have hypoventilation in analyses adjusted for AHI and obesity suggests that EtCO2 monitoring may be useful for identifying children at increased risk for OSAS and its comorbidities. We also did not observe measures of EtCO2 to be more responsive to surgery than the AHI. In our study, EtCO2 measurements did not provide predictive information regarding baseline or postoperative cognition or behavior outcomes. However, a recent study showed that increased EtCO2 values were associated with increased risk of perioperative respiratory complications after adenotonsillectomy.16
An interesting observation was the finding that almost 5% of our sample with an AHI < 1/h on PSG met the EtCO2 criteria for hypoventilation. We assessed for hypoventilation in children with AHI < 1/h, as a current definition for OSAS in the International Classification of Sleep Disorders, Third Edition2 includes PSG with AHI > 1. A previous study of healthy, nonsnoring children reported that 2.2% of 226 subjects had an AHI < 1/h and EtCO2 values ≥ 50 mmHg during ≥ 50% TST, with a mean %TST ≥ 50 mmHg of 2.8 ± 11.3, range 0.0–85.2.6 Together, these reports suggest that hypoventilation may occur in a small proportion of relatively healthy children in the absence of apneas and hypopneas. Because participants with AHI < 1 were not eligible for randomization in the CHAT study, we do not have outcome data for this group. Hypoventilation in the absence of elevated AHI may be an important subset of sleep disordered breathing that requires further study. Because children with asthma and obesity were included in this study, the hypercapnia in these patients may have been related to these or other health problems. Alternatively, this finding may be spurious, reflecting measurement error or night-to-night variability.
Analysis from our large and standardized dataset provides information useful in considering the range of values of EtCO2 likely to be observed in a pediatric sleep laboratory. We found that although mean wake EtCO2 values are commonly > 45 mmHg, criteria for hypoventilation were rarely met. Only 2 of 267 children (0.7%) had an awake EtCO2 value > 50 mmHg. Our analysis showed a mean increase of EtCO2 of 3.0 ± 1.7 mmHg between wake and sleep. This is consistent with previously reported values of 3- to 4- mmHg rise in EtCO2 from wake to sleep states.3,7,17 We also observed that no child fulfilled the adult criterion for hypoventilation that requires a ≥ 10 mmHg increase in EtCO2 to values > 50 mmHg, during sleep lasting at least 10 min.1 Study strengths included the large sample, wide geographic and racial diversity, and use of standardized methods to assess baseline and follow-up characteristics, including use of a central sleep reading center and a randomized controlled design that allowed assessment of EtCO2 responsiveness to surgery. The study was limited by the lack of follow-up data on children with a baseline AHI < 2/h, an exclusion criteria for the CHAT study.
CONCLUSION
This is the first randomized controlled trial on pediatric sleep disordered breathing that allowed extensive analyses of EtCO2 values. Interpretable, very good EtCO2 waveforms were available for 91% of children with suspected OSAS studied at accredited pediatric sleep laboratories following a standardized protocol, even in the presence of adenotonsillar hypertrophy. Five percent of children were observed to have hypoventilation in the absence of elevated AHI levels. Increasing AHI severity levels were associated with increased risk of hypoventilation, though the correlation was modest. Thus, in clinical practice, EtCO2 can be anticipated to provide information that differs from other measures in a minority of children. The clinical applicability of this information, however, is not clear as the AHI, in comparison to EtCO2, was more responsive to adenotonsillectomy, and neither AHI nor EtCO2 predicted changes in cognitive and behavioral outcomes. However, the finding of elevations in EtCO2 levels in African American children suggests the potential that this information may be helpful in better characterizing OSAS differences across subgroups of children. Further investigation with other outcomes will be needed to determine whether EtCO2 monitoring provides outcome-relevant data among the 5% of children who have isolated elevations of EtCO2 during assessment of sleep disordered breathing.
DISCLOSURE STATEMENT
Financial Support provided by National Institutes of Health: UO1 HL83075, UL1RR024134, U54 RR023567. Respironics provided Novametrix capnographs for use in this study. Dr. Marcus has received research support from Phillips Respironics and Ventus. Dr. Rosen has been a consultant for Jazz Pharmaceuticals, Advance-Medical and Natus Medical. Dr. Redline reported that the study received equipment from Respironics for use in this trial. Dr. Redline has also reported that Brigham and Women's Hospital received research grant support from ResMed Foundation and research equipment (unrelated to this study) from Philips-Respironics and ResMed Inc. There was no off-label or investigational use of products. The other authors have indicated no financial conflicts of interest.
ACKNOWLEDGMENTS
The CHAT gratefully acknowledges the superb support of the CHAT research staff: Jean Arnold, Mary Ellen Carroll, Mary Anne Cornaglia, Beth Ann Compton, Judith Emancipator, Melissa Fernando, Amanda Goodman, Xiaoling Hou, Elise Hodges, Laurie Karamessinis, Kim Lacy, Megan Mc-Dougall, Daniel Mobley, Michelle Nicholson, Angela Orlando, Deborah L. Ruzicka, Gauri Sathe, Nancy Scott, Susan Surovec, Omarya Vega, Xingmei Wang, Catherine Williams, Vikki Kociela, Theresa Friederich, Angela Orlando, Casey Critchlow, Ted Otto, Jennifer Griggs, Helen Moore, Charles Bright, Tim Soberg, Teresa Soberg, Michelle Perry, Amy Parker, Bonnie Bahr, Diane Roth, Bonnie Kallaos, Alicia McGlaughlin, Tara Albert, Alan Wild, John Stith, Tom Sanford, Anthony Mikulec, Jessica Luitjohan, Karen Snyder, and Laura Misuraca. We also appreciate the generous participation of the families enrolled in the study. We are grateful for the helpful guidance during the study of the CHAT Data and Safety Monitoring Board: Lynn Taussig, MD (Chair); Thomas Anders, MD; Julie Buring, ScD; Karina Davidson, PhD; Estelle Gauda, MD; Steven Piantadosi, MD, PhD; Bennett Shaywitz, MD; Benjamin Wilfond, MD; Tucker Woodson, MD; Robert Zeiger, MD.
APPENDIX
In a small substudy of 19 polysomnograms, when both the Novametrix capnograph and BCI capnocheck were used, the following calibration equations were identified.
 |
 |
 |
 |
 |
 |
 |
REFERENCES
- 1.Berry RB, Brooks R, Gamaldo CE, Harding SM, Marcus CL, Vaughn BV for the American Academy of Sleep Medicine. Darien, IL: American Academy of Sleep Medicine; 2012. The AASM manual for the scoring of sleep and associated events: rules, terminology and technical specifications, Version 2.0. www.aasmnet.org. [Google Scholar]
- 2.American Academy of Sleep Medicine. International classification of sleep disorders. third edition. Darien, IL: American Academy of Sleep Medicine; 2014. [Google Scholar]
- 3.Montgomery-Downs HE, O'Brien LM, Gulliver TE, Gozal D. Polysomnographic characteristics in normal preschool and early school-aged children. Pediatrics. 2006;117:741–53. doi: 10.1542/peds.2005-1067. [DOI] [PubMed] [Google Scholar]
- 4.Kirk VG, Batuvong ED, Bohn SG. Transcutaneous carbon dioxide monitoring and capnography during pediatric polysomnography. Sleep. 2006;29:1601–8. doi: 10.1093/sleep/29.12.1601. [DOI] [PubMed] [Google Scholar]
- 5.Carno MA, Modrak J, Short R, Ellis ER, Connolly HV. Sleep associated gas exchange abnormalities in children and adolescents with habitual snoring. Pediatr Pulmonol. 2009;44:364–72. doi: 10.1002/ppul.21012. [DOI] [PubMed] [Google Scholar]
- 6.Marcus CL, Omlin KJ, Basinski DJ, et al. Normal polysomnographic values for children and adolescents. Am Rev Respir Dis. 1992;146:1235–9. doi: 10.1164/ajrccm/146.5_Pt_1.1235. [DOI] [PubMed] [Google Scholar]
- 7.Uliel S, Tauman R, Greenfeld M, Sivan Y. Normal polysomnographic respiratory values in children and adolescents. Chest. 2004;125:872–8. doi: 10.1378/chest.125.3.872. [DOI] [PubMed] [Google Scholar]
- 8.Kerbl R, Zotter H, Schenkeli R, et al. Persistent hypercapnia in children after treatment of obstructive sleep apnea syndrome by adenotonsillectomy. Wien Klin Wochenschr. 2001;113:229–34. [PubMed] [Google Scholar]
- 9.Redline S, Amin R, Beebe D, et al. The Childhood Adenotonsillectomy Trial (CHAT): rationale, design, and challenges of a randomized controlled trial evaluating a standard surgical procedure in a pediatric population. Sleep. 2011;34:1509–17. doi: 10.5665/sleep.1388. [DOI] [PMC free article] [PubMed] [Google Scholar]
- 10.Marcus CL, Moore RH, Rosen CL, et al. A randomized trial of adenotonsillectomy for childhood sleep apnea. N Engl J Med. 2013;368:2366–76. doi: 10.1056/NEJMoa1215881. [DOI] [PMC free article] [PubMed] [Google Scholar]
- 11.Korkman N, Kirk U, Kemp S. New York: Psychological Corporation; 1998. NEPSY: a developmental neuropsychological assessment manual. [Google Scholar]
- 12.Conners CK. Conners Rating Scales — Revised Technical Manual. 5th ed. North Tonawanda, NY: Multi-Health Systems; 2001. [Google Scholar]
- 13.Gioia GA, Isquith PK, Guy PK, Kenworthy L. Odessa, FL: Psychological Assessment Resources; 2000. Behavior rating inventory of executive function (BRIEF) [Google Scholar]
- 14.Iber C, Ancoli-Israel S, Chesson A, Quan S for the American Academy of Sleep Medicine. 1st ed. Westchester, IL: American Academy of Sleep Medicine; 2007. The AASM manual for scoring of sleep and associated events: rules, terminology and technical specification. [Google Scholar]
- 15.Cohen J. Statistical power analysis for the behavioral sciences. 2nd ed. New Jersey: Lawrence Erlbaum; 1988. [Google Scholar]
- 16.Thongyam A, Marcus CL, Lockman JL, et al. Predictors of perioperative complications in higher risk children after adenotonsillectomy for obstructive sleep apnea: a prospective study. Otolaryngol Head Neck Surg. 2014;151:1046–54. doi: 10.1177/0194599814552059. [DOI] [PMC free article] [PubMed] [Google Scholar]
- 17.Katz ES, D'Ambrosio CM. Pathophysiology of pediatric obstructive sleep apnea. Proc Am Thorac Soc. 2008;5:253–62. doi: 10.1513/pats.200707-111MG. [DOI] [PMC free article] [PubMed] [Google Scholar]


