Abstract
Production of energy in a cell must keep pace with demand. Photoreceptors use ATP to maintain ion gradients in darkness, whereas in light they use it to support phototransduction. Matching production with consumption can be accomplished by coupling production directly to consumption. Alternatively, production can be set by a signal that anticipates demand. In this report we investigate the hypothesis that signaling through phototransduction controls production of energy in mouse retinas. We found that respiration in mouse retinas is not coupled tightly to ATP consumption. By analyzing metabolic flux in mouse retinas, we also found that phototransduction slows metabolic flux through glycolysis and through intermediates of the citric acid cycle. We also evaluated the relative contributions of regulation of the activities of α-ketoglutarate dehydrogenase and the aspartate-glutamate carrier 1. In addition, a comprehensive analysis of the retinal metabolome showed that phototransduction also influences steady-state concentrations of 5′-GMP, ribose-5-phosphate, ketone bodies, and purines.
Keywords: calcium, mitochondria, photoreceptor, phototransduction, retina, anaerobic metabolism
Introduction
Warburg et al. (1) and Krebs (2) reported in the 1920s that tumors and retinas rely on aerobic glycolysis. Some of the biochemical mechanisms by which cancer cells adapt to aerobic glycolysis have been gleaned from investigations of specific metabolic adaptations of cancer cells either in culture or in a tumor (3, 4). Retinas offer distinct advantages for investigating aerobic glycolysis. They have high metabolic rates, a uniquely laminated structure, and the primary signaling pathway by which retinas respond to light is defined clearly.
Retinas convert 80–96% of glucose they consume into lactic acid (5–9), similar to the extent of aerobic glycolysis that fuels cancer cells (3). Aerobic glycolysis occurs primarily in photoreceptors (10) where the energy demands are very different in darkness than in light (5, 7, 11–13). In darkness energy is consumed within the inner segments to support ion pumping (5, 13). In light energy is consumed by the outer segments (OS)2 to support phototransduction and regeneration of visual pigments. A photoreceptor neuron also performs anabolic metabolism to replace the ∼10% of its OS material that is lost each day to phagocytosis by the retinal pigmented epithelium (14, 15).
Some of the carbons in glucose consumed by a retina reach the mitochondrial matrix where they are oxidized in biochemical reactions that reduce NAD+ to NADH. Transfer of electrons from NADH to O2 then generates a proton gradient across the mitochondrial inner membrane. In some tissues dissipation of the proton gradient is coupled tightly to ATP demand. In others, proton leakage can dissipate the gradient even without ATP synthesis (16). In this report we show that mitochondria in retinas are more uncoupled than mitochondria in other tissues.
The ability of a photoreceptor to respond to light, to release neurotransmitter, to regenerate visual pigment, to renew itself, and to remain viable requires that production of energy keeps pace with demand. That kind of support for normal photoreceptor physiology could be accomplished by coupling production to consumption directly. Alternatively, production of energy could be controlled by a signal that anticipates changes in demand. In this report we show how signaling through phototransduction controls production of energy.
Experimental Procedures
Reagents
Oligomycin was purchased from Enzo Life Sciences, Inc. (Farmingdale, NY). [U-13C]Glucose was from Cambridge Isotope Laboratories, Inc. (Andover, MA). Other 13C tracers and reagents were from Sigma unless otherwise specified.
Animals
C57BL/6 mice (6–8 weeks old) were purchased from The Jackson Laboratory (Bar Harbor, ME). Guanine nucleotide-binding protein subunit α1 (GNAT1) knock-out mice and double knock-out mice for GNAT1 and GNAT2 were obtained from Russ Van Gelder's laboratory at the University of Washington. Aralar/AGC1−/− mice (17) and their control littermates in Sv129/C57BL6 background were raised at Dr. Jorgina Satrústegui's laboratory (Autonomous University of Madrid, Madrid, Spain). The AGC1−/− and AGC1+/+ mice were analyzed at postnatal day 18 because AGC1−/− mice have a shortened lifespan of 22–23 days (18). Animals were dark-adapted 18 h before experiments. Experiments were performed in accordance with the Institutional Animal Care and Use Committee (IACUC) recommendations at the University of Washington guidelines after IACUC approval and with procedures approved in the Directive 86/609/EEC of the European Union and the Ethics Committee of the Universidad Autónoma de Madrid.
Retina Isolation and Culture
Mice were euthanized, and retinas were isolated from retinal pigment epithelium under ambient light or in darkness with night-vision goggles. Retinas were cultured in Krebs-Ringer/HEPES/bicarbonate (KRB) buffer at 37 °C in a 5% CO2 incubator as we previously reported (6, 19).
Retinal O2 Consumption ex Vivo
A flow culture system (20) was used to measure O2 consumption rate as in our previous report with minor modification (19, 21). Retinas were isolated into a nutrient mix containing 5 mm glucose, 5 mm lactate, 500 μm pyruvate, 1 mm glutamine, and 1 mm leucine in KRB buffer cut into four pieces and loaded into each chamber sandwiched with Cytodex beads. One layer between beads contains one retina (cut into four pieces) with a total of four retinas per chamber. The KRB buffer with the nutrient mix, 0.1% fraction V bovine serum albumin, and 1% penicillin/streptomycin/Fungizone was used as perifusion buffer and was continuously equilibrated with 5% CO2, 21% O2, balance N2 at 37 °C. O2 tension was measured by lifetime phosphorescence detection (Tau Theta, Inc). of an O2-sensitive dye (platinum tetrapentafluorophenyl porphyrin) (Frontier Science, Logan, UT) that was painted on the inside of the perfusion chamber. O2 consumption rate was calculated as the flow rate times the difference between inflow and outflow levels of O2.
Gas Chromatography/Mass Spectrometry (GC/MS) Analysis of Metabolites
The strategies and methods we use for quantifying metabolites in retinas have been described in detail (22). Individual mouse retinas were incubated with [U-13C]glucose for specific intervals in an incubator at 5% CO2, 21% O2, balance N2 at 37 °C in darkness or light (with a battery-powered LED light source inside the incubator; ∼ 200 lux). The retinas were quenched in cold saline and homogenized in an ice-cold mix of methanol/chloroform/water. Metabolites were extracted, dried, derivatized, and analyzed by GC-MS (Agilent 7890/5975C) as described in detail elsewhere (6, 19). Peaks were analyzed using Chemstation, a software package developed by Agilent. The measured distributions of mass isotopomers were corrected for natural abundance of 13C using IsoCor software (23). Metabolite intensity and elution times were defined with standards and verified by mass after each experiment.
Liquid Chromatography/Mass Spectrometry (LC/MS) Analysis of Metabolites
The strategies and methods we use for quantifying metabolites in retinas have been described in detail (22). Mice were kept in darkness for 16 h. Half of the mice were exposed to room light (∼500 lux) beginning at 9:00 a.m., whereas the rest of the mice remained in darkness. The retinas were isolated (either in darkness or light) at 9:02 a.m., 11 a.m., and 3 p.m. into cold Hanks' balanced salt solution and snap-frozen in liquid nitrogen. Metabolites were extracted by the same method we used for GC-MS analysis. The dried metabolites were reconstituted in 200 μl of 5 mm ammonium acetate in 95% water, 5% acetonitrile, 0.5% acetic acid and filtered through 0.45-μm PVDF filters (Phenomenex, Torrance, CA). The steady-state metabolites were measured by targeted analysis of 158 transitions by LC MS/MS as previously reported (24–26).
Acetonitrile, ammonium acetate, and acetic acid (LC-MS grade) were all purchased from Fisher. The standard compounds corresponding to the measured metabolites were purchased from Sigma and Fisher. Stable isotope-labeled tyrosine and lactate internal standards (l-[13C2]tyrosine and sodium l-[13C3]lactate) were purchased from Cambridge Isotope Laboratories, Inc. (Tewksbury, MA). The purities of non-labeled standards were >95–99%, whereas the purities of the two 13C-labeled compounds were >99%.
All LC-MS/MS experiments were performed on an Agilent 1260 LC (Agilent Technologies, Santa Clara, CA)-AB Sciex QTrap 5500 mass spectrometer (AB Sciex, Toronto, ON, Canada) system. Each sample was injected twice, 10 μl for analysis using negative ionization mode and 2 μl for analysis using positive ionization mode. Both chromatographic separations were performed in hydrophilic interaction chromatography (HILIC) mode on two SeQuant ZIC-cHILIC columns (150 × 2.1 mm, 3.0-μm particle size, Merck KGaA, Darmstadt, Germany) connected in parallel. The flow rate was 0.300 ml/min, auto-sampler temperature was kept at 4 °C, and the column compartment was set at 40 °C. The mobile phase was composed of solvents A (5 mm ammonium acetate in 90% H2O, 10% acetonitrile, 0.2% acetic acid) and B (5 mm ammonium acetate in 90% acetonitrile, 10% H2O, 0.2% acetic acid). After the initial 2-min isocratic elution of 75% B, the percentage of solvent B decreased to 30% at t = 5 min. The composition of solvent B was maintained at 30% for 4 min (t = 9 min), and then the percentage of B gradually went back to 75% to prepare for the next injection.
The mass spectrometer is equipped with an electrospray ionization source. Targeted data acquisition was performed in multiple reaction monitoring mode. We monitored 99 and 59 multiple reaction monitoring transitions in negative and positive mode, respectively (158 transitions in total). The whole LC-MS system was controlled by Analyst 1.5 software (AB Sciex, Toronto, ON, Canada). The extracted multiple reaction monitoring peaks were integrated using MultiQuant 2.1 software (AB Sciex).
O2 Consumption Measurements of Isolated Mitochondria
Mouse retina mitochondria were isolated by a method previously reported (21). O2 consumption was measured in an Oroboros Oxygraph-2K. The respiration buffer consisted of 150 mm KCl, 10 mm KH2 PO4, 67 μm EGTA, 1 mm MgCl2, pH 7.4. 50 μl of 2.5 mg/ml mitochondria was injected into the chamber for each assay. Respiration was measured in response to serial additions of ADP followed by either pyruvate/malate or glutamate/malate and then stepwise addition of CaCl2. Final concentrations were either 1.5 mm pyruvate and 0.5 mm malate or were 1 mm glutamate and 0.5 mm malate and 2.5 mm ADP. After the addition of each component, the O2 consumption rate was allowed to stabilize for 5 min before the next addition. Free Ca2+ concentrations were determined in a separate experiment with identical buffers except that fluorescence from Fluo-3 was monitored. The free Ca2+ concentrations were determined from this titration curve assuming a Kd of Fluo-3 for Ca2+ of 390 nm.
Results
Respiration Is Uncoupled from ATP Synthesis More in Retina Than in Other Tissues
We evaluated proton leak in mouse retinas by measuring the O2 Consumption rate (OCR) that continues even when ATP synthase is inhibited by oligomycin (27). We then determined the retina's maximum possible OCR by dissipating the gradient with FCCP (Fig. 1A). Titrations with oligomycin and FCCP showed that the effects were maximal and stable at 50 μm oligomycin and 1 μm FCCP. We used 5 mm glucose, 5 mm lactate, 500 μm pyruvate, 1 mm glutamine, and 1 mm leucine because this mix produced the most stable OCR.
For comparison we measured OCR from cerebellum slices and from pancreatic islets. Oligomycin inhibited O2 consumption by slices of cerebellum to about the same extent as O2 consumption by retina (Fig. 1B), but the FCCP-induced stimulation of OCR by cerebellum slices was far greater than for retina. The effects of both oligomycin and FCCP are greater with islets than with retina (Fig. 1C).
FIGURE 1.
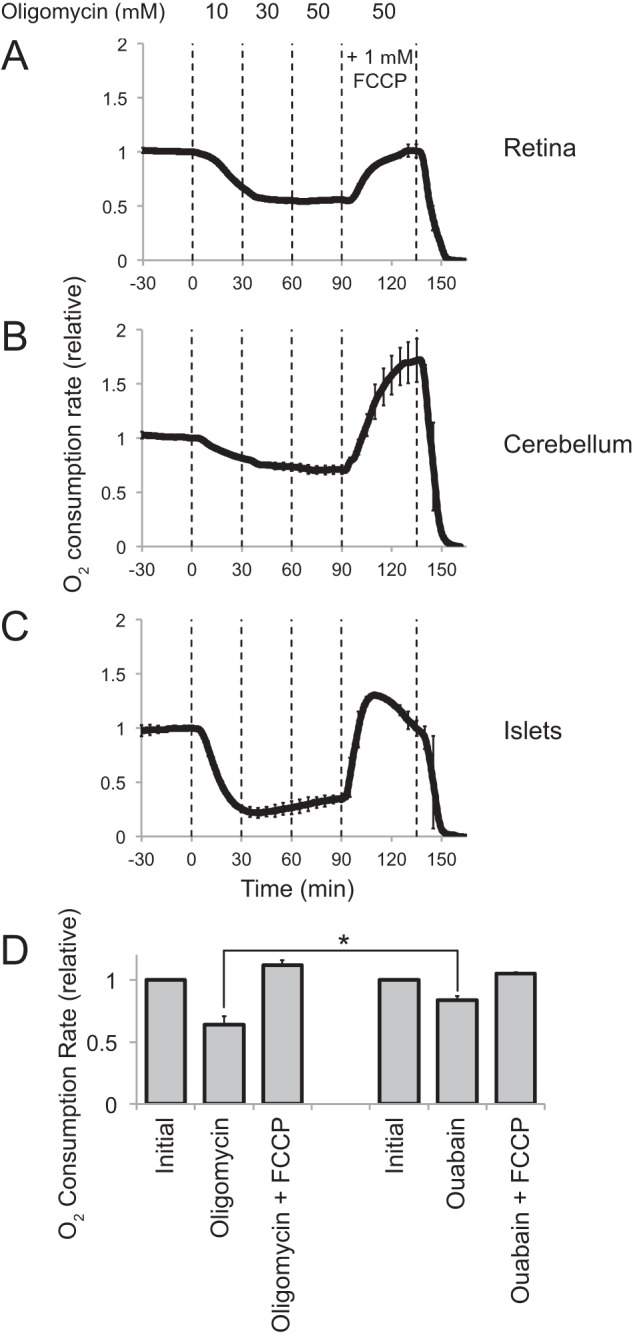
Respiration in retinas operated closer to maximum capacity, and it was more uncoupled from ATP synthesis than in other tissues. O2 consumption by isolated mouse tissue was measured with a perifusion apparatus (described under “Experimental Procedures”). Vertical dashed lines indicate transitions between media with different components. After O2 consumption stabilized, increasing concentrations of oligomycin were used to inhibit the mitochondrial ATP synthase. FCCP then was added to uncouple respiration from ATP synthesis. Each trace represents an average. Error bars represent S.E. Data are normalized to the initial O2 consumption rate for each experiment. A, O2 consumption by light-adapted mouse retinas (n = 4). The maximum OCR (after adding FCCP) for light-adapted mouse retina averaged from all the analyses done for this report was 0.40 ± 0.13 (S.D.) nmol of O2/min/mg wet weight of retina (n = 11). B, O2 consumption by cerebellum slices (n = 3). Maximum OCR for cerebellum slices was 0.44 ± 0.08 nmol of O2/min/mg (n = 2). C, O2 consumption by pancreatic islets (n = 2, error bars report range). Maximum OCR for islets was 2.1 ± 0.4 nmol of O2/min/mg (n = 2). D, comparison of effects of oligomycin and ouabain on OCR by light-adapted mouse retinas. Neither oligomycin (left, n = 3) nor ouabain (right, n = 4) inhibited retinal O2 consumption by greater than ∼40%. The star indicates that the probability is 0.04 that the inhibition caused by ouabain could be the same or greater than the inhibition caused by oligomycin.
These results highlight two remarkable features of retina. First, the initial OCR is nearly the same as with FCCP, showing that dissipation of the proton gradient is not rate-limiting for respiration. Second, >50% of respiration persists when ATP synthesis is blocked by oligomycin. As an alternative way to restrict the need for ATP synthesis we also used ouabain to inhibit Na+/K+ ATPase. We predicted that if oligomycin is not completely effective, then ouabain would inhibit respiration more than oligomycin. Instead, we found that ouabain was even less effective than oligomycin (Fig. 1D).
Oligomycin-insensitive O2 Consumption Originates in Mitochondria
We considered the possibility that oligomycin-insensitive respiration in retinas could be caused by non-mitochondrial O2 consumption. However, we found that OCR in the presence of 500 μm allopurinol, which inhibits xanthine oxidase, and 100 μm apocynin, which inhibits NADPH oxidase, was 102% ± 1% (n = 2) of the OCR in the absence of the inhibitors.
Uncoupled O2 Consumption Originates in Rods
Rods are the most abundant and unique cells in a retina. To confirm that rods are responsible for the unique metabolic features of the retina, we analyzed OCR over a range of developmental stages. Fig. 2A shows that the muted responses to oligomycin and FCCP, which are characteristic of adult retinas, appear only as rods become functional, between postnatal days 11 and 14. Fig. 2B shows that the responses to oligomycin and FCCP are less muted in adult AIPL1−/− retinas that lack photoreceptors.
FIGURE 2.
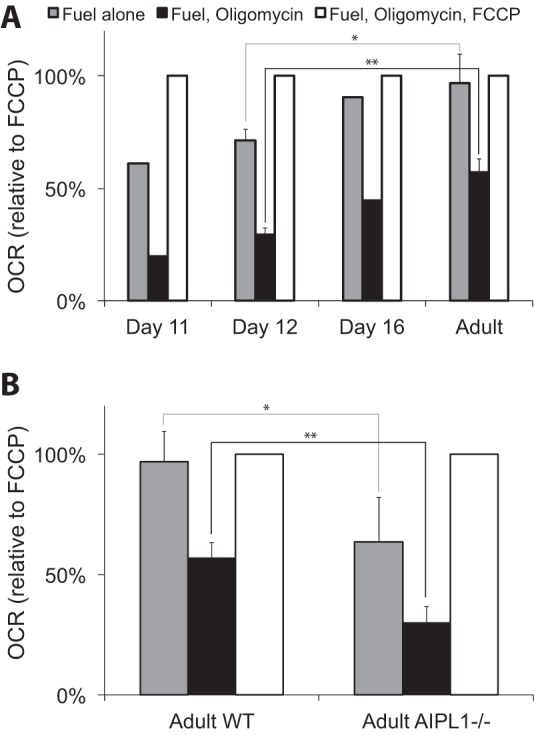
Uncoupled respiration occurred only when mature photoreceptors were present. A, O2 consumption by isolated light-adapted mouse retinas collected from postnatal days 11, 12, and 16 (n = 2 for day 12, n = 1 for day 11, and 16 and n = 5 for adult). * indicates p = 0.022, and ** indicates p = 0.001. Retinas were treated with 50 μm oligomycin and then oligomycin plus 1 μm FCCP. These results show how the nearly equal respiration rates with versus without FCCP and the large fraction of respiration that is oligomycin-insensitive become apparent only as the rod photoreceptors become functional between postnatal days 11 to 16. The absolute maximal (FCCP stimulated) OCRs for postnatal day 11 and 12 retinas was 1.71 ± 0.21 (S.D.) nmol/min/retina (n = 3), and for adult retinas it was 1.16 ± 0.38 (S.D.) nmol of O2/min retina. p = 0.014 for the hypothesis that the 11–12-day and adult OCRs are the same. B, comparison of the effects of oligomycin and FCCP on O2 consumption by adult WT retinas (n = 5) and adult AIPL1−/− retinas (n = 4). * indicates p = 0.031, and ** indicates p = 0.001. The absolute maximal (FCCP stimulated) OCR for AIPL1−/− retinas was 1.18 ± 0.16 nmol of O2/min/retina (corresponding to 0.58 nmol/min/mg wet weight of retina).
Oligomycin-insensitive O2 Consumption Derives from Complex I, Not Complex II
Mitochondria fueled with pyruvate/malate are tightly coupled to ATP synthesis so they have low respiratory activity without ADP (28). In contrast, mitochondria fueled with succinate consume O2 even without ADP (28). This has been attributed to greater proton leak with succinate as fuel. We explored the possibility that oligomycin-insensitive respiration is driven by succinate oxidation. Malonate inhibits succinate oxidation by complex II, whereas rotenone inhibits complex I. We found that 20 mm malonate does not affect the oligomycin-insensitive respiration in retinas (Fig. 3A), whereas 1 μm rotenone inhibits all of it (Fig. 3B).
FIGURE 3.
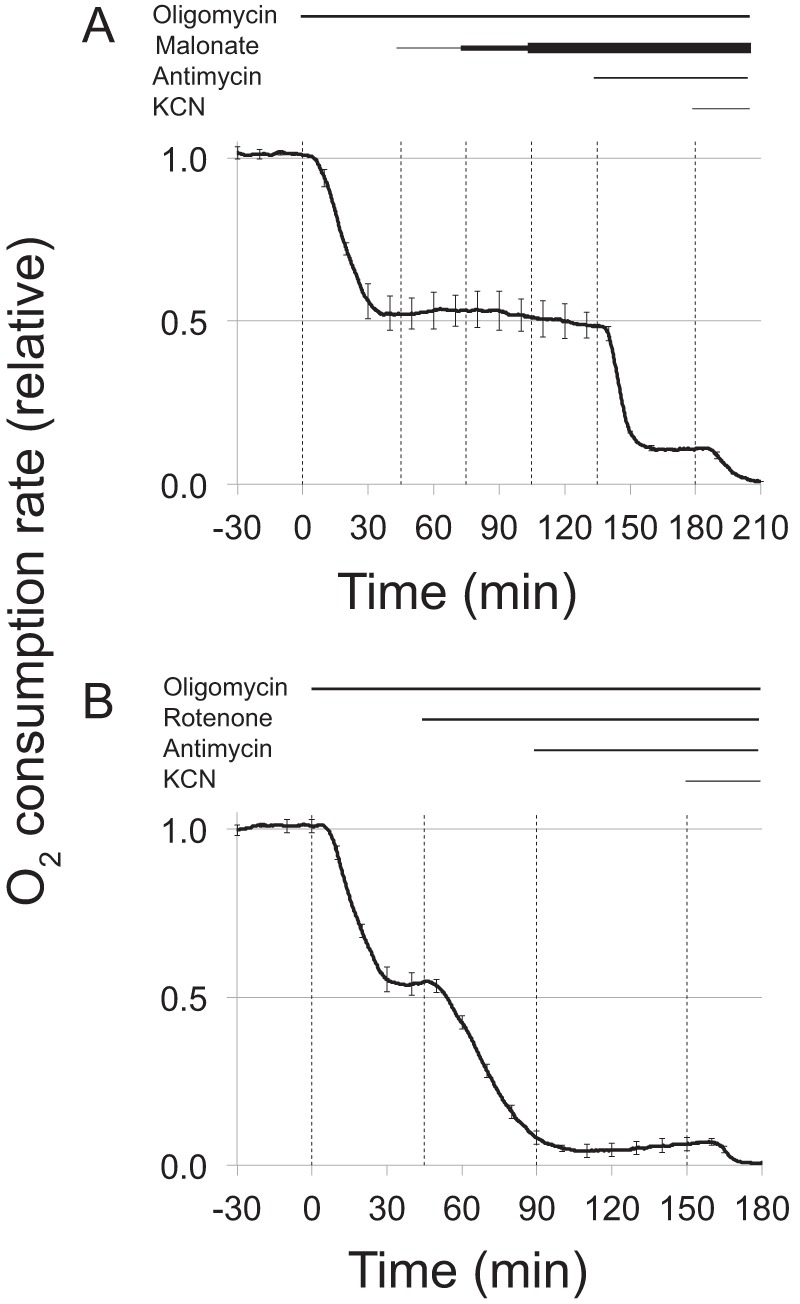
Oligomycin-insensitive respiration in retinas began in complex I. A, malonate, a complex II inhibitor, does not block the oligomycin-insensitive respiration by mouse retinas. Malonate is an inhibitor of succinate dehydrogenase activity of complex II. This figure shows that it does not inhibit the oligomycin-insensitive respiration. O2 consumption by isolated light-adapted mouse retinas was measured in the presence of 5 mm glucose. Sequential additions of 30 μm oligomycin, + 5 mm malonate, then 10 mm malonate, and then 20 mm malonate were followed by the addition of 1 mg/ml antimycin A and then KCN. n = 2; error bars show the range). B, rotenone, a complex I inhibitor, blocks the oligomycin-insensitive respiration by mouse retinas. Rotenone is an inhibitor of complex I. This figure shows that it does inhibit the oligomycin-insensitive respiration. O2 consumption by isolated light-adapted mouse retinas was measured in the presence of 5 mm glucose. Sequential additions of 30 μm oligomycin and 1 μm rotenone were followed by the addition of 1 mg/ml antimycin A and then KCN. n = 2; error bars show the range.
Illumination Inhibits Respiration
We evaluated the effects of light and darkness on retinas from dark-adapted mice. OCR was measured in complete darkness for 30 min, and then the retina was illuminated. Light reduced OCR (Fig. 4A). Light does not affect OCR in GNAT1−/− retinas, in which phototransduction is disabled (29) (Fig. 4B). Based on a comparison of the data in panels A and B, light inhibits OCR by 9%. Uncoupling is the same in control and GNAT1−/− retinas. The increase in OCR upon adding FCCP was 60.5% ± 9.0% for GNAT1+/+ retinas (n = 3) and 60.8 ± 4.7% for GNAT1−/− retinas (n = 3).
FIGURE 4.
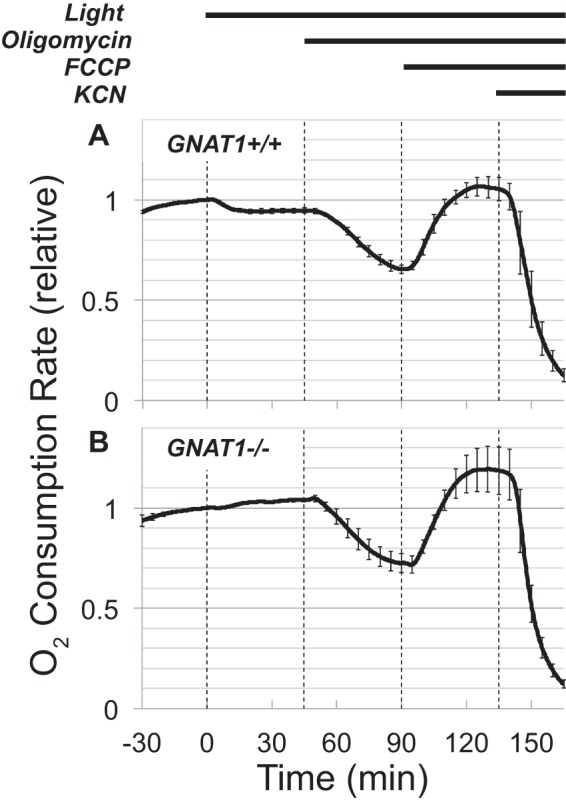
Inhibition of O2 consumption by light required phototransduction. Retinas were isolated from dark-adapted mice, and their O2 consumption was measured in the dark. The retinas then were illuminated and exposed to oligomycin and FCCP. The inhibitory effect of light did not occur in GNAT1−/− retinas deficient in rod transducin. A, O2 consumption from GNAT1+/+ retinas. Maximal OCR for GNAT1+/+ retinas was 1.16 ± 0.38 (S.D.) nmol of O2/min retina (n = 11). B, O2 consumption from GNAT1−/− retinas. Maximal OCR for the GNAT1−/− retinas was 0.93 ± 0.23 (S.D.) nmol of O2/min retina (n = 3). The effect of light is significant. At 45 min the GNAT1+/+ OCR was 95% ± 2% of the OCR at time 0, whereas the GNAT−/− OCR was 104% ± 1% of the OCR at time 0. The difference between light and dark OCR is significant (p = 0.007). As can be seen from the error bars, the gradual upward baseline drift occurred consistently throughout each of the six experiments in this set of experiments.
Glycolysis Is Slightly Faster in Darkness than in Light
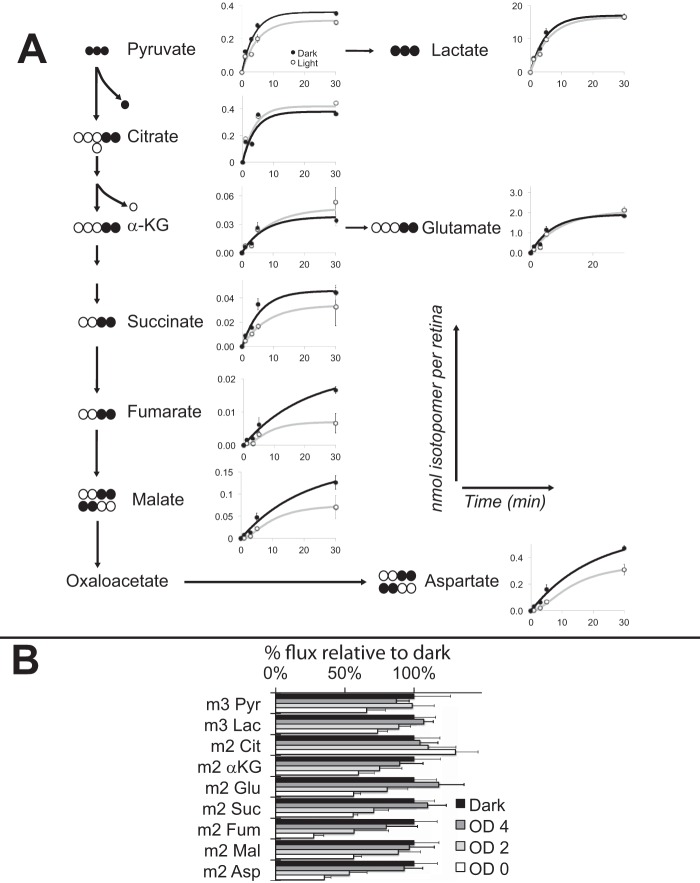
Metabolic flux in adult mouse retinas is fast (6), so we harvested retinas at 1, 3, 5, and 30 min after adding [13C]glucose. We then extracted metabolites and measured incorporation of 13C by mass spectrometry. The top panels of Fig. 5A show that flux through pyruvate is 45% faster and through lactate is 24% faster in darkness than light.
FIGURE 5.
Illumination inhibited the flow of carbons from glucose through glycolysis and mitochondrial metabolites. A, dark-adapted mouse retinas were isolated and cultured either in darkness or in light in media with [U-13C]glucose. At specified times after the addition of labeled glucose retinas were extracted. Metabolites and their isotopomers were quantified by GC-MS. The schematic outlines metabolic pathways, and the isotopomers that were evaluated. The graphs report nmol of each isotopomer per retina at 1, 3, 5, and 30 min (n = 2–4). Error bars represent S.D. The apparent initial rates used to fit the data in these graphs are (in nmol/min) pyruvate (Pyr; l) 0.062 (d) 0.09; lactate (Lac; l) 2.75, (d) 3.4; citrate (Cit; l) 0.11, (d) 0.10; α-KG (l) 0.005, (d) 0.005; Glu (l) 0.21, (d) 0.27; succinate (Suc; (l) 0.004, (d) 0.008; fumarate (Fum; l) .00017, (d) 0.00053; malate (Mal; l) 0.00027, (d) 0.004; Asp (l) 0.012, (d) 0.043. B, sensitivity of the effect of light on retinal metabolism. Retinas were isolated in the dark and either kept in the dark or exposed to white light for 30 s. Illumination was attenuated by neutral density filters. The energy from the unattenuated light source (OD 0) was equivalent to that of the 200 lux illumination in other experiments described in this report. After the 30-s exposure, retinas were transferred to medium in which 5 mm unlabeled glucose was replaced by 5 mm [U-13C]glucose. The incubation then was continued under the same illumination conditions for three more minutes before harvesting the retinas and extracting metabolites for GC-MS analysis. The effects of light on total metabolite levels are reported in supplemental Fig. S1A.
Light Slows Metabolic Flux after of α-Ketoglutarate in the TCA Cycle
Incorporation of 13C from [U-13C]glucose (Fig. 5A) confirmed a previous demonstration with the same method that retinal metabolism is dominated by aerobic glycolysis (6). We found that the reaction most substantially inhibited by light in adult mouse retinas is oxidation of α-ketoglutarate (α-KG). Delayed flow of 13C into downstream metabolites, fumarate, malate, and aspartate, appears to be a consequence of slowed production of succinate.
Retinal Metabolism Is Extraordinarily Sensitive to Light
The preceding results compared dark-adapted retinas to retinas illuminated at the level of a typical laboratory environment. To estimate sensitivity we compared metabolic flux in darkness to flux under illumination at 100, 1, or 0.01% of the illumination used in the other experiments described in this report. Fig. 5B shows that the metabolic response of the retina is altered by illumination at 1% of room light levels. This is consistent with control of metabolic flux by phototransduction in rods.
Transducin-mediated Phototransduction Controls Energy Metabolism
Fig. 6B compares incorporation of 13C into key metabolic intermediates in darkness or in light 5 min after the addition of [13C]glucose. We evaluated the role of phototransduction by repeating the analysis with GNAT1−/− retinas that are deficient in rod phototransduction. Comparison of panels B and C of Fig. 6 shows that phototransduction is required for the effect of light on metabolic flux.
FIGURE 6.
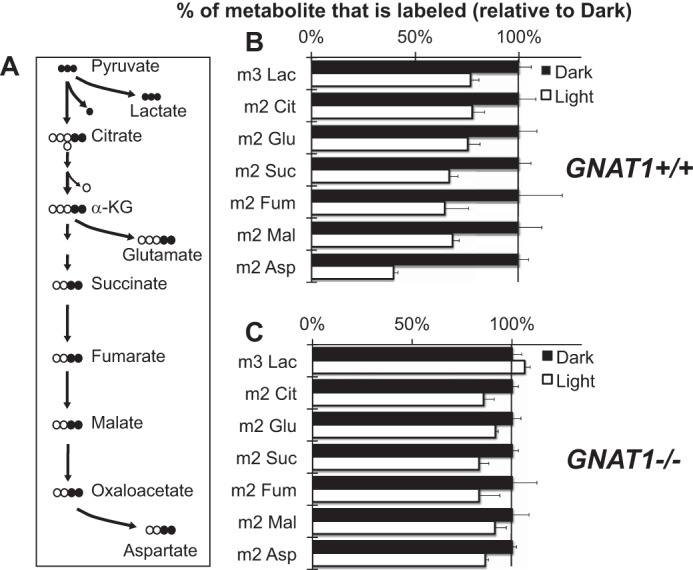
Phototransduction was required for the effect of light on metabolic flux. A, the schematic shows the metabolic pathways and isotopomers that were evaluated. Dark-adapted mouse retinas were isolated and cultured either in the dark or in light with [U-13C]glucose as in Fig. 5. B, metabolites were extracted after 5 min and quantified (n = 6–8, error bars report S.E.). Lac, lactate; Cit, citrate; Suc, succinate; Fum, fumarate; Mal, malate. C, the effect of light on metabolic flux is suppressed when a deficiency in GNAT1 blocks phototransduction in rods (n = 4 for light and n = 3 for dark). The graphs show the % change in the accumulation of each of the specified isotopomers after 5 min.
Phototransduction Can Influence Metabolism via the Effects of Ca2+ on Mitochondrial Activities
In darkness [Ca2+]f is 250 nm in the OSs of mouse rods. Light lowers it to 23 nm (30). We hypothesized that the light-stimulated change in cytosolic [Ca2+]f could influence mitochondrial activity. Cytosolic [Ca2+]f stimulates AGC1 (31–34), an electrogenic exchanger on mitochondrial inner membranes that exports aspartate in exchange for glutamate. AGC1 plays a central role in the malate aspartate shuttle (Fig. 7A), and it is abundant in photoreceptors (9, 35). Cytosolic Ca2+ also can enter the mitochondrial matrix via the mitochondrial Ca2+ uniporter (36). Within the mitochondrial matrix α-ketoglutarate dehydrogenase (α-KGDH) is sensitive to Ca2+ (37, 38). A decrease in matrix [Ca2+]f can raise the Km of α-KGDH.
FIGURE 7.
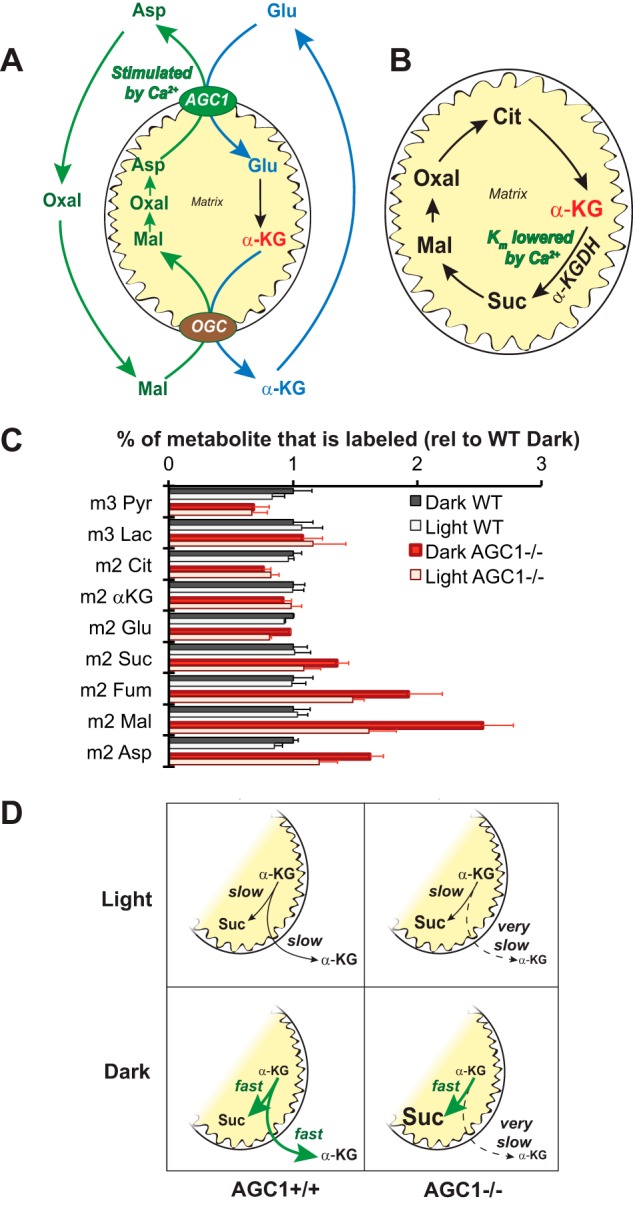
There were two opposing effects of Ca2+ on α-KG. A, schematic illustration of the malate-aspartate shuttle. AGC1 activity is stimulated by Ca2+. The increased flux can lead to increased production of malate, which can drive export of α-KG from the matrix through the oxoglutarate carrier translocator. Lac, lactate; Cit, citrate; Suc, succinate; Fum, fumarate; Mal, malate; Oxal, oxaloacetate; Pyr, pyruvate. B, Ca2+ also can regulate oxidation of α-KG by lowering the Km of α-KGDH. C, retinas from 18 days postnatal AGC1+/+ (black and white bars) or AGC1−/− (red and pink bars) littermates from the crosses were incubated with [13C]glucose for 5 min in either the dark or light before harvesting and extracting the retinas. Error bars represent S.E. n = 11–19. Supplemental Fig. S1B shows the effects of light on the corresponding total metabolite levels. D, The left side shows a schematic illustration of how the two opposing effects on α-KG offset each other so that there is no net change in flux between light and the dark in young mouse retinas. The right side shows how the effect of light on the Km of α-KGDH is revealed by inactivation of AGC1.
Two Ca2+-sensitive Pathways Compete for α-KG
Analysis of isolated mitochondria has shown (39) that Ca2+ has opposing and competing effects on α-KG. In Fig. 7, A and B, α-KG is highlighted in red.
At higher cytosolic [Ca2+]f, AGC1 is active (Fig. 7A). It exports aspartate to the cytoplasm to produce malate. Malate drives the oxoglutarate carrier to remove α-KG from the matrix. At low [Ca2+]f, slower production of cytosolic malate causes accumulation of α-KG in the matrix. We confirmed AGC1 works in retinas using mitochondria from mouse retinas (Fig. 8).
FIGURE 8.
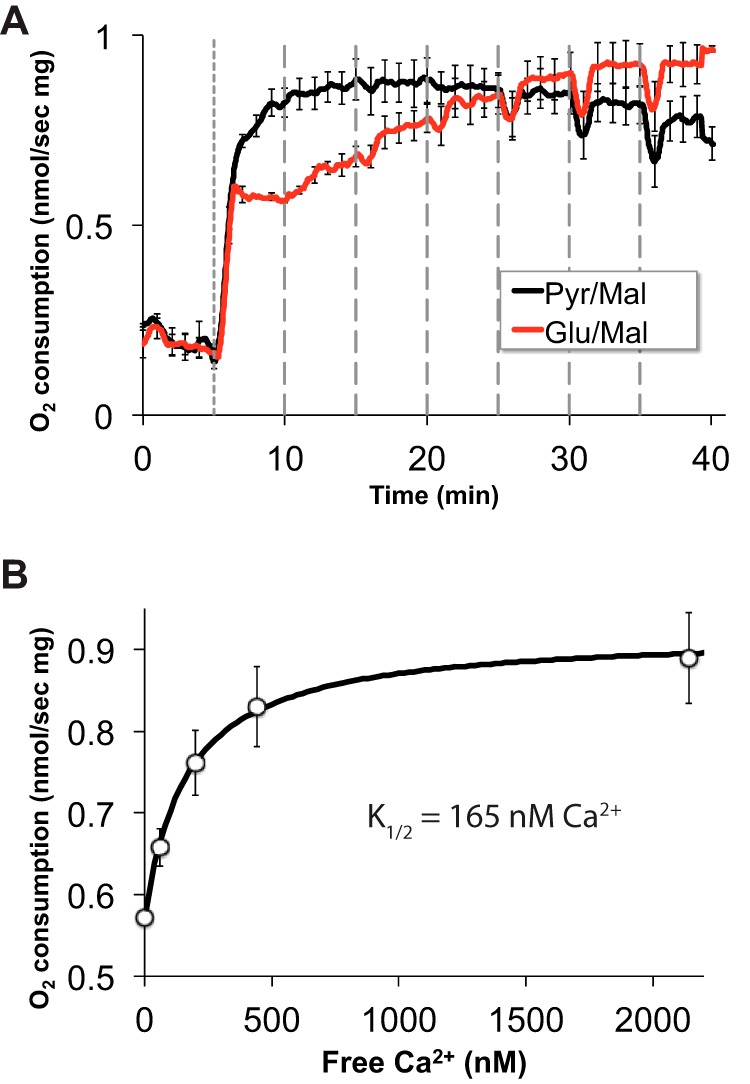
O2 consumption by mitochondria isolated from mouse retinas and titrated with Ca2+. To confirm that Ca2+ can influence AGC1 activity in rodent retinas we isolated mitochondria from rat retinas and measured their O2 consumption over a range of free Ca2+ concentrations using either glutamate and malate (Glu/Mal) or pyruvate and malate (Pyr/Mal) as fuel in a buffer containing EGTA. Oxidation of the Glu/Mal mix depends on AGC activity, whereas oxidation of the Pyr/Mal mix occurs independently of AGC1 (67). A, ADP was added at time 0 on this graph followed at 5 min (short dashed line) by either Pyr/Mal (black) or Glu/Mal (red) and then 20-nmol stepwise additions of CaCl2 (longer dashed lines). B, Ca2+ dependence of O2 consumption rate when Glu/Mal is used as fuel. The K½ was determined from the curve that best fit the data from the experiments shown in panel A. n = 3; error bars show S.E.). Consistent with previous studies of mitochondria from other tissues (68), we found that Ca2+ stimulates O2 consumption. With mouse retina mitochondria we found a K½ of 165 nm only when the Glu/Mal mixture is used as a fuel. This confirms that Ca2+ can stimulate Asp/Glu exchange in the mouse retina. Note that the millimolar concentrations of Pyr/Mal and Glu/Mal in these experiments are so high that any influence of Ca2+ on the Km values of matrix dehydrogenases would not affect respiration.
At higher matrix [Ca2+]f, α-KG can be oxidized even when its concentration in the matrix is low (Fig. 7B). α-KGDH has a low Km under those conditions. At lower [Ca2+]f α-KG in the matrix can be oxidized only when it reaches a sufficiently high concentration.
If these opposing effects of Ca2+ were balanced light would have no net effect on oxidation of α-KG. At higher [Ca2+]f more α-KG would be removed from the matrix, but matrix α-KG would still be oxidized because the Km of α-KGDH is low. At lower [Ca2+]f, the Km of α-KGDH is high, but α-KG still can be oxidized by α-KGDH because it accumulates to a higher concentration in the matrix.
Fig. 5 shows that 13C incorporates into intermediates downstream of α-KG more slowly in light than in darkness. That is consistent with the stimulatory effect of Ca2+ on α-KGDH being more prominent than the inhibitory effect in adult mouse retinas. Our analysis of retinas from younger mice (postnatal day 18) confirmed this. Remarkably, light does not alter flux in intermediates downstream of α-KG (black and white bars in Fig. 7C). The opposing effects of Ca2+ appear to be balanced more equally in the younger retinas.
Unbalancing the Opposing Effects of Ca2+ on α-KG
We tested the hypothesis that opposing effects of Ca2+ are more balanced in younger retinas by analyzing metabolic flux in retinas from young mice that are deficient in AGC1. Rhodopsin, recoverin, and cytochrome oxidase levels are normal in AGC1−/− retinas (6). Incorporation of 13C into glycolytic intermediates and TCA intermediates upstream of α-KGDH was not affected by AGC1 deficiency (red and pink bars in Fig. 7C). However, incorporation of 13C into TCA intermediates after the α-KG branch point increased substantially. This supports the idea that when AGC1 is present it stimulates export of α-KG from the matrix. In the absence of AGC1 more α-KG is retained in the matrix to be oxidized to succinate and downstream intermediates.
Remarkably, AGC1 deficiency uncovers the effect of light on α-KGDH activity in postnatal day 18 retinas (Fig. 7C). When the balancing effect of AGC1 is removed, the stimulatory effect of Ca2+ on α-KGDH is revealed. Fluxes through intermediates downstream of α-KG are greater in darkness than in light only in the absence of AGC1. This effect is sketched out in Fig. 7D. These data support our hypothesis that the two opposing effects of Ca2+ on α-KG metabolism are balanced in younger retinas but not in adult retinas.
Abundance of Metabolites in Darkness and Light
We also analyzed steady-state levels of 171 key metabolites in darkness and light. Targeted metabolites were identified by mass, fragmentation pattern, and co-elution with known standards. Data were obtained for 114 metabolites (supplemental Table 1).
We compared retinas from dark-adapted adult mice to retinas from mice exposed to light. In one comparison, labeled 2 min in Fig. 9A, we harvested retinas in darkness at 9:00 a.m. and compared them to retinas from mice that had been exposed to ∼500 lux white light for 2 min starting at 9:00 a.m. We also compared retinas from mice kept in darkness until 11:00 a.m. to retinas from mice exposed to ∼500 lux from 9:00 a.m. to 11:00 a.m. (2 hour in Fig. 9A). The third condition, labeled 6 hour in Fig. 9A, compared retinas from mice kept in darkness until 3:00 p.m. with retinas from mice exposed to light from 9:00 a.m. to 3:00 p.m.
FIGURE 9.
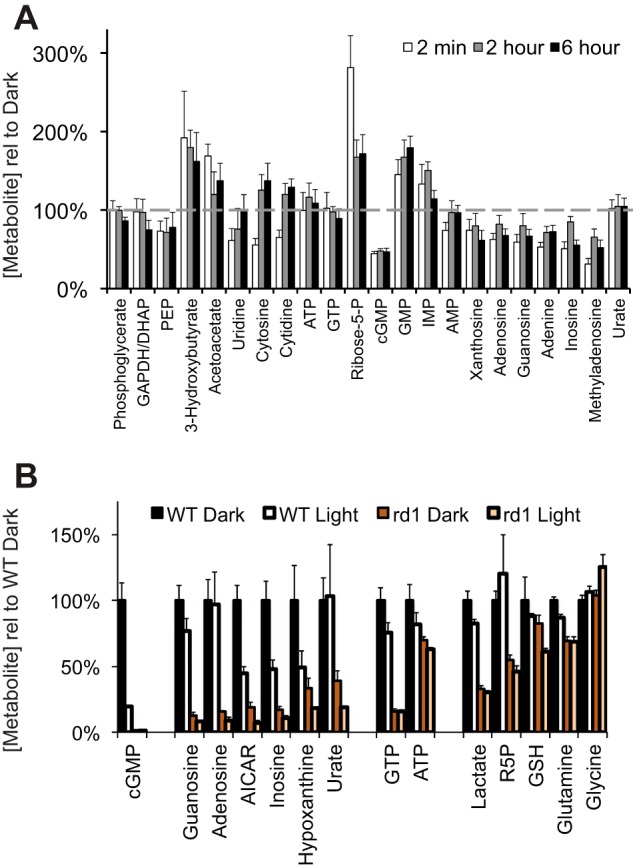
Light affected the steady-state levels of metabolites in mouse retinas. A, The ratio of steady-state levels of metabolites in light versus darkness after 2 min, 2 h, and 6 h of illumination. Mice were dark-adapted overnight then exposed to ambient illumination either for 2 min, 2 h, or 6 h. Control mice were kept in the dark for the same periods. At each time point retinas were harvested, and metabolites were extracted and analyzed by LC-MS. The graph shows the abundance of each metabolite in the light condition divided by the abundance in the corresponding dark condition. n = 4 light and 4 dark for each condition. Error bars are S.E. p values for each light versus dark comparison are listed in the supplemental Table 1). PEP, phosphoenol pyruvate; DHAP, dihydroxyacetone phosphate; AICAR, 5-aminoimidazole-4-carboxamide ribonucleotide. B, evidence that most of the purine nucleotides in mouse retinas are from the photoreceptors. Retinas from adult WT or rd1 mice (ages postnatal days 30 to 38) that were either kept in the dark or exposed to ambient illumination for 5 min were harvested and extracted, and metabolites were quantified by LC-MS (n = 3 for each condition; error bars show S.E.). R5P, ribose-5-phosphate.
Illumination influences key metabolites
After 2 min of illumination, cGMP was depleted by 55%. This is consistent with light-induced cGMP hydrolysis (40). Remarkably, it was accompanied by substantial accumulation of 5′ GMP, the product of the phosphodiesterase reaction (Fig. 9A).
Light causes inosine monophosphate (IMP) to accumulate, but most other purine and pyrimidine metabolites are depleted (Figs. 9A and 10A). Accumulation of 5′-GMP can inhibit IMP dehydrogenase (41), ribose-phosphate diphosphokinase (42), and glutamine-PRPP amidotransferase (43).
FIGURE 10.
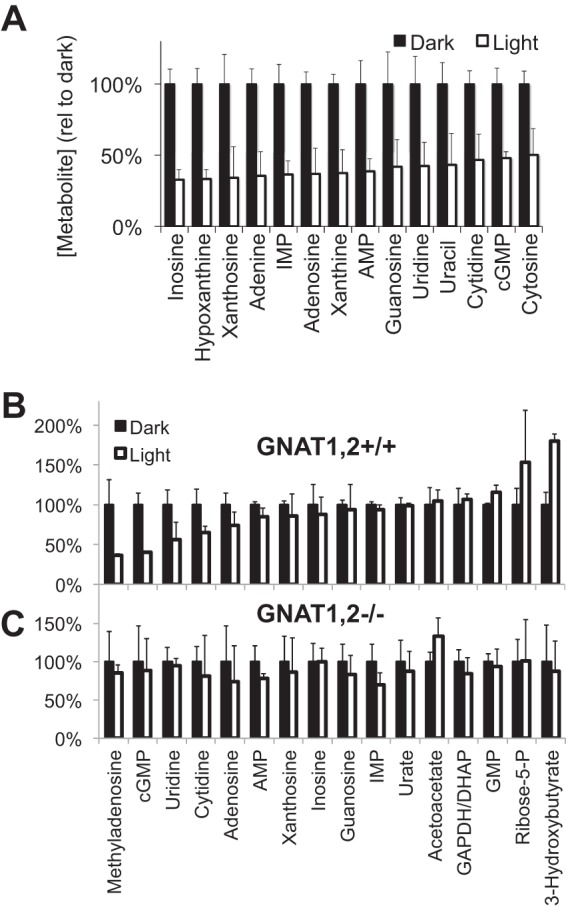
Phototransduction was required for light to affect steady-state levels of metabolites. A, mice were either dark-adapted or light-adapted, and purine and pyrimidine metabolites were quantified by LC-MS. (n = 3). B and C, GNAT1/2+/+ (B) and GNAT1/2−/− (C) mice were dark-adapted overnight then kept either in the dark for 5 min or exposed to ambient light for 5 min. Retinas were harvested, and metabolites were extracted and quantified by LC-MS (n = 2 for GNAT1,2+/+ and n = 4 for GNAT1,2−/−; all error bars show S.D.). The graph shows the relative abundance of each metabolite in the dark or light (normalized to the dark value). The absence of both rod and cone transducins in the GNAT1/2−/− retinas suppresses the effect of light on all metabolites. DHAP, dihydroxyacetone phosphate.
We evaluated the importance of cGMP hydrolysis by measuring the effects of light on metabolites in retinas deficient in phototransduction. Light does not stimulate loss of cGMP in retinas deficient in GNAT1−/− and GNAT2−/− that are deficient in both rod and cone phototransduction (44, 45). We found that light also does not influence purine nucleotide levels in GNAT1−/−;GNAT2−/− retinas (Fig. 10, B and C).
Purine Metabolites Are Enriched in Rod Photoreceptors
The metabolites described in Fig. 9 were extracted from whole retinas, so it was important to localize them. Because purines are affected so strongly by light we asked from which part of the retina they came. We compared metabolites in normal retinas and in adult rd1 retinas in which photoreceptors degenerated. Almost no cGMP remains in rd1 retinas (Fig. 9B). Remarkably, purines, which have the greatest sensitivity to light in normal retinas, are substantially depleted in rd1 retinas. This shows that the light-sensitive purine pool is in photoreceptors.
Other Metabolites
Light also causes accumulation of ketone bodies (3-hydroxybutyrate and acetoacetate) (Fig. 9A). Glycolytic intermediates do not change, except for phosphoenol pyruvate (PEP), which decreased ∼20%. Steady-state levels of other metabolites including lactate, pyruvate, and glutamine are unaffected by light.
Light decreases the Asp/Glu ratio both in vivo (Fig. 11A) and in vitro (Fig. 11B). Retinas use carbons from glutamine to make aspartate. When we incubated dark-adapted retinas with [U-13C]glutamine (“m5 glutamine”) we detected m4 aspartate in the culture medium. Light inhibited this production and release of aspartate (Fig. 11C).
FIGURE 11.
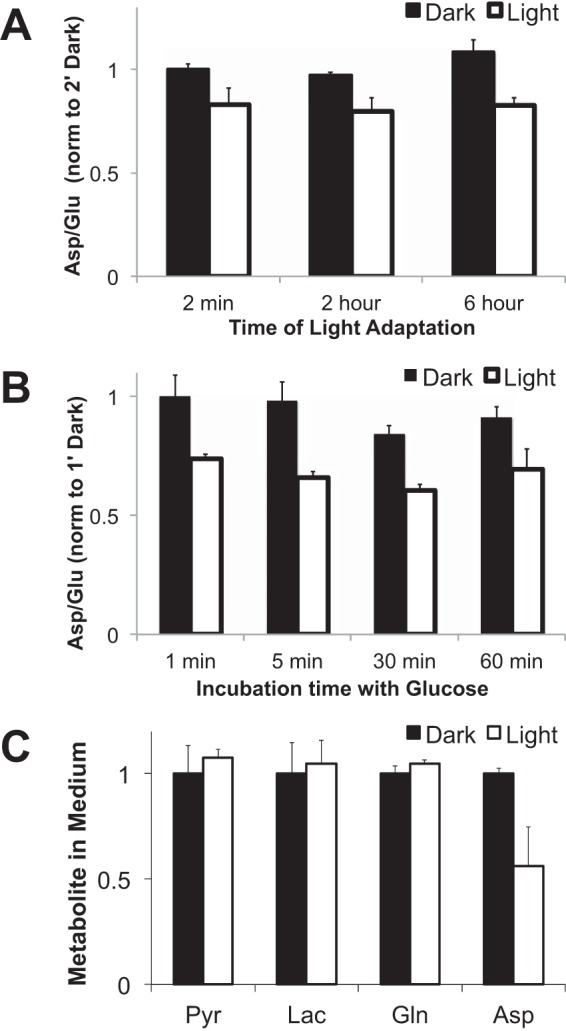
Effect of light on aspartate. A, ratios of Asp/Glu from retinas isolated from mouse eyes. The ratios of Asp and Glu were calculated from the experiment shown in Fig. 9. B, ratios of Asp/Glu from retinas incubated in culture dishes in the dark or light. The ratios of total Asp and Glu were calculated from the results of the experiment shown in Fig. 7. C, more aspartate is released in the dark than in light from retinas (n = 3). Dark-adapted mouse retinas were isolated and cultured either in the dark or in light in media with 5 mm glutamine. After 60 min the media were harvested, and metabolites were quantified by GC-MS (n = 3; error bars show S.D.).
Discussion
Here we report the following new advances in understanding control of energy metabolism in retinas. 1) Respiration operates at nearly maximum capacity in darkness and light. 2) Respiration is uncoupled from ATP synthesis more in retinas than in other tissues. 3) Light influences metabolic flux by altering the activities of mitochondrial dehydrogenases and AGC1. 4) Light influences nucleotide metabolism. 5) Light influences ribose 5-phosphate, ketone bodies, aspartate, and glutamate.
Comparison with Earlier Studies
Previous studies showed that retinas rely on aerobic glycolysis and consume more energy in darkness than in light (11). However, those studies did not address the molecular mechanism by which darkness and light regulate metabolism as we have done here.
The extent of stimulation described previously varied widely and depended on the organism and method used to evaluate it (Table 1). Most studies used depletion of O2 and release of CO2 or lactic acid to evaluate production of energy. Others measured energy consumption more directly. One study quantified ATP turnover and found little difference between darkness and light (46). Another quantified ion currents and predicted ∼4× more ATP consumption in darkness than in light (13). The reasons for the large disparities in Table 1 are unclear, but in general they show that more energy is extracted from fuel in darkness than in light.
TABLE 1.
Summary of findings from previous measurements of the influence of light on retinal energy metabolism
| Species | % Decrease in light | Parameter measured | Reference |
|---|---|---|---|
| Bullfrog | 3% | O2 consumption | (69) |
| Mouse | 8% | O2 consumption | (6) |
| Cat | 16% | O2 consumption | (10) |
| Salamander | 25% | O2 consumption | (70) |
| Macaque | 26% | O2 consumption | (71) |
| Rabbit | 28% | O2 consumption | (5) |
| Rat | 37% | O2 consumption | (72) |
| Rat | 40% | O2 consumption | (73) |
| Cat | 54% | O2 consumption | (74) |
| Bullfrog | 57% | O2 consumption | (75) |
| Cat | 64% | O2 consumption | (76) |
| Frog | 10% | CO2 production | (77) |
| Rat | 26% | CO2 production | (9) |
| Rabbit | −1% | Lactate production | (5) |
| Rat | 6% | Lactate production | (7) |
| Mouse | 17% | Lactate production | (6) |
| Rat | 29% | Lactate production | (9) |
| Cat | 38% | Lactate production | (10) |
| Toad | 0% | ATP consumption | (46) |
| Mouse | 80%* | ATP consumption | (13) |
We found that light inhibits glycolysis to lactate by ∼24% and O2 consumption by ∼9%. It appears to inhibit mitochondrial dehydrogenase activities more substantially. There are inherent uncertainties in the pathways of metabolic flux in the retina because of the heterogeneity of cell types and because some of the intermediates in Fig. 5 are both cytosolic and mitochondrial. Therefore, we cannot present a simple model that explains unambiguously the changes in metabolic flux through each intermediate.
Evidence for Changes in Anabolic Metabolism
Each morning photoreceptors lose ∼10% of their OS to phagocytosis by the retinal pigment epithelium (14, 15), so they require a high rate of anabolic activity to replace the lost material. Light also increases demand for NADPH to reduce and detoxify all-trans-retinal generated by photobleaching of rhodopsin. We identified two light-stimulated changes that may enhance anabolic activity. 1) Light increases flux through citrate (Fig. 5B) while decreasing flux through citric acid cycle intermediates. Previous studies (47, 48) indicated that isocitrate dehydrogenase and malic enzyme can produce NADPH in the photoreceptor cytoplasm. Citrate, made in the matrix, can be transported to the cytoplasm to fuel those enzymes. 2) Light stimulates transient accumulation of ribose 5-phosphate (Fig. 9A). This may reflect a transient increase in the oxidative reactions of the pentose phosphate pathway that produce NADPH and ribose 5-phosphate.
Illumination Influences Nucleotide Metabolism
The following are possible explanations for the effect of light on nucleotides.
RNA Stability
Increased nucleotide levels in darkness could arise from degradation of RNA. This idea is suggested by a study that described dark-stimulated breakdown of microRNA in mouse retinas (49). An argument against this is based on the type of methyladenosine detected in our analysis. N6-Methyladenosine is a methylated purine nucleotide enriched in mRNA and microRNA (50, 51). We did detect a light-induced decrease of methyl adenosine, but comparison with standards showed that it was N1-methyl adenosine. The N6-methyladenosine did not change. Further studies will be needed to determine whether RNA stability contributes to changes in the effect of light on metabolism in retinas.
Regulation of de Novo Synthesis
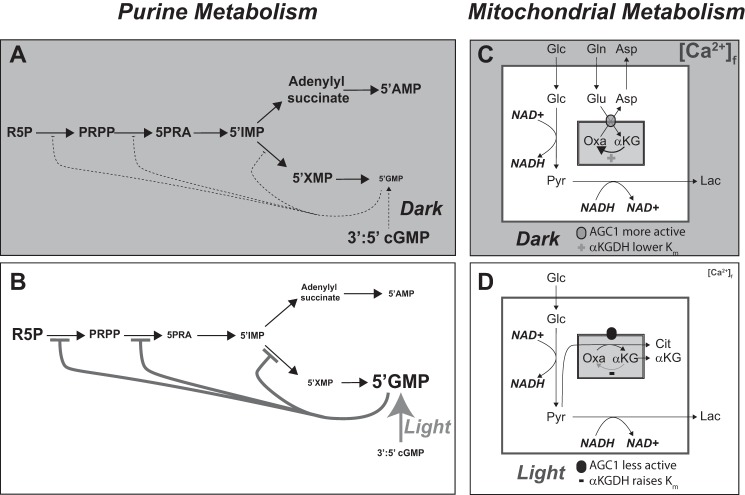
Light stimulates cGMP phosphodiesterase activity in rods and cones. The product of that reaction is 5′-GMP. The 5′-GMP that accumulates during illumination could inhibit de novo purine synthesis by feedback inhibition. 5′-GMP inhibits IMP dehydrogenase, the enzyme that converts 5′-IMP into 5′-XMP (41). Consistent with this, 5′-IMP accumulates during illumination, with concomitant depletion of downstream intermediates in the purine synthesis pathway. Light also could inhibit de novo purine synthesis by decreasing the amount of aspartate in the cell. Recent studies showed that decreases in nucleotide levels correlate with reduced synthesis of aspartate (52–56). These are reasonable mechanisms by which light could regulate de novo purine synthesis. An argument against this idea is that the time course of the light effect is fast. Loss of ∼50% of purines and pyrimidines in 2 min seems surprisingly quick for an effect on de novo synthesis. Nevertheless, an effect of light on de novo synthesis is a reasonable hypothesis to explain the effects of light on nucleotides and nitrogenous bases. It is sketched in Fig. 12, A and B.
FIGURE 12.
Summary of the effects of light on retinal metabolism. A, in darkness 3′:5′ cGMP is not rapidly hydrolyzed to 5′-GMP. Low 5′-GMP activities allow maximal activity of enzymes in the purine synthesis pathway. It also is possible that darkness favors breakdown of mRNA, which would also increase the concentrations of pyrimidines and purines (not shown). B, light stimulates hydrolysis of cGMP to 5′-GMP, which then inhibits multiple steps in purine synthesis to cause accumulation of ribose 5-phosphate (R5P) and depletion of downstream purines. Some of the increase in ribose 5-P may also reflect stimulation of pentose phosphate pathway activity. C, cytosolic [Ca2+]f is greater in the dark than in light. Ca2+ stimulates AGC1 to exchange aspartate out of mitochondria. Ca2+ also enters mitochondria where it lowers the Km of dehydrogenases to stimulate flux through the TCA cycle. D, light lowers [Ca2+]f. Both AGC1 and matrix dehydrogenase activities decrease. Pyr, pyruvate; Cit, citrate; PRPP, phosphoribosyl pyrophosphate; 5PRA, phosphoribosyl amine.
Regulation of the Salvage Pathway
Inhibition of glutamine-PRPP amidostransferase by accumulation of 5′-GMP (57) would block the synthesis of purines via the salvage pathway. Salvage pathway flux may be much faster than de novo flux. The rapid changes we observed appear to favor the idea that inhibition of the salvage pathway contributes to the light effect. An argument against this idea is that an effect only on the salvage pathway would not readily explain decreased levels of free nitrogenous bases.
Control of Metabolism by Signaling
Weak coupling between respiration and ATP synthesis suggests that ATP production is not the only role of mitochondria in retina. Recent studies of metabolism in other types of cells also concluded that anabolic activities of mitochondria can even be more essential than ATP synthesis (53, 55).
Weak coupling means that energy demand drives energy production in retina less directly than in other tissues. Instead of using direct coupling, photoreceptors use signaling to control production of energy. Phototransduction depletes cytosolic Ca2+ in the OS (58, 59), and it hyperpolarizes the cell, which depletes cytosolic Ca2+ at the synapse (60). Mitochondria cluster at the junction between outer and inner segments of photoreceptors (61, 62). This depletion of Ca2+ on both sides of the cluster (63) could have a substantial impact on metabolic activities in these mitochondria (32, 38).
Ca2+ influences mitochondrial activities in neurons (31, 32, 39). Increased cytosolic Ca2+ can stimulate the aspartate/glutamate carrier 1 (AGC1), which transports aspartate from the matrix into the cytosol in exchange for glutamate (33). Ca2+ from the cytoplasm also can enter the matrix via the channel called the mitochondrial Ca2+ uniporter (or MCU) (64). Ca2+ in the matrix lowers the Km of α-KGDH, the enzyme that converts α-KG to succinyl CoA (37). These activities compete for α-KG in the mitochondrial matrix (39). Our studies show that the effect of Ca2+ on the Km of α-KGDH predominates in adult retinas, whereas the effects of Ca2+ on α-KGDH and AGC1 are balanced in younger retinas. The types of metabolic flux in mitochondria in darkness versus light are summarized in Fig. 12, C and D.
An implication of our findings is that illumination can affect the distribution of metabolites between matrix and cytosol. This will qualitatively change the types of metabolic activities that occur in darkness versus in light. Confirmation of this important prediction will require development of cytosol- and matrix-specific metabolite sensors.
Significance for Retinal Disease
The influence of illumination on TCA cycle and nucleotide metabolites is a new observation with important implications for retinal disease. Our findings may help explain the susceptibility of photoreceptors to specific enzyme deficiencies. Isocitrate dehydrogenase 3 and IMP dehydrogenase have central roles in mitochondrial and purine metabolism, but mutations in these widely expressed genes do not cause degeneration outside the retina. However, mutations in isocitrate dehydrogenase 3 (65) and IMP dehydrogenase (66) do cause photoreceptors to degenerate. The preponderance of aerobic glycolysis in retina, the light-sensitive activity of mitochondria, and the light sensitivity of nucleotide metabolism may be key for understanding why retinas are uniquely sensitive to these mutations.
Author Contributions
J. D. conducted most of the experiments, analyzed the results, and helped write the paper. A. R., W. M. G., L. Contreras, K. J. L., H. G., D. D., M. K., and L. Chan also contributed to the experiments. M. S., D. R., J. S., S. H. T., I. S. and J. B. H. designed experiments and interpreted the findings. J. B. H. wrote the paper.
Supplementary Material
Acknowledgments
We thank Rob Linsenmeier and Martin Brand for helpful discussions.
This work was supported, in whole or in part, by National Institutes of Health Grants EY06641 and EY017863 (to J. B. H.) and EY001730 (NEI Center Core). The content is solely the responsibility of the authors and does not necessarily represent the official views of the National Institutes of Health. The authors declare that they have no conflicts of interest with the contents of this article.

This article contains supplemental Table 1.
- OS
- outer segment
- GNAT1 and -2
- guanine nucleotide-binding protein subunit α1 and α2, respectively
- KRB
- Krebs-Ringer/HEPES/bicarbonate
- OCR
- consumption rate
- FCCP
- carbonyl cyanide p-trifluoromethoxyphenylhydrazone
- α-KG
- α-ketoglutarate
- α-KGDH
- α-ketoglutarate dehydrogenase
- AGC1
- aspartate/glutamate carrier 1.
References
- 1. Warburg O., Posener K., and Negelein E. (1924) On the metabolism of carcinoma cells. Biochemische Zeitschrift 152, 309–344 [Google Scholar]
- 2. Krebs H. A. (1927) On the metabolism of the retina. Biochemische Zeitschrift 189, 57–59 [Google Scholar]
- 3. Lunt S. Y., and Vander Heiden M. G. (2011) Aerobic glycolysis: meeting the metabolic requirements of cell proliferation. Annu. Rev. Cell Dev. Biol. 27, 441–464 [DOI] [PubMed] [Google Scholar]
- 4. Mayers J. R., and Vander Heiden M. G. (2015) Famine versus feast: understanding the metabolism of tumors in vivo. Trends Biochem. Sci. 40, 130–140 [DOI] [PMC free article] [PubMed] [Google Scholar]
- 5. Ames A. 3rd, Li Y. Y., Heher E. C., and Kimble C. R. (1992) Energy metabolism of rabbit retina as related to function: high cost of Na+ transport. J. Neurosci. 12, 840–853 [DOI] [PMC free article] [PubMed] [Google Scholar]
- 6. Du J., Cleghorn W., Contreras L., Linton J. D., Chan G. C., Chertov A. O., Saheki T., Govindaraju V., Sadilek M., Satrústegui J., and Hurley J. B. (2013) Cytosolic reducing power preserves glutamate in retina. Proc. Natl. Acad. Sci. U.S.A. 110, 18501–18506 [DOI] [PMC free article] [PubMed] [Google Scholar]
- 7. Winkler B. S. (1981) Glycolytic and oxidative metabolism in relation to retinal function. J. Gen. Physiol. 77, 667–692 [DOI] [PMC free article] [PubMed] [Google Scholar]
- 8. Winkler B. S., Starnes C. A., Twardy B. S., Brault D., and Taylor R. C. (2008) Nuclear magnetic resonance and biochemical measurements of glucose utilization in the cone-dominant ground squirrel retina. Invest. Ophthalmol. Vis. Sci. 49, 4613–4619 [DOI] [PubMed] [Google Scholar]
- 9. Xu Y., Ola M. S., Berkich D. A., Gardner T. W., Barber A. J., Palmieri F., Hutson S. M., and LaNoue K. F. (2007) Energy sources for glutamate neurotransmission in the retina: absence of the aspartate/glutamate carrier produces reliance on glycolysis in glia. J. Neurochem. 101, 120–131 [DOI] [PubMed] [Google Scholar]
- 10. Wang L., Törnquist P., and Bill A. (1997) Glucose metabolism of the inner retina in pigs in darkness and light. Acta Physiol. Scand. 160, 71–74 [DOI] [PubMed] [Google Scholar]
- 11. Hurley J. B., Chertov A. O., Lindsay K., Giamarco M., Cleghorn W., Du J., and Brockerhoff S. (2014) Energy metabolism in the vertebrate retina in Vertebrate Photoreceptor Functional Molecular Bases (Furakawa T., Hurley J.B., and Kawamura S., eds.) pp. 91–138, Springer-Verlag New York Inc., New York [Google Scholar]
- 12. Hurley J. B., Lindsay K. J., and Du J. (2015) Glucose, lactate, and shuttling of metabolites in vertebrate retinas. J. Neurosci. Res. 93, 1079–1092 [DOI] [PMC free article] [PubMed] [Google Scholar]
- 13. Okawa H., Sampath A. P., Laughlin S. B., and Fain G. L. (2008) ATP consumption by mammalian rod photoreceptors in darkness and in light. Curr. Biol. 18, 1917–1921 [DOI] [PMC free article] [PubMed] [Google Scholar]
- 14. LaVail M. M. (1976) Rod outer segment disk shedding in rat retina: relationship to cyclic lighting. Science 194, 1071–1074 [DOI] [PubMed] [Google Scholar]
- 15. Young R. W. (1971) The renewal of rod and cone outer segments in the rhesus monkey. J. Cell Biol. 49, 303–318 [DOI] [PMC free article] [PubMed] [Google Scholar]
- 16. Chandel N. S. (2015) Navigating Metabolism, pp. 49–50, Cold Spring Harbor Laboratory Press, Cold Spring Harbor, New York [Google Scholar]
- 17. Jalil M. A., Begum L., Contreras L., Pardo B., Iijima M., Li M. X., Ramos M., Marmol P., Horiuchi M., Shimotsu K., Nakagawa S., Okubo A., Sameshima M., Isashiki Y., Del Arco A., Kobayashi K., Satrústegui J., and Saheki T. (2005) Reduced N-acetylaspartate levels in mice lacking aralar, a brain- and muscle-type mitochondrial aspartate-glutamate carrier. J. Biol. Chem. 280, 31333–31339 [DOI] [PubMed] [Google Scholar]
- 18. Ramos M., Pardo B., Llorente-Folch I., Saheki T., Del Arco A., and Satrústegui J. (2011) Deficiency of the mitochondrial transporter of aspartate/glutamate aralar/AGC1 causes hypomyelination and neuronal defects unrelated to myelin deficits in mouse brain. J. Neurosci. Res. 89, 2008–2017 [DOI] [PubMed] [Google Scholar]
- 19. Du J., Cleghorn W. M., Contreras L., Lindsay K., Rountree A. M., Chertov A. O., Turner S. J., Sahaboglu A., Linton J., Sadilek M., Satrústegui J., Sweet I. R., Paquet-Durand F., and Hurley J. B. (2013) Inhibition of mitochondrial pyruvate transport by zaprinast causes massive accumulation of aspartate at the expense of glutamate in the retina. J. Biol. Chem. 288, 36129–36140 [DOI] [PMC free article] [PubMed] [Google Scholar]
- 20. Sweet I. R., Cook D. L., Wiseman R. W., Greenbaum C. J., Lernmark A., Matsumoto S., Teague J. C., and Krohn K. A. (2002) Dynamic perifusion to maintain and assess isolated pancreatic islets. Diabetes Technol. Ther. 4, 67–76 [DOI] [PubMed] [Google Scholar]
- 21. Chertov A. O., Holzhausen L., Kuok I. T., Couron D., Parker E., Linton J. D., Sadilek M., Sweet I. R., and Hurley J. B. (2011) Roles of glucose in photoreceptor survival. J. Biol. Chem. 286, 34700–34711 [DOI] [PMC free article] [PubMed] [Google Scholar]
- 22. Du J., Linton J. D., and Hurley J. B. (2015) Probing metabolism in the intact retina using stable isotope tracers. Methods Enzymol. 561, 149–170 [DOI] [PMC free article] [PubMed] [Google Scholar]
- 23. Millard P., Letisse F., Sokol S., and Portais J. C. (2012) IsoCor: correcting MS data in isotope labeling experiments. Bioinformatics 28, 1294–1296 [DOI] [PubMed] [Google Scholar]
- 24. Gu H., Du J., Carnevale Neto F., Carroll P. A., Turner S. J., Chiorean E. G., Eisenman R. N., and Raftery D. (2015) Metabolomics method to comprehensively analyze amino acids in different domains. Analyst 140, 2726–2734 [DOI] [PMC free article] [PubMed] [Google Scholar]
- 25. Carroll P. A., Diolaiti D., McFerrin L., Gu H., Djukovic D., Du J., Cheng P. F., Anderson S., Ulrich M., Hurley J. B., Raftery D., Ayer D. E., and Eisenman R. N. (2015) Deregulated Myc requires MondoA/Mlx for metabolic reprogramming and tumorigenesis. Cancer cell 27, 271–285 [DOI] [PMC free article] [PubMed] [Google Scholar]
- 26. Zhu J., Djukovic D., Deng L., Gu H., Himmati F., Chiorean E. G., and Raftery D. (2014) Colorectal cancer detection using targeted serum metabolic profiling. J. Proteome Res. 13, 4120–4130 [DOI] [PubMed] [Google Scholar]
- 27. Brand M. D., and Nicholls D. G. (2011) Assessing mitochondrial dysfunction in cells. Biochem. J. 435, 297–312 [DOI] [PMC free article] [PubMed] [Google Scholar]
- 28. Murphy M. P., and Brand M. D. (1988) Membrane-potential-dependent changes in the stoichiometry of charge translocation by the mitochondrial electron transport chain. Eur. J. Biochem. 173, 637–644 [DOI] [PubMed] [Google Scholar]
- 29. Calvert P. D., Krasnoperova N. V., Lyubarsky A. L., Isayama T., Nicoló M., Kosaras B., Wong G., Gannon K. S., Margolskee R. F., Sidman R. L., Pugh E. N. Jr., Makino C. L., and Lem J. (2000) Phototransduction in transgenic mice after targeted deletion of the rod transducin α-subunit. Proc. Natl. Acad. Sci. U.S.A. 97, 13913–13918 [DOI] [PMC free article] [PubMed] [Google Scholar]
- 30. Woodruff M. L., Sampath A. P., Matthews H. R., Krasnoperova N. V., Lem J., and Fain G. L. (2002) Measurement of cytoplasmic calcium concentration in the rods of wild-type and transducin knock-out mice. J. Physiol. 542, 843–854 [DOI] [PMC free article] [PubMed] [Google Scholar]
- 31. Llorente-Folch I., Rueda C. B., Amigo I., del Arco A., Saheki T., Pardo B., and Satrústegui J. (2013) Calcium-regulation of mitochondrial respiration maintains ATP homeostasis and requires ARALAR/AGC1-malate aspartate shuttle in intact cortical neurons. J. Neurosci. 33, 13957–13971 [DOI] [PMC free article] [PubMed] [Google Scholar]
- 32. Llorente-Folch I., Rueda C. B., Pardo B., Szabadkai G., Duchen M. R., and Satrustegui J. (2015) The regulation of neuronal mitochondrial metabolism by calcium. J. Physiol. 593, 3447–3462 [DOI] [PMC free article] [PubMed] [Google Scholar]
- 33. Contreras L. (2015) Role of AGC1/aralar in the metabolic synergies between neuron and glia. Neurochem. Int. 88, 38–46 [DOI] [PubMed] [Google Scholar]
- 34. Satrústegui J., Contreras L., Ramos M., Marmol P., del Arco A., Saheki T., and Pardo B. (2007) Role of aralar, the mitochondrial transporter of aspartate-glutamate, in brain N-acetylaspartate formation and Ca2+ signaling in neuronal mitochondria. J. Neurosci. Res. 85, 3359–3366 [DOI] [PubMed] [Google Scholar]
- 35. Lindsay K. J., Du J., Sloat S. R., Contreras L., Linton J. D., Turner S. J., Sadilek M., Satrústegui J., and Hurley J. B. (2014) Pyruvate kinase and aspartate-glutamate carrier distributions reveal key metabolic links between neurons and glia in retina. Proc. Natl. Acad. Sci. U.S.A. 111, 15579–15584 [DOI] [PMC free article] [PubMed] [Google Scholar]
- 36. Murgia M., and Rizzuto R. (2015) Molecular diversity and pleiotropic role of the mitochondrial calcium uniporter. Cell Calcium 58, 11–17 [DOI] [PubMed] [Google Scholar]
- 37. Denton R. M., and McCormack J. G. (1990) Ca2+ as a second messenger within mitochondria of the heart and other tissues. Annu. Rev. Physiol. 52, 451–466 [DOI] [PubMed] [Google Scholar]
- 38. Glancy B., and Balaban R. S. (2012) Role of mitochondrial Ca2+ in the regulation of cellular energetics. Biochemistry 51, 2959–2973 [DOI] [PMC free article] [PubMed] [Google Scholar]
- 39. Contreras L., and Satrústegui J. (2009) Calcium signaling in brain mitochondria: interplay of malate aspartate NADH shuttle and calcium uniporter/mitochondrial dehydrogenase pathways. J. Biol. Chem. 284, 7091–7099 [DOI] [PMC free article] [PubMed] [Google Scholar]
- 40. Yarfitz S., and Hurley J. B. (1994) Transduction mechanisms of vertebrate and invertebrate photoreceptors. J. Biol. Chem. 269, 14329–14332 [PubMed] [Google Scholar]
- 41. Hedstrom L. (2009) IMP dehydrogenase: structure, mechanism, and inhibition. Chem. Rev. 109, 2903–2928 [DOI] [PMC free article] [PubMed] [Google Scholar]
- 42. Becker M. A. (2001) Phosphoribosylpyrophosphate synthetase and the regulation of phosphoribosylpyrophosphate production in human cells. Prog. Nucleic Acid Res. Mol. Biol. 69, 115–148 [DOI] [PubMed] [Google Scholar]
- 43. Watts R. W. (1983) Some regulatory and integrative aspects of purine nucleotide biosynthesis and its control: an overview. Adv. Enzyme Regul. 21, 33–51 [DOI] [PubMed] [Google Scholar]
- 44. Chang B., Dacey M. S., Hawes N. L., Hitchcock P. F., Milam A. H., Atmaca-Sonmez P., Nusinowitz S., and Heckenlively J. R. (2006) Cone photoreceptor function loss-3, a novel mouse model of achromatopsia due to a mutation in Gnat2. Invest. Ophthalmol. Vis. Sci. 47, 5017–5021 [DOI] [PubMed] [Google Scholar]
- 45. Nathan J., Reh R., Ankoudinova I., Ankoudinova G., Chang B., Heckenlively J., and Hurley J. B. (2006) Scotopic and photopic visual thresholds and spatial and temporal discrimination evaluated by behavior of mice in a water maze. Photochem. Photobiol. 82, 1489–1494 [DOI] [PubMed] [Google Scholar]
- 46. Dawis S. M., Walseth T. F., Deeg M. A., Heyman R. A., Graeff R. M., and Goldberg N. D. (1989) Adenosine triphosphate utilization rates and metabolic pool sizes in intact cells measured by transfer of 18O from water. Biophys. J. 55, 79–99 [DOI] [PMC free article] [PubMed] [Google Scholar]
- 47. Adler L. 4th, Chen C., and Koutalos Y. (2014) Mitochondria contribute to NADPH generation in mouse rod photoreceptors. J. Biol. Chem. 289, 1519–1528 [DOI] [PMC free article] [PubMed] [Google Scholar]
- 48. Winkler B. S., DeSantis N., and Solomon F. (1986) Multiple NADPH-producing pathways control glutathione (GSH) content in retina. Exp. Eye Res. 43, 829–847 [DOI] [PubMed] [Google Scholar]
- 49. Krol J., Busskamp V., Markiewicz I., Stadler M. B., Ribi S., Richter J., Duebel J., Bicker S., Fehling H. J., Schübeler D., Oertner T. G., Schratt G., Bibel M., Roska B., and Filipowicz W. (2010) Characterizing light-regulated retinal microRNAs reveals rapid turnover as a common property of neuronal microRNAs. Cell 141, 618–631 [DOI] [PubMed] [Google Scholar]
- 50. Lee M., Kim B., and Kim V. N. (2014) Emerging roles of RNA modification: m(6)A and U-tail. Cell 158, 980–987 [DOI] [PubMed] [Google Scholar]
- 51. Alarcón C. R., Lee H., Goodarzi H., Halberg N., and Tavazoie S. F. (2015) N6-Methyladenosine marks primary microRNAs for processing. Nature 519, 482–485 [DOI] [PMC free article] [PubMed] [Google Scholar]
- 52. Ahn C. S., and Metallo C. M. (2015) Mitochondria as biosynthetic factories for cancer proliferation. Cancer Metab. 3, 1. [DOI] [PMC free article] [PubMed] [Google Scholar]
- 53. Birsoy K., Wang T., Chen W. W., Freinkman E., Abu-Remaileh M., and Sabatini D. M. (2015) An essential role of the mitochondrial electron transport chain in cell proliferation is to enable aspartate synthesis. Cell 162, 540–551 [DOI] [PMC free article] [PubMed] [Google Scholar]
- 54. Schoors S., Bruning U., Missiaen R., Queiroz K. C., Borgers G., Elia I., Zecchin A., Cantelmo A. R., Christen S., Goveia J., Heggermont W., Goddé L., Vinckier S., Van Veldhoven P. P., Eelen G., Schoonjans L., Gerhardt H., Dewerchin M., Baes M., De Bock K., Ghesquière B., Lunt S. Y., Fendt S. M., and Carmeliet P. (2015) Fatty acid carbon is essential for dNTP synthesis in endothelial cells. Nature 520, 192–197 [DOI] [PMC free article] [PubMed] [Google Scholar]
- 55. Sullivan L. B., Gui D. Y., Hosios A. M., Bush L. N., Freinkman E., and Vander Heiden M. G. (2015) Supporting aspartate biosynthesis is an essential function of respiration in proliferating cells. Cell 162, 552–563 [DOI] [PMC free article] [PubMed] [Google Scholar]
- 56. Zhang J., Fan J., Venneti S., Cross J. R., Takagi T., Bhinder B., Djaballah H., Kanai M., Cheng E. H., Judkins A. R., Pawel B., Baggs J., Cherry S., Rabinowitz J. D., and Thompson C. B. (2014) Asparagine plays a critical role in regulating cellular adaptation to glutamine depletion. Mol. Cell 56, 205–218 [DOI] [PMC free article] [PubMed] [Google Scholar]
- 57. Zhao H., French J. B., Fang Y., and Benkovic S. J. (2013) The purinosome, a multi-protein complex involved in the de novo biosynthesis of purines in humans. Chem. Comm. 49, 4444–4452 [DOI] [PMC free article] [PubMed] [Google Scholar]
- 58. Arshavsky V. Y., and Burns M. E. (2012) Photoreceptor signaling: supporting vision across a wide range of light intensities. J. Biol. Chem. 287, 1620–1626 [DOI] [PMC free article] [PubMed] [Google Scholar]
- 59. Fain G. L., and Matthews H. R. (1990) Calcium and the mechanism of light adaptation in vertebrate photoreceptors. Trends Neurosci. 13, 378–384 [DOI] [PubMed] [Google Scholar]
- 60. Barnes S., and Kelly M. E. (2002) Calcium channels at the photoreceptor synapse. Adv. Exp. Med. Biol. 514, 465–476 [DOI] [PubMed] [Google Scholar]
- 61. Linton J. D., Holzhausen L. C., Babai N., Song H., Miyagishima K. J., Stearns G. W., Lindsay K., Wei J., Chertov A. O., Peters T. A., Caffe R., Pluk H., Seeliger M. W., Tanimoto N., Fong K., Bolton L., Kuok D. L., Sweet I. R., Bartoletti T. M., Radu R. A., Travis G. H., Zagotta W. N., Townes-Anderson E., Parker E., Van der Zee C. E., Sampath A. P., Sokolov M., Thoreson W. B., and Hurley J. B. (2010) Flow of energy in the outer retina in darkness and in light. Proc. Natl. Acad. Sci. U.S.A. 107, 8599–8604 [DOI] [PMC free article] [PubMed] [Google Scholar]
- 62. Tarboush R., Chapman G. B., and Connaughton V. P. (2012) Ultrastructure of the distal retina of the adult zebrafish, Danio rerio. Tissue Cell 44, 264–279 [DOI] [PubMed] [Google Scholar]
- 63. Krizaj D., and Copenhagen D. R. (2002) Calcium regulation in photoreceptors. Front. Biosci. 7, d2023–d2044 [DOI] [PMC free article] [PubMed] [Google Scholar]
- 64. Finkel T., Menazza S., Holmström K. M., Parks R. J., Liu J., Sun J., Liu J., Pan X., and Murphy E. (2015) The Ins and Outs of Mitochondrial Calcium. Circ. Res. 116, 1810–1819 [DOI] [PMC free article] [PubMed] [Google Scholar]
- 65. Hartong D. T., Dange M., McGee T. L., Berson E. L., Dryja T. P., and Colman R. F. (2008) Insights from retinitis pigmentosa into the roles of isocitrate dehydrogenases in the Krebs cycle. Nat. Genet. 40, 1230–1234 [DOI] [PMC free article] [PubMed] [Google Scholar]
- 66. Daiger S. P., Sullivan L. S., Bowne S. J., Kennan A., Humphries P., Birch D. G., Heckenlively J. R., and RP1 Consortium (2003) Identification of the RP1 and RP10 (IMPDH1) genes causing autosomal dominant RP. Adv. Exp. Med. Biol. 533, 1–11 [DOI] [PMC free article] [PubMed] [Google Scholar]
- 67. Gellerich F. N., Gizatullina Z., Trumbeckaite S., Nguyen H. P., Pallas T., Arandarcikaite O., Vielhaber S., Seppet E., and Striggow F. (2010) The regulation of OXPHOS by extramitochondrial calcium. Biochim. Biophys. Acta 1797, 1018–1027 [DOI] [PubMed] [Google Scholar]
- 68. Gellerich F. N., Gizatullina Z., Arandarcikaite O., Jerzembek D., Vielhaber S., Seppet E., and Striggow F. (2009) Extramitochondrial Ca2+ in the nanomolar range regulates glutamate-dependent oxidative phosphorylation on demand. PloS ONE 4, e8181. [DOI] [PMC free article] [PubMed] [Google Scholar]
- 69. Kimble E. A., Svoboda R. A., and Ostroy S. E. (1980) Oxygen consumption and ATP changes of the vertebrate photoreceptor. Exp. Eye Res. 31, 271–288 [DOI] [PubMed] [Google Scholar]
- 70. Poitry S., Tsacopoulos M., Fein A., and Cornwall M. C. (1996) Kinetics of oxygen consumption and light-induced changes of nucleotides in solitary rod photoreceptors. J. Gen. Physiol. 108, 75–87 [DOI] [PMC free article] [PubMed] [Google Scholar]
- 71. Ahmed J., Braun R. D., Dunn R. Jr., and Linsenmeier R. A. (1993) Oxygen distribution in the macaque retina. Invest. Ophthalmol. Vis. Sci. 34, 516–521 [PubMed] [Google Scholar]
- 72. Medrano C. J., and Fox D. A. (1995) Oxygen consumption in the rat outer and inner retina: light and pharmacologically induced inhibition. Exp. Eye Res. 61, 273–284 [DOI] [PubMed] [Google Scholar]
- 73. Lau J. C., and Linsenmeier R. A. (2012) Oxygen consumption and distribution in the Long-Evans rat retina. Exp. Eye Res. 102, 50–58 [DOI] [PMC free article] [PubMed] [Google Scholar]
- 74. Linsenmeier R. A. (1986) Effects of light and darkness on oxygen distribution and consumption in the cat retina. J. Gen. Physiol. 88, 521–542 [DOI] [PMC free article] [PubMed] [Google Scholar]
- 75. Zuckerman R., and Weiter J. J. (1980) Oxygen transport in the bullfrog retina. Exp. Eye Res. 30, 117–127 [DOI] [PubMed] [Google Scholar]
- 76. Braun R. D., Linsenmeier R. A., and Goldstick T. K. (1995) Oxygen consumption in the inner and outer retina of the cat. Invest. Ophthalmol. Vis. Sci. 36, 542–554 [PubMed] [Google Scholar]
- 77. Sickel W. (1972) Electrical and metabolic manifestations of receptor and higher-order neuron activity in vertebrate retina. Adv. Exp. Med. Biol. 24, 101–118 [DOI] [PubMed] [Google Scholar]
Associated Data
This section collects any data citations, data availability statements, or supplementary materials included in this article.


