

Abstract
Multiple myeloma (MM) is a plasma cell malignancy without effective therapeutics. Thromboxane A2 (TxA2)/TxA2 receptor (T prostanoid receptor (TP)) modulates the progression of some carcinomas; however, its effects on MM cell proliferation remain unclear. In this study, we evaluated cyclooxygenase (COX) enzymes and downstream prostaglandin profiles in human myeloma cell lines RPMI-8226 and U-266 and analyzed the effects of COX-1/-2 inhibitors SC-560 and NS-398 on MM cell proliferation. Our observations implicate COX-2 as being involved in modulating cell proliferation. We further incubated MM cells with prostaglandin receptor antagonists or agonists and found that only the TP antagonist, SQ29548, suppressed MM cell proliferation. TP silencing and the TP agonist, U46619, further confirmed this finding. Moreover, SQ29548 and TP silencing promoted MM cell G2/M phase delay accompanied by reducing cyclin B1/cyclin-dependent kinase-1 (CDK1) mRNA and protein expression. Notably, cyclin B1 overexpression rescued MM cells from G2/M arrest. We also found that the TP agonist activated JNK and p38 MAPK phosphorylation, and inhibitors of JNK and p38 MAPK depressed U46619-induced proliferation and cyclin B1/CDK1 protein expression. In addition, SQ29548 and TP silencing led to the MM cell apoptotic rate increasing with improving caspase 3 activity. The knockdown of caspase 3 reversed the apoptotic rate. Taken together, our results suggest that TxA2/TP promotes MM cell proliferation by reducing cell delay at G2/M phase via elevating p38 MAPK/JNK-mediated cyclin B1/CDK1 expression and hindering cell apoptosis. The TP inhibitor has potential as a novel agent to target kinase cascades for MM therapy.
Keywords: apoptosis, cell cycle, cyclin, cyclin-dependent kinase (CDK), mitogen-activated protein kinase (MAPK), multiple myeloma, proliferation, prostaglandin, G2/M progression delay, TxA2/TP
Introduction
Multiple myeloma (MM)3 is a B-cell malignancy characterized by the clonal proliferation of neoplastic plasma cells in the bone marrow (BM). It accounts for 12% of all malignant hematological neoplasms and is the second most frequent hematological malignancy (1). Recently, despite the improved therapeutic effect of newly approved chemotherapeutics, including thalidomide, lenalidomide, and bortezomib, and stem cell transplantation, MM remains incurable, with only a marginal increase in the 5-year relative survival rate and a high incidence of relapse (2, 3). Thus, identification of novel therapeutic targets for MM is urgently needed.
Growing evidence demonstrates that thromboxane A2 (TxA2)-related molecules are actively involved in tumor progression (4, 5). TxA2 is one of the five primary prostaglandins (PGs) generated from arachidonic acid (AA) through the cyclooxygenases (COX-1 and COX-2) and TxA2 synthase pathways and exerts its biological activities through the TxA2 receptor (T prostanoid receptor (TP)) located on the cell surface. TP belongs to the G-protein-coupled receptor superfamily and is expressed as two isoforms in humans, named TPα and TPβ (6). Notably, TxA2 stimulates proliferation of several types of cells, including oligodendrocytes (7), smooth muscle cells (8), and lung cancer cells (9). For example, dual TxA2 inhibitors repress NCI-H23 lung adenocarcinoma cell growth by inducing G2/M phase arrest and cell apoptosis although the detailed mechanisms are not shown (10). Consistent with their role in cancer progression, TxA2 synthase and TP overexpression has been found in many tumor tissues (11), and their activations stimulate lung cancer cell proliferation via regulating apoptosis or cell cycle progression, whereas the involved signalings are unclear (9). A recent study by Ding et al. (12) reveals that COX-1 and COX-2 inhibitors efficiently suppress ARH-77 MM cell proliferation, but the authors do not elucidate the mechanism by which this occurs. Thus, the direct involvement of COX/TxA2/TP in RPMI-8226 and U-266 MM cell proliferation and the associated signaling pathways have not yet been explored.
The mitogen-activated protein kinase (MAPK) family contains c-Jun N-terminal kinase (JNK), p38 MAPK, and extracellular signal-regulated kinase (ERK). Extensive work has demonstrated critical roles for these pathways in the regulation of various cellular processes, including migration, proliferation, differentiation, development, apoptosis, and cell cycle arrest (13). Furthermore, MAPK signaling is involved in MM pathogenesis. Baek et al. (14) have reported that cinobufagin exhibits potent anticancer effects in MM, possibly through the reactive oxygen species-mediated activation of ERK, JNK, and p38 MAPK and subsequent activation of caspase 3 in U-266 cells. Moreover, TxA2/TP activation has been shown to participate in some physiological processes by activating JNK, p38 MAPK, and ERK1/2 (15–17). However, any association between COX/TxA2/TP and MAPK signaling in MM cell proliferation is still elusive.
In this study, we found that COX-2 inhibitor blocked proliferation of RPMI-8226 and U-266 MM cell lines, and the screening of PG receptors showed that the TP antagonist inhibited cell proliferation. TP silencing also impaired proliferation. These effects of COX/TxA2/TP were associated with G2/M cell cycle arrest and cellular apoptosis induction; therefore, we detected the caspase 3 function and the role of TP-mediated MAPK pathway activation in cyclin B1 and cyclin-dependent kinase-1 (CDK1) expression to further clarify the underlying mechanisms of TP suppression resulting in cellular apoptosis and G2/M cell cycle arrest.
Experimental Procedures
Cell Cultures and Drug Preparations
Human MM cell lines RPMI-8226 and U-266 (gifts from Dr. Jian Hou, Second Military Medical University) and human umbilical vein endothelial cells (Cell Resource Center of Shanghai Institutes for Biological Sciences, Chinese Academy of Sciences) were cultured in RPMI 1640 medium (Invitrogen) supplemented with 10% fetal bovine serum (FBS; HyClone), streptomycin (100 mg/ml; Sigma), and penicillin (100 units/ml; Sigma) and maintained at 37 °C under a humidified atmosphere containing 5% CO2. The cells were seeded into 6- or 96-well plates, stimulated by various drugs for different desired time periods, and then collected for further experimental characterization. The drugs used to stimulate cells were as follows: COX-1 inhibitor, SC-560; COX-2 inhibitor, NS-398; D prostanoid receptor 2 (DP2) antagonist, CAY10471; E prostanoid receptor 2 (EP2) antagonist, AH-6809; EP4 antagonist, L-161,982; TP antagonist, SQ29548; DP1 agonist, BW245C; EP3 agonist, misoprostol; F prostanoid receptor (FP) agonist, latanoprost; I prostanoid receptor (IP) agonist, cicaprost; TP agonist, U46619; ERK inhibitor, PD98059; p38 MAPK inhibitor, SB203580; JNK inhibitor, SP600125; Calpain inhibitor I (LLnL, Sigma); and AA (Cayman).
Isolation of Bone Marrow Mononuclear Cells (BMMCs)
Primary normal BMMCs were isolated from BM samples of people without MM by isodensity centrifugation. Written informed consent was obtained from all subjects prior to their participation in this study. Approval for these studies was obtained from the ethics committee of Shanghai Xuhui District Central Hospital. BM samples were mixed with an equal volume of sterile PBS and gently applied to the surface of 10 ml of Ficoll separation liquid in 50-ml centrifuge tubes, keeping a clear interface. The mixtures were centrifuged at 400 × g at 20 °C for 15 min and divided into four parts (top to bottom): plasma layer, milky mononuclear cell layer, separated medium, and erythrocytes. The second layer was collected and added to a 50-ml centrifuge tube with 3–4 volumes of 1× PBS or cell culture medium. The mixtures were centrifuged at 500 × g at 20 °C for 20 min, and the obtained cell pellets were washed and centrifuged three times.
Cell Proliferation Assay
Cells were seeded into 96-well plates at the same density and cultured with the various drugs indicated at increasing concentrations for 24, 48, 72, and 96 h. At the end of each culture, the medium was removed and replaced with 100 μl of fresh medium and 10 μl of Cell Counting Kit-8 (CCK-8) assay kit reagent (Dojindo). Plates were incubated at 37 °C for 1.5 h, and then absorbance was measured at 450 nm using a SpectraMax 190 microplate reader (Molecular Devices). The reference wavelength was 600 nm. Background absorbance (from wells without cells) was subtracted from all values.
Cell Cycle Analysis by Flow Cytometry
Cell cycle was detected using the cell cycle assay kit (Rainbio). RPMI-8226 and U-266 cells were seeded into 6-well plates and treated with SQ29548 at the indicated concentration (0, 0.1, 5, and 20 μm) for 24 h. The cells were harvested and washed three times with ice-cold PBS. After centrifugation at 800 × g for 5 min and resuspension in 400 μl of propidium iodide (PI) dye, 200 μl of 0.02% Triton X-100, and 20 μl of RNase A, the cells were incubated for 30 min at room temperature in the dark. PI fluorescence was detected using a BD FACSAria flow cytometry system (BD Biosciences) and analyzed with FlowJo version 7.6.1 software (Tree Star). Each assay included at least 10,000 gated events.
Cell Apoptosis Detection
Apoptosis was assessed with an annexin V-FITC/PI apoptosis detection kit (Dojindo) using BD FACSAria flow cytometry. Briefly, RPMI-8226 and U-266 cells were seeded into 12-well plates and incubated with SC-560, NS-398, U46619, and SQ29548 or transfected with TP small interfering RNA (siRNA) for 24 h. Then the cells were harvested and washed once in PBS and once in 1× binding buffer. After resuspension in 1× binding buffer, we added 5 μl of annexin V to 100 μl of cell suspension, incubated for 15 min at room temperature, washed, and resuspended the cells in 1× binding buffer. After the addition of 5 μl of PI dye, cells were analyzed by BD FACSAria flow cytometry. In addition, caspase 3 activity was assayed using a caspase 3 activity assay kit (Beyotime) according to the manufacturer's instructions.
Mitochondria Membrane Potential Analysis
Mitochondria membrane potential (MMP) was detected using the JC-1 mitochondrial membrane potential assay kit (Yeasen). Cells were collected and resuspended with 0.5 ml of medium, incubated with 0.5 ml of JC-1 dye for 20 min, and then detected using BD FACSAria flow cytometry. Intact mitochondrial membrane allows for JC-1 accumulation in the mitochondria, which will emit red fluorescent light when a critical concentration is reached. Conversely, the loss of MMP prevents this accumulation, and JC-1 will remain as a monomer in the cytosol and emit green fluorescence (18).
RNA Interference and Overexpression
Cells were transiently transfected with 100 pmol COX-1, COX-2, TP receptor, caspase 3, or scrambled siRNA per well in 6-well plates, 40 pmol/well in 12-well plates, or 5 pmol/well in 96-well plates using Lipofectamine 2000 reagent (Invitrogen) according to the manufacturer's instructions. Three pairs of siRNA-specific sequences for COX-1, COX-2, TP, or caspase 3 mRNA were designed by Shanghai GenePharma Co., Ltd. The most effective sequences are shown in Table 1. In addition, cells were seeded into 6-well plates and transfected with 4 μg of cyclin B1-GFP plasmid (Addgene) or vector per well using Lipofectamine 2000 reagent (Invitrogen). All analyses were performed 24 h post-transfection.
TABLE 1.
Primers used in real-time quantitative PCR
| Gene name | Forward primer sequence (5′–3′) | Reverse primer sequence (5′–3′) |
|---|---|---|
| hGAPDH | CATGAGAAGTATGACAACAGCCT | AGTCCTTCCACGATACCAAAGT |
| hCOX-1 | TACTCACAGTGCGCTCCAAC | GCAACTGCTTCTTCCCTTTG |
| hCOX-2 | GCTCAGCCATACAGCAAATCC | CCAAAATCCCCTTGAAGTGGG |
| hDP1 | CTGGGCAAGTGCCTCCTAAG | CAACGAGTTGTCCAATGCGG |
| hDP2 | CCTCTGTGCCCAGAGCCCCACGATG | CACGGCCAAGAAGTAGGTGAAGAAG |
| hEP1 | AGCTTGTCGGTATCATGGTG | AAGAGGCGAAGCAGTTGGC |
| hEP2 | CGATGCTCATGCTCTTCGC | GGGAGACTGCATAGATGACAGG |
| hEP3 | CGCCTCAACCACTCCTACAC | GACACCGATCCGCAATCCTC |
| hEP4 | CCGGCGGTGATGTTCATCTT | CCCACATACCAGCGTGTAGAA |
| hFP | AAGTCCAAGGCATCGTTTCTG | TGACTCCAATACACCGCTCAAT |
| hIP | TTCCGCTTCTACGCCTTCAAC | ACCCAGAGCTTGAGTCGCT |
| hTP | ACGGAGAAGGAGCTGCTCATCT | CCAGCCCCTGAATCCTCA |
| hCDK1 | TGGGAAGTTGGTAGCTCTGAA | AATAAGGCGAAGATCAACATGGC |
| hCyclinB1 | TGGGAAGTTGGTAGCTCTGAA | CCAGGGTGCTTGTCCATGTA |
| hCaspase 3 siRNA | CACAGCACCUGGUUAUUAUTT | AUAAUAACCAGGUGCUGUGTT |
| hCOX-1 siRNA | CGUGAGCUAUUACACUCGUTT | ACGAGUGUAAUAGCUCACGTT |
| hCOX-2 siRNA | GCUCCGGACUAGAUGAUAUTT | AUAUCAUCUAGUCCGGAGCTT |
| hTP siRNA | GGCCCACAAACAUUACCCUTT | AGGGUAAUGUUUGUGGGCCTT |
RNA Extraction and Quantitative RT-PCR (qRT-PCR)
Total RNA was isolated from RPMI-8226 and U-266 cells using TRIzol reagent (Invitrogen) according to the manufacturer's instructions and treated with DNase I (Promega). RNA concentration and purity were assessed using the NanoDrop 2000 (Thermo). RNA (2.0 μg) was reverse-transcribed with reverse transcription reagent kits (Takara) and oligo(dT)18 primers (Takara) as recommended. qRT-PCR was performed using a CFX96TM real-time system (Bio-Rad) and iQTM SYBR Green Supermix (Bio-Rad) as described by the manufacturer. Raw data were normalized to the internal control, GAPDH, and presented as relative expression levels calculated by the 2ΔΔCt method. All primers for detected genes are described in Table 1.
Western Blotting
Proteins from total cell lysates were separated by 10% SDS-PAGE and transferred electrophoretically onto Immobilon-P polyvinylidene difluoride (PVDF) membranes (Millipore). The membranes were probed with rabbit anti-COX-1 polyclonal antibody (1:1000; Cayman, catalogue no. 160109), rabbit anti-COX-2 polyclonal antibody (1:200; Cayman, catalogue no. 160107), rabbit anti-cyclin B1 monoclonal antibody (1:1000; Cell Signaling Technology, catalogue no. D5C10), rabbit anti-CDK1 monoclonal antibody (1:1000; Abcam, catalogue no. E161), rabbit anti-p38 MAPK monoclonal antibody (1:1000; Cell Signaling Technology, catalogue no. 9212S), rabbit anti-phospho-p38 MAPK (Thr-180/Tyr-182) monoclonal antibody (1:1000; Cell Signaling Technology, catalogue no. 9211S), rabbit anti-SAPK/JNK monoclonal antibody (1:1000; Cell Signaling Technology, catalogue no. 9258P), rabbit anti-phospho-SAPK/JNK monoclonal antibody (1:1000; Cell Signaling Technology, catalogue no. 4668P), rabbit anti-pro-caspase 3 polyclonal antibody (1:1000; Cell Signaling Technology, catalogue no. 9665S), rabbit anti-cleaved caspase 3 polyclonal antibody (1:1000; Signalway Antibody, catalogue no. 29034), or mouse anti-actin monoclonal antibody (1:5000; Sigma-Aldrich, catalogue no. A5441) followed by either anti-rabbit or anti-mouse IgG secondary antibodies conjugated to horseradish peroxidase (1:4000; Protein Tech Group, Inc.) and detection with the ECL system (Pierce). The relative protein density was quantified by ImageJ version 1.44 (National Institutes of Health).
PG Extraction and Analysis
Myeloma cells were stimulated by 30 μm SC-560 and NS-398 for 24 h, after which the medium was changed to the FBS-fresh medium containing 30 μm AA for 15 min. The medium was collected for PG production analysis utilizing liquid chromatography/mass spectrometry/mass spectrometry (LC/MS/MS; Agilent) and normalized to total protein. The detailed steps were routinely performed in our laboratory (19).
Statistical Analysis
The data are expressed as mean ± S.E. Time course, cyclin B1 degradation, cyclin B1 rescue, and caspase 3 knockdown studies were analyzed by two-way analysis of variance, and Student's t test was used for all other statistical analyses (GraphPad Prism version 5.0 software). p < 0.05 was considered statistically significant.
Results
COX-2 Participated in Regulating RPMI-8226 and U-266 Cell Proliferation
COX-1 and COX-2 are important upstream enzymes in the PG metabolism pathway. Human umbilical vein endothelial cells, which are known to have stable COX-1 and COX-2 expression (20, 21), were used as positive controls. By comparing with different controls, we observed that both COX-1 and COX-2 were abundantly expressed in RPMI-8226 and U-266 MM cell lines (Fig. 1A). In addition, we performed cell proliferation assays on RPMI-8226 and U-266 cells with selective COX-1/2 inhibitors SC-560/NS-398, known to repress ARH77 cell growth (12). As shown in Fig. 1, B–E, NS-398 suppressed cell proliferation in a dose-dependent manner (p < 0.05), whereas SC-560 did not show any inhibitory effect. These findings suggest that COX-2 contributes to mediating MM cell proliferation. We next assessed downstream PG profiles and observed significant reduction (p < 0.05) of prostaglandin D2, E2, and F2α production in both MM cell lines stimulated by SC-560 and NS-398 (Fig. 1, F–O). Interestingly, only NS-398 notably decreased TxB2 production in RPMI-8226 and U-266 cells by 65 and 60%, respectively (p < 0.05), but SC-560 failed to influence TxB2 production (Fig. 1, J and O), consistent with COX-2 regulation of cell proliferation.
FIGURE 1.

COX-2 regulated RPMI-8226 and U-266 cell proliferation. A, the protein levels of COX-1 and COX-2 in human umbilical vein endothelial cells, RPMI-8226 cells, and U-266 cells transfected or non-transfected with scramble, COX-1 siRNA, or COX-2 siRNA were measured by Western blotting. B–E, CCK-8 cell proliferation assays were performed to detect the effect of COX-1/2 inhibitors on proliferation of two MM cell lines. RPMI-8226 and U-266 cells were treated with graded concentrations of SC-560 (B and C) and NS-398 (D and E) for 24, 48, 72, and 96 h, respectively. Red, vehicle; green, 1 μm inhibitor; blue, 10 μm inhibitor; black, 30 μm inhibitor. *, p < 0.05 versus vehicle; #, p < 0.05, represents the differences among drug additional treatments with graded concentrations; n = 4. F–O, the PG profiles of RPMI-8226 and U-266 cells challenged by 30 μm SC-560 and NS-398 for 24 h were analyzed by LC/MS/MS. *, p < 0.05 versus vehicle; n = 3. Error bars, S.E.
TP Inhibition Suppressed Proliferation of RPMI-8226 and U-266 Cells
We continued to screen the mRNA levels of downstream PG receptors and found that the mRNA expressions of DP2, EP2, EP4, and TP receptors in RPMI-8226 and U-266 cells were much higher (p < 0.05) than those in normal BMMCs (Fig. 2, B, D, F, and I), whereas those of DP1, EP3, FP, and IP were markedly decreased (p < 0.05; Fig. 2, A, E, G, and H). Then we assessed changes in MM cell proliferation in response to treatments with DP2, EP2, EP4, and TP receptor antagonists as well as DP1, EP3, FP, and IP receptor agonists (Fig. 3, A–P) and found that only the TP antagonist, SQ29548, effectively inhibited proliferation in a dose-dependent manner (p < 0.05; Fig. 3, F and H). Notably, treatments of MM cells with 20 μm SQ29548 at four time points suppressed cell proliferation up to ∼50% (Fig. 3, F and H). This suppression was also found in cells transfected with TP siRNA when compared with the scrambled groups (p < 0.05; Fig. 4, C and D). In addition, we confirmed the effect of TP on MM cell proliferation using the TP agonist U46619 and observed that TP activation remarkably promoted cell proliferation (p < 0.05; Fig. 4, E and F). In particular, treatments of both MM cells with 20 μm U46619 at all time points promoted cell proliferation up to ∼35% (Fig. 4, E and F). These findings suggest that TP is implicated in modulating proliferation of RPMI-8226 and U-266 cells.
FIGURE 2.
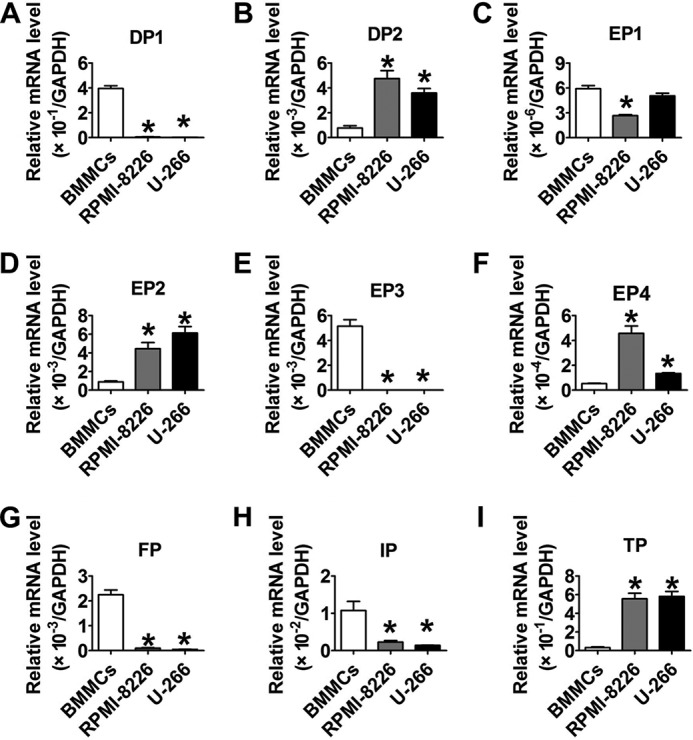
The mRNA levels of downstream PG receptors in two MM cell lines. A–I, the mRNA levels of PG receptors in RPMI-8266, U-266, and normal BMMCs were determined by qRT-PCR. The detected genes were DP1, DP2, EP1, EP2, EP3, EP4, FP, IP, and TP, respectively. *, p < 0.05 versus BMMCs; n = 3. Error bars, S.E.
FIGURE 3.

The TP antagonist inhibited proliferation of two MM cell lines. A–P, proliferation of two MM cell lines incubated with different inhibitors or agonists of PG receptors were analyzed by a CCK-8 assay kit. RPMI-8226 and U-266 cells were treated with graded concentrations of DP2 antagonist, CAY10471 (A and C); EP2 inhibitor, AH-6809 (B and D); EP4 inhibitor, L-161,982 (E and G); TP antagonist, SQ29548 (F and H); DP1 agonist, BW245C (I and K); EP3 agonist, misoprostol (J and L); FP agonist, latanoprost (M and O); or IP agonist, cicaprost (N and P) for 24, 48, 72, and 96 h, respectively. Different colored lines represent different drug concentrations. *, p < 0.05 versus vehicle; #, p < 0.05, differences among drug additional treatments with graded concentrations; n = 3. Error bars, S.E.
FIGURE 4.
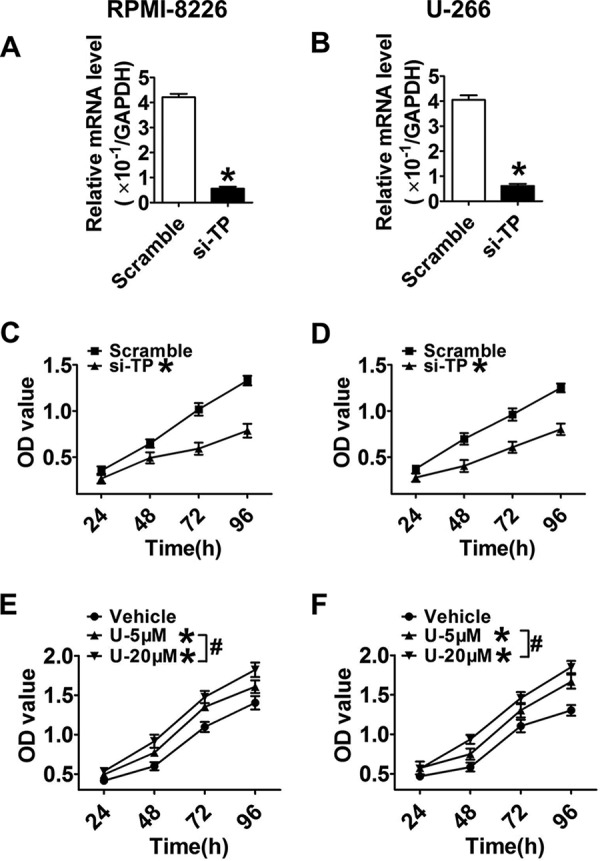
MM cell proliferation was suppressed by TP silencing or promoted by the TP agonist. A and B, TP knockdown efficiency in RPMI-8226 and U-266 cells was examined by qRT-PCR at 24 h post-transfection. Data are normalized to GAPDH levels. *, p < 0.05 versus scramble; n = 3. C and D, proliferation in MM cell lines transfected with TP siRNA or scrambled control at four time points was examined by CCK-8 cell proliferation assays. Red, scramble; black, TP siRNA. *, p < 0.05 versus scramble; n = 3. E and F, cells were supplemented with graded concentrations of the TP agonist, U46619, for 24, 48, 72, and 96 h, respectively. Red, vehicle; green, 5 μm agonist; black, 20 μm agonist. *, p < 0.05 versus vehicle; #, p < 0.05, differences among drug additional treatments with graded concentrations; n = 3. Error bars, S.E.
TP Blockade Resulted in G2/M Phase Delay by Depressing Cyclin B1 and CDK1 Expression via the JNK and p38 MAPK Signaling Pathways
Cell cycle progression is required for tumorigenesis; thus, to determine which SQ29548 elicits its growth-inhibitory effect by affecting cell cycle progression, we measured changes in cell cycle progression and the expression of cell cycle-regulating proteins. Flow cytometry analysis showed that exposure to 0.1, 5, and 20 μm SQ29548 significantly increased (p < 0.05) the percentage of RPMI-8226 and U-266 cells in G2/M phase in a dose-dependent manner, accompanied by markedly decreasing the percentage in S phase (p < 0.05; Fig. 5, A and B). Particularly, treatment of cells with 20 μm SQ29548 sharply increased the G2/M populations from 16 and 9% (vehicle) to 26 and 20% in RPMI-8226 and U-266 cells, respectively. These observations suggest that TP blockade induces G2/M phase delay in both MM cell lines, accounting for the antiproliferative effect of SQ29548. Similarly, TP knockdown also promoted G2/M phase arrest in MM cells (p < 0.05; Fig. 5, C and D). In addition, the CDK1-cyclin B1 complex is known to be critical for cell entry into mitosis (22). Thus, we further detected the expression level changes of cyclin B1 and CDK1 after SQ29548 treatment to illuminate the underlying mechanisms of G2/M phase delay caused by TP suppression. Our data demonstrate that the mRNA levels of CDK1 and cyclin B1 in both MM cell lines were notably down-regulated (p < 0.05) after 1 and 20 μm SQ29548 exposure (Fig. 6, A–D). Treatment with 20 μm SQ29548 decreased both gene transcript levels in RPMI-8226 and U-266 cells ∼1.5–2.2-fold relative to the vehicle. Moreover, the protein expression of CDK1 and cyclin B1 was attenuated 0.5–1-fold (p < 0.05) by 20 μm SQ29548 exposure (Fig. 6, E–G). This indicates that inhibition of CDK1 and cyclin B1 expression is involved in G2/M delay in RPMI-8226 and U-266 cells induced by TP suppression. Cyclin B1 is one of the first proteins to be identified as a substrate for ubiquitin-mediated proteolysis (23). Thus, we were curious whether SQ29548 decreased cyclin B1 protein levels by promoting its degradation in MM cells. In our study, LLnL, a calpain inhibitor that also blocks activity of the 26 S proteasome (24), increased cyclin B1 levels compared with LLnL non-treatment groups but did not reverse the reduction of cyclin B1 protein levels caused by SQ29548 (p < 0.05; Fig. 6, H–J). These data suggest that the reduction of cyclin B1 protein induced by SQ29548 results from simultaneously attenuating cyclin B1 mRNA expression and promoting protein degradation in MM cells. In addition, accumulation of G2/M cells induced by SQ29548 was completely reversed by exogenous cyclin B1 overexpression (p < 0.05; Fig. 6K), further highlighting cyclin B1 as the key molecule in G2/M progression delay caused by TP inhibition.
FIGURE 5.

TP blockade resulted in G2/M phase delay. A–D, the numbers of RPMI-8226 and U-266 cells treated with different concentrations of SQ29548 (A and B) or transfected with TP siRNA (C and D) for 24 h in G0/G1, S, and G2/M phases were determined by flow cytometry after staining with PI. The green, red, and blue areas represent G0/G1, S, and G2/M phases, respectively. Columns represent the average proportions of cells in different phases. *, p < 0.05 versus vehicle or scramble; n = 3. Error bars, S.E.
FIGURE 6.

TP modulated cell cycle progression by attenuating cyclin B1 and CDK1 expression. A–D, the mRNA expression levels of CDK1 and cyclin B1 were measured by qRT-PCR. RPMI-8226 and U-266 cells were stimulated by 1 and 20 μm SQ29548 for 24 h and then collected to analyze transcript levels. *, p < 0.05 versus vehicle; n = 3. E, CDK1 and cyclin B1 protein levels were examined by Western blotting analysis. RPMI-8226 and U-266 cells were stimulated with 20 μm SQ29548 (SQ) for 48 h and then collected to analyze protein expression. V, vehicle. F and G, density quantitation of CDK1 and cyclin B1 expression after normalization to β-actin as shown in E. *, p < 0.05 versus vehicle; data are from three independent experiments. H, cyclin B1 degradation was assessed by Western blotting analysis. Cells were treated with 20 μm SQ29548, 100 μm LLnL, or SQ29548 + LLnL for 24 h. I and J, density quantitation of cyclin B1 expression normalized to β-actin as shown in H. *, p < 0.05 versus vehicle; data are from three independent experiments. K, RPMI-8226 and U-266 cells were transiently transfected with cyclin B1-GFP plasmid or vector control before being treated with SQ29548 or DMSO for 24 h. Cell cycle progression was determined by flow cytometry after staining with PI. The green, red, and blue areas represent G0/G1, S, and G2/M phases, respectively. Columns represent the average proportions of cells in different phases. *, p < 0.05 versus vector; n = 3. Error bars, S.E.
MAPK signaling pathways contribute to modulate proliferation of MM cells (25). To investigate whether intracellular JNK, p38 MAPK, and ERK signaling pathways were involved in enhanced cell proliferation response to U46619, a series of experiments were performed by using the MAPK subtype inhibitors. The JNK inhibitor, SP600125, and p38 MAPK inhibitor, SB203580, abolished U46619-induced MM cell proliferation (p < 0.05; Fig. 7, A and B, middle and right). Incubation of MM cells with U46619 for 96 h elevated cell proliferation ∼25%, which was reduced 20–25% after SP600125 and SB203580 treatments (Fig. 7, A and B, middle and right). However, there was no significant effect of treatment with the ERK inhibitor PD98059 (Fig. 7, A and B, left). In addition, we investigated the combined effect of SP600125 and SB203580 on U46619-induced MM cell proliferation and observed nearly identical curves between treatment with U46619 plus two antagonists and treatment with two antagonists without U46619 supplementation (Fig. 7, C and D), suggesting that both JNK and p38 MAPK signaling are critical for mediating MM cell proliferation. Upon further examination of JNK and p38 MAPK phosphorylation, we found that U46619 activated JNK and p38 MAPK phosphorylation, which was almost completely blocked by pretreatment with SP600125 and SB203580, respectively. Furthermore, SP600125 and SB203580 depressed the U46619-induced cyclin B1 and CDK1 protein expression in both MM cell lines (Fig. 7, E and F). These data suggest that the JNK and p38 MAPK pathways are required in the regulation of cyclin B1/CDK1-mediated G2/M cell cycle delay in response to TP suppression.
FIGURE 7.

JNK and p38 MAPK signaling pathways mediated proliferation of two MM cell lines and the protein expression of CDK1 and cyclin B1. A–D, proliferation of two MM cell lines incubated with U46619 (20 μm), ERK inhibitor, PD98059 (30 μm), JNK inhibitor, SP600125 (20 μm), p38 MAPK inhibitor, SB203580 (20 μm), U46619 combined with any one mentioned MAPK inhibitor, SP600125 + SB203580, or U46619 + SP600125 + SB203580 for 24, 48, 72, and 96 h were measured by a CCK-8 assay kit. Different colored lines, various treatments as indicated. *, p < 0.05 versus vehicle; #, p < 0.05 versus U46619; n = 3. E and F, the protein levels of phosphorylated JNK and p38 MAPK, total JNK and p38 MAPK, CDK1, and cyclin B1 were tested by Western blotting analysis. RPMI-8226 and U-266 cells were stimulated by U46619, SP600125, and SB203580 for 48 h and then collected to analyze protein expression. Error bars, S.E.
TP Suppression Induced RPMI-8226 and U-266 Cell Apoptosis by Caspase 3 Activation
To examine whether the anti-tumor activity of the TP antagonist was related to apoptosis, PI (an indicator of late apoptosis) and annexin V-FITC co-staining was performed. The percentage of apoptotic cells was higher in cells treated with SQ29548 (19–26%) and lower in cells treated with U46619 (1–3%) compared with the vehicles (DMSO, 9–16%) (p < 0.05; Fig. 8B). Caspase 3 activation is a marker of apoptosis; therefore, we examined the caspase 3 activity in two MM cell lines challenged by SQ29548 and U46619 and observed 2.5- and 1.5-fold increases (p < 0.05; Fig. 8, E and F) in RPMI-8226 and U-266 cells after SQ29548 treatment, whereas U46619 had the opposite action (p < 0.05). We also found that NS-398, but not SC-560, induced apoptosis (Fig. 8A) and improved caspase 3 activity (Fig. 8, C and D), in accordance with the proliferation data (Fig. 1, B–E). All data suggest that COX-2, but not COX-1, modulates cell proliferation and apoptosis, and TP is involved in regulating MM cells apoptosis through influencing caspase 3 activation. TP silencing data further confirmed that TP knockdown increased cell apoptosis ∼16 and 19% in two MM cell lines (p < 0.05; Fig. 9A) and enhanced caspase 3 activity (p < 0.05; Fig. 9, B and C) compared with the scrambled control. Then we studied the effect of caspase 3 silencing on cell apoptosis induced by TP suppression and observed increased caspase 3 activation after SQ29548 treatment, but the activation disappeared when caspase 3 was interfered with siRNA (Fig. 9D). Importantly, the increased apoptosis in response to SQ29548 was completely reversed after caspase 3 silencing (p < 0.05; Fig. 9E) and further demonstrates the critical role of caspase 3 in the TP inhibition-induced apoptosis. Because this change in caspase 3 activity is usually indicative of mitochondrial dysfunction, we performed JC-1 assays to examine MMP in our cell lines. Notably, we found that TP knockdown increased MMP depolarization ∼9 and 15% in two MM cell lines (p < 0.05; Fig. 9F) compared with the scrambled controls.
FIGURE 8.

The TP antagonist induced RPMI-8226 and U-266 cell apoptosis. A and B, annexin V-FITC/PI staining for apoptosis in two MM cells treated with SC-560 (30 μm), NS-398 (20 μm), SQ29548 (20 μm), and U46619 (20 μm) for 24 h was assessed by flow cytometry analysis. The percentages of early or late apoptosis are presented in the bottom right and top right quadrants, respectively. Columns represent the average proportions of apoptotic cells. *, p < 0.05 versus vehicle; n = 4. C–F, the effects of SC-560, NS-398, SQ29548, and U46619 on caspase 3 activity of two MM cell lines challenged for 24 h were analyzed using a caspase 3 activity assay kit. *, p < 0.05 versus vehicle; n = 3. Error bars, S.E.
FIGURE 9.

TP knockdown induced apoptosis in two cell lines via caspase 3 activation and damaged mitochondrial membrane potential. A, annexin V-FITC/PI staining for apoptosis in two MM cells transfected with TP siRNA for 24 h was assessed by flow cytometry analysis. Columns represent the average proportions of apoptotic cells. *, p < 0.05 versus scramble; n = 3. B and C, the effect of TP knockdown on caspase 3 activity in RPMI-8226 and U-266 cells was detected using a caspase 3 activity assay kit. *, p < 0.05 versus scramble; n = 3. D and E, two MM cells were transfected with caspase 3 siRNA or negative control siRNA and then incubated with TP antagonist SQ29548 (20 μm) or DMSO for 24 h. Caspase 3 protein levels were examined by Western blotting analysis (D). Annexin V-FITC/PI staining for apoptosis in two MM cells was assessed by flow cytometry analysis. Columns represent the average proportions of apoptotic cells (E). *, p < 0.05 versus vehicle; #, p < 0.05 versus scramble; n = 3. F, mitochondrial membrane potential of two MM cells transfected with TP siRNA or negative control siRNA was assessed by flow cytometry analysis after incubation with JC-1 dye. The percentages of depolarized cells are presented in the top right quadrants. Columns represent the average proportions of normal, depolarized, and necrotic cells. *, p < 0.05 versus scramble; n = 3. Error bars, S.E.
Discussion
MM is an incurable plasma cell malignancy characterized by increased morbidity with age. Current treatments are still relatively inefficient, and identification of new and more effective therapeutic strategies is therefore urgently needed. TxA2-related molecules play important roles in tumor progression, such as migration, proliferation, differentiation, development, and apoptosis (4, 5). However, the functional involvement of COX/TxA2/TP in MM cell proliferation has not been clarified.
PGs are important mediators that support the growth of several solid tumors (26, 27). COX-1 and COX-2 catalyze the conversion of AA into various PGs. Recently, COX-2, but not COX-1, has been reported to be overexpressed in various tumors, such as lung, colon, pancreas, gastric, bladder, head, and neck cancers (28). Moreover, COX-2 is essential for the survival and proliferation of malignant cells (29) and is frequently expressed in MM (26). Li et al. (30) have shown that COX-2 siRNA transfection can suppress COX-2 protein expression in RPMI-8226 cells, which leads to growth inhibition and apoptosis independent of Bcl-2. Another study (12) has shown that seven human myeloma cell lines constitutively express COX-1 mRNA, whereas COX-2 levels vary markedly among cell lines and are not detectable in U-266 and RPMI-8226 cells. In the present study, we examined protein level expression of both COX-1 and COX-2 in RPMI-8226 and U-266 cells. The differences of COX expression among these studies may be caused by different detection methods. However, only the COX-2 inhibitor, NS398, and not the COX-1 inhibitor, SC560, suppressed proliferation of two MM cell lines, indicating that COX-2 suppression plays an inhibitive role in MM cell proliferation. These findings were inconsistent with a previous report that both COX-1 and COX-2 inhibitors suppress proliferation of ARH-77 cells, but the supplementary concentrations in that study are higher (100 μm) than those in our study (30 μm) or the general dosage (10 μm) (12). In addition, TxB2 production was also decreased by COX-2 inhibitor, but not COX-1 inhibitor, similar to their effects on MM cell proliferation, suggesting that NS398 inhibits TxB2 synthesis to delay cell proliferation, which is supported by previous findings in lung adenocarcinoma cells (10).
TxA2 is produced mainly in platelets, but it can also be synthesized in other types of cells, including monocytes and tumor cells. Accordingly, TP expression is increased in many tumor tissues compared with non-tumor tissues (11). Moreover, several studies suggest that TP is involved in tumor cell proliferation, migration, and invasion, which are key steps in tumor progression (5). Our initial screening of PG receptor expression showed that the mRNA levels of DP2, EP2, EP4, and TP in RPMI-8226 and U-266 cells were much higher than those in normal BMMCs, whereas those of DP1, EP3, FP, and IP decreased sharply. We subsequently treated two cell lines with DP2, EP2, EP4, and TP receptor antagonists as well as DP1, EP3, FP, and IP receptor agonists and found that only the TP antagonist, SQ29548, significantly inhibited cell proliferation. We confirmed that TP silencing also suppressed cell proliferation, whereas the TP agonist, U46619, could promote cell proliferation. These results support a positive role for TP in MM cell proliferation, in line with previous studies performed in the lung adenocarcinoma cell lines H-157 and A549 (9, 31).
Cell cycle checkpoints play important roles in coordination of cell cycle transitions in eukaryotic cells, and abnormal regulation of cell cycle checkpoints frequently occurs in tumor cells (32). Our analysis showed that TP inhibition caused two MM cells delayed at G2/M phase accompanied by lowering CDK1 and cyclin B1 expression, both of which are important regulators for entry into mitosis (22). CDK1 is the founding member of the CDK family (33), and it is the only CDK to partner cyclin B, which starts to accumulate in S phase (34). CDK1-cyclin B1 complexes are also thought to regulate several events during G2/M transition (10, 35). Silence of cyclin B1 inhibits proliferation by arresting cells in G2/M phase (36). In accordance with this report, our findings indicate that accumulation of cells in G2/M phase induced by SQ29548 is completely reversed in MM cells overexpressed with cyclin B1. Lv et al. (37) demonstrate that asperolide A induces G2/M arrest in human NCI-H460 lung carcinoma cells by activating the Ras/Raf/MEK/ERK signaling and suppressing CDK1 and cyclin B1. Li et al. (9) have revealed that activation of TP stimulates cell proliferation in lung adenocarcinoma cell line H-157 by inducing cyclin D1 expression, which differs from our results, indicating that TP affects different cell proliferation depending on different cell cycle arrest caused by different genes. However, the down-regulation of cyclin B1/CDK1 herein agreed with the previous reports and clarified the underlying mechanisms by which TP blockade caused G2/M cell cycle delay to inhibit MM cell proliferation. Moreover, we observed that the decrease in cyclin B1 protein levels caused by SQ29548 was associated with the simultaneous down-regulation of cyclin B1 mRNA and enhanced protein degradation in MM cells, in line with previous data suggesting that the reduction of cyclin B1 by lidamycin in MCF-7 cells occurs through a similar mechanism (24).
MAPK is implicated in regulating proliferation, survival, and cell death responses of tumor cells, and several studies report the involvement of MAPK in cancer deregulation (32); however, the precise mechanisms of MAPK in cell proliferation and cell cycle progression of MM cells affected by TP activation remain elusive. In our study, JNK inhibitor (SP600125) and p38 MAPK inhibitor (SB203580) abolished U46619-induced MM cell proliferation, and the combined effect of SP600125 and SB203580 on U46619-induced MM cell proliferation was nearly identical to that of two-antagonist treatment without U46619 supplementation. This indicates that both JNK and p38 MAPK signaling play critical roles in mediating MM cell proliferation. We next observed that U46619 activated JNK and p38 MAPK by phosphorylation, which was almost completely blocked by pretreatment with SP600125 and SB203580. In line with our data, Bolla et al. (15) found that activation of p38 MAPK in arteries treated with U46619 exists, and Lei et al. (16) showed that U46619 promotes JNK phosphorylation in the bronchial smooth muscle. In addition, we also found that treatments of MM cells with SP600125 and SB203580 depressed U46619-induced protein expression of cyclin B1 and CDK1. These findings suggest that the JNK and p38 MAPK pathways are required for regulation of cyclin B1/CDK1-mediated G2/M cell cycle delay in response to the TP antagonist. Recent studies have shown that JNK activity plays an important role in cell proliferation and tumor progression, and SP600125 is known to induce growth inhibition, endoreduplication, and apoptosis (38–40). Hideshima et al. (40) have revealed that SP600125 induces growth inhibition via induction of G1 or G2/M arrest in U266 and MM1S cells, respectively. These observations indirectly supported our opinion that the TP antagonist induced G2/M phase delay in two MM cell lines through inhibiting JNK signaling activation. Medicherla et al. (41) have found that a p38 α-selective MAPK inhibitor or its structural analog reduces human myeloma cell growth in vivo at early and advanced phases of the disease. However, many other studies have proposed that cell cycle arrest is dependent upon activation of p38 MAPK (42, 43). Our results proved that the TP antagonist induced G2/M phase delay in two MM cell lines through inhibiting p38 MAPK signaling activation. This controversy is also apparent with respect to the role of ERK in cell cycle arrest. For example, several publications have provided evidence that prevention of ERK activation leads to G2/M phase arrest in gastric carcinoma AGS cells, human osteoblastic cell line hFOB 1.19, and DU145 human prostate cancer cells (44–46), whereas other reports have documented that ERK activation is necessary for causing cell cycle (37, 47, 48). These contrasting results may arise from cell type-specific differences or from activation of different upstream signaling pathways under different study conditions.
Apoptosis is a morphologically and biochemically distinct form of eukaryotic cell death that occurs under a variety of physiological and pathological conditions. Here, we showed that NS398, SQ29548, and TP silencing induced apoptosis in two MM cell lines, and U46619 protected MM cells from apoptosis. These findings were consistent with previous data from other cell types (7, 49, 50). Meanwhile, we found that NS398, SQ29548, and TP silencing elevated caspase 3 activity, and, as expected, U46619 decreased caspase 3 activity, in accordance with flow cytometry results. In addition, caspase 3 silencing completely reversed the enhanced apoptosis resulting from SQ29548 treatment and further demonstrates the critical role of caspase 3 in the TP inhibition-induced apoptosis. The MMP detection showed that TP knockdown increased mitochondrial dysfunction, in agreement with the results for caspase 3. Based on these observations, we infer that COX-2 plays a major role in MM cell apoptosis through its downstream receptor. Except for leading to G2/M phase delay, the induction of apoptosis also offers help to the TP depression-mediated inhibition of MM cell proliferation.
In summary, COX-2 may be involved in the modulation of cell proliferation and apoptosis through downstream TxA2/TP signaling. Our inhibition results indicate that TxA2 increases MM cell proliferation by enhancing cyclin B1/CDK1 expression and p38 MAPK/JNK activation to decrease cell cycle delay at G2/M phase, accompanied by cellular apoptosis reduction. Thus, inhibition of TxA2/TP signaling has potential as a novel agent to target kinase cascades for MM therapy.
Author Contributions
Yu Yu, H. X., and Ying Yu conceived and designed the research; Q. L., B. T., G. L., G. C., and Q. Z. performed the experiments; Yu Yu and Q. L. wrote the manuscript; Yu Yu, H. X., and Ying Yu revised the manuscript.
This work was supported by Ministry of Science and Technology of China Grant 2012CB945100; National Natural Science Foundation of China Grants 91439204, 31371154, and 81470366; Science and Technology Commission of Shanghai Municipality Grants 14JC1407400 and 13ZR1438800; and Science and Technology Service Network Initiative Grant KFJ-EW-STS-099. The authors declare that they have no conflicts of interest with the contents of this article.
- MM
- multiple myeloma
- AA
- arachidonic acid
- BM
- bone marrow
- BMMC
- bone marrow mononuclear cell
- CCK-8
- cell counting kit-8
- CDK1
- cyclin-dependent kinase-1
- COX
- cyclooxygenase
- DP
- EP, FP, and IP, D, E, F, and I prostanoid receptor, respectively
- LLnL
- calpain inhibitor I
- MMP
- mitochondria membrane potential
- PGs
- prostaglandins
- PI
- propidium iodide
- qRT-PCR
- quantitative RT-PCR
- TxA2
- thromboxane A2
- TxB2
- thromboxane B2
- TP
- TxA2 receptor (T prostanoid receptor).
References
- 1. Trojan A., Tinguely M., Vallet S., Seifert B., Jenni B., Zippelius A., Witzens-Harig M., Mechtersheimer G., Ho A., Goldschmidt H., Jäger D., Boccadoro M., and Ladetto M. (2006) Clinical significance of cyclooxygenase-2 (COX-2) in multiple myeloma. Swiss Med. Wkly. 136, 400–403 [DOI] [PubMed] [Google Scholar]
- 2. Kharaziha P., De Raeve H., Fristedt C., Li Q., Gruber A., Johnsson P., Kokaraki G., Panzar M., Laane E., Osterborg A., Zhivotovsky B., Jernberg-Wiklund H., Grandér D., Celsing F., Björkholm M., Vanderkerken K., and Panaretakis T. (2012) Sorafenib has potent antitumor activity against multiple myeloma in vitro, ex vivo, and in vivo in the 5T33MM mouse model. Cancer Res. 72, 5348–5362 [DOI] [PubMed] [Google Scholar]
- 3. Brenner H., Gondos A., and Pulte D. (2008) Recent major improvement in long-term survival of younger patients with multiple myeloma. Blood 111, 2521–2526 [DOI] [PubMed] [Google Scholar]
- 4. Nie D., and Honn K. V. (2002) Cyclooxygenase, lipoxygenase and tumor angiogenesis. Cell Mol. Life Sci. 59, 799–807 [DOI] [PMC free article] [PubMed] [Google Scholar]
- 5. Ekambaram P., Lambiv W., Cazzolli R., Ashton A. W., and Honn K. V. (2011) The thromboxane synthase and receptor signaling pathway in cancer: an emerging paradigm in cancer progression and metastasis. Cancer Metastasis Rev. 30, 397–408 [DOI] [PMC free article] [PubMed] [Google Scholar]
- 6. Raychowdhury M. K., Yukawa M., Collins L. J., McGrail S. H., Kent K. C., and Ware J. A. (1994) Alternative splicing produces a divergent cytoplasmic tail in the human endothelial thromboxane A2 receptor. J. Biol. Chem. 269, 19256–19261 [PubMed] [Google Scholar]
- 7. Lin X., Ramamurthy S. K., and Le Breton G. C. (2005) Thromboxane A receptor-mediated cell proliferation, survival and gene expression in oligodendrocytes. J. Neurochem. 93, 257–268 [DOI] [PubMed] [Google Scholar]
- 8. Morinelli T. A., Zhang L. M., Newman W. H., and Meier K. E. (1994) Thromboxane A2/prostaglandin H2-stimulated mitogenesis of coronary artery smooth muscle cells involves activation of mitogen-activated protein kinase and S6 kinase. J. Biol. Chem. 269, 5693–5698 [PubMed] [Google Scholar]
- 9. Li X., and Tai H. H. (2009) Activation of thromboxane A2 receptors induces orphan nuclear receptor Nurr1 expression and stimulates cell proliferation in human lung cancer cells. Carcinogenesis 30, 1606–1613 [DOI] [PubMed] [Google Scholar]
- 10. Huang R. Y., Li S. S., Guo H. Z., Huang Y., Zhang X., Li M. Y., Chen G. G., and Zeng X. (2014) Thromboxane A2 exerts promoting effects on cell proliferation through mediating cyclooxygenase-2 signal in lung adenocarcinoma cells. J. Cancer Res. Clin. Oncol. 140, 375–386 [DOI] [PMC free article] [PubMed] [Google Scholar]
- 11. Gustafsson A., Hansson E., Kressner U., Nordgren S., Andersson M., Lönnroth C., and Lundholm K. (2007) Prostanoid receptor expression in colorectal cancer related to tumor stage, differentiation and progression. Acta Oncol. 46, 1107–1112 [DOI] [PubMed] [Google Scholar]
- 12. Ding J., Tsuboi K., Hoshikawa H., Goto R., Mori N., Katsukawa M., Hiraki E., Yamamoto S., Abe M., and Ueda N. (2006) Cyclooxygenase isozymes are expressed in human myeloma cells but not involved in anti-proliferative effect of cyclooxygenase inhibitors. Mol. Carcinog. 45, 250–259 [DOI] [PubMed] [Google Scholar]
- 13. Zhang W., and Liu H. T. (2002) MAPK signal pathways in the regulation of cell proliferation in mammalian cells. Cell Res. 12, 9–18 [DOI] [PubMed] [Google Scholar]
- 14. Baek S. H., Kim C., Lee J. H., Nam D., Lee J., Lee S. G., Chung W. S., Jang H. J., Kim S. H., and Ahn K. S. (2015) Cinobufagin exerts anti-proliferative and pro-apoptotic effects through the modulation ROS-mediated MAPKs signaling pathway. Immunopharmacol. Immunotoxicol. 37, 265–273 [DOI] [PubMed] [Google Scholar]
- 15. Bolla M., Matrougui K., Loufrani L., Maclouf J., Levy B., Levy-Toledano S., Habib A., and Henrion D. (2002) p38 mitogen-activated protein kinase activation is required for thromboxane-induced contraction in perfused and pressurized rat mesenteric resistance arteries. J. Vasc. Res. 39, 353–360 [DOI] [PubMed] [Google Scholar]
- 16. Lei Y., Cao Y., Zhang Y., Edvinsson L., and Xu C. B. (2011) Enhanced airway smooth muscle cell thromboxane receptor signaling via activation of JNK MAPK and extracellular calcium influx. Eur. J. Pharmacol. 650, 629–638 [DOI] [PubMed] [Google Scholar]
- 17. Gao Y., Tang S., Zhou S., and Ware J. A. (2001) The thromboxane A2 receptor activates mitogen-activated protein kinase via protein kinase C-dependent Gi coupling and Src-dependent phosphorylation of the epidermal growth factor receptor. J. Pharmacol. Exp. Ther. 296, 426–433 [PubMed] [Google Scholar]
- 18. Zhao J., Mou Y., Bernstock J. D., Klimanis D., Wang S., Spatz M., Maric D., Johnson K., Klinman D. M., Li X., and Hallenbeck J. M. (2015) Synthetic oligodeoxynucleotides containing multiple telemeric TTAGGG motifs suppress inflammasome activity in macrophages subjected to oxygen and glucose deprivation and reduce ischemic brain injury in stroke-prone spontaneously hypertensive rats. PLoS One 10, e0140772. [DOI] [PMC free article] [PubMed] [Google Scholar]
- 19. Zhang J., Zou F., Tang J., Zhang Q., Gong Y., Wang Q., Shen Y., Xiong L., Breyer R. M., Lazarus M., Funk C. D., and Yu Y. (2013) Cyclooxygenase-2-derived prostaglandin E2 promotes injury-induced vascular neointimal hyperplasia through the E-prostanoid 3 receptor. Circ. Res. 113, 104–114 [DOI] [PMC free article] [PubMed] [Google Scholar]
- 20. Hermenegildo C., Oviedo P. J., García-Pérez M. A., Tarín J. J., and Cano A. (2005) Effects of phytoestrogens genistein and daidzein on prostacyclin production by human endothelial cells. J. Pharmacol Exp. Ther. 315, 722–728 [DOI] [PubMed] [Google Scholar]
- 21. Sheu M. L., Ho F. M., Yang R. S., Chao K. F., Lin W. W., Lin-Shiau S. Y., and Liu S. H. (2005) High glucose induces human endothelial cell apoptosis through a phosphoinositide 3-kinase-regulated cyclooxygenase-2 pathway. Arterioscler. Thromb. Vasc. Biol. 25, 539–545 [DOI] [PubMed] [Google Scholar]
- 22. Moussa O., Riker J. M., Klein J., Fraig M., Halushka P. V., and Watson D. K. (2008) Inhibition of thromboxane synthase activity modulates bladder cancer cell responses to chemotherapeutic agents. Oncogene 27, 55–62 [DOI] [PubMed] [Google Scholar]
- 23. Glotzer M., Murray A. W., and Kirschner M. W. (1991) Cyclin is degraded by the ubiquitin pathway. Nature 349, 132–138 [DOI] [PubMed] [Google Scholar]
- 24. Liu X., He H., Feng Y., Zhang M., Ren K., and Shao R. (2006) Difference of cell cycle arrests induced by lidamycin in human breast cancer cells. Anticancer Drugs 17, 173–179 [DOI] [PubMed] [Google Scholar]
- 25. Ma Y., Jin Z., Huang J., Zhou S., Ye H., Jiang S., and Yu K. (2014) Quercetin suppresses the proliferation of multiple myeloma cells by down-regulating IQ motif-containing GTPase activating protein 1 expression and extracellular signal-regulated kinase activation. Leuk. Lymphoma 55, 2597–2604 [DOI] [PubMed] [Google Scholar]
- 26. Ladetto M., Vallet S., Trojan A., Dell'Aquila M., Monitillo L., Rosato R., Santo L., Drandi D., Bertola A., Falco P., Cavallo F., Ricca I., De Marco F., Mantoan B., Bode-Lesniewska B., Pagliano G., Francese R., Rocci A., Astolfi M., Compagno M., Mariani S., Godio L., Marino L., Ruggeri M., Omedè P., Palumbo A., and Boccadoro M. (2005) Cyclooxygenase-2 (COX-2) is frequently expressed in multiple myeloma and is an independent predictor of poor outcome. Blood 105, 4784–4791 [DOI] [PubMed] [Google Scholar]
- 27. Pai R., Soreghan B., Szabo I. L., Pavelka M., Baatar D., and Tarnawski A. S. (2002) Prostaglandin E2 transactivates EGF receptor: a novel mechanism for promoting colon cancer growth and gastrointestinal hypertrophy. Nat. Med. 8, 289–293 [DOI] [PubMed] [Google Scholar]
- 28. Strillacci A., Griffoni C., Valerii M. C., Lazzarini G., Tomasi V., and Spisni E. (2010) RNAi-based strategies for cyclooxygenase-2 inhibition in cancer. J. Biomed. Biotechnol. 2010, 828045. [DOI] [PMC free article] [PubMed] [Google Scholar]
- 29. Nakanishi Y., Kamijo R., Takizawa K., Hatori M., and Nagumo M. (2001) Inhibitors of cyclooxygenase-2 (COX-2) suppressed the proliferation and differentiation of human leukaemia cell lines. Eur. J. Cancer 37, 1570–1578 [DOI] [PubMed] [Google Scholar]
- 30. Li Q. B., Chen Z. C., You Y., and Zou P. (2007) Small interfering RNA of cyclooxygenase-2 induces growth inhibition and apoptosis independently of Bcl-2 in human myeloma RPMI8226 cells. Acta Pharmacol. Sin. 28, 1031–1036 [DOI] [PubMed] [Google Scholar]
- 31. Wei J., Yan W., Li X., Ding Y., and Tai H. H. (2010) Thromboxane receptor α mediates tumor growth and angiogenesis via induction of vascular endothelial growth factor expression in human lung cancer cells. Lung Cancer 69, 26–32 [DOI] [PubMed] [Google Scholar]
- 32. Chien C. C., Wu M. S., Shen S. C., Ko C. H., Chen C. H., Yang L. L., and Chen Y. C. (2014) Activation of JNK contributes to evodiamine-induced apoptosis and G2/M arrest in human colorectal carcinoma cells: a structure-activity study of evodiamine. PLoS One 9, e99729. [DOI] [PMC free article] [PubMed] [Google Scholar]
- 33. Lohka M. J., Hayes M. K., and Maller J. L. (1988) Purification of maturation-promoting factor, an intracellular regulator of early mitotic events. Proc. Natl. Acad. Sci. U.S.A. 85, 3009–3013 [DOI] [PMC free article] [PubMed] [Google Scholar]
- 34. Pines J., and Hunter T. (1989) Isolation of a human cyclin cDNA: evidence for cyclin mRNA and protein regulation in the cell cycle and for interaction with p34cdc2. Cell 58, 833–846 [DOI] [PubMed] [Google Scholar]
- 35. Brown N. R., Korolchuk S., Martin M. P., Stanley W. A., Moukhametzianov R., Noble M. E., and Endicott J. A. (2015) CDK1 structures reveal conserved and unique features of the essential cell cycle CDK. Nat. Commun. 6, 6769. [DOI] [PMC free article] [PubMed] [Google Scholar]
- 36. Yuan J., Krämer A., Matthess Y., Yan R., Spänkuch B., Gätje R., Knecht R., Kaufmann M., and Strebhardt K. (2006) Stable gene silencing of cyclin B1 in tumor cells increases susceptibility to taxol and leads to growth arrest in vivo. Oncogene 25, 1753–1762 [DOI] [PubMed] [Google Scholar]
- 37. Lv C., Sun W., Sun H., Wei S., Chen R., Wang B., and Huang C. (2013) Asperolide A, a marine-derived tetranorditerpenoid, induces G2/M arrest in human NCI-H460 lung carcinoma cells, is mediated by p53-p21 stabilization and modulated by Ras/Raf/MEK/ERK signaling pathway. Mar. Drugs 11, 316–331 [DOI] [PMC free article] [PubMed] [Google Scholar]
- 38. Du L., Lyle C. S., Obey T. B., Gaarde W. A., Muir J. A., Bennett B. L., and Chambers T. C. (2004) Inhibition of cell proliferation and cell cycle progression by specific inhibition of basal JNK activity: evidence that mitotic Bcl-2 phosphorylation is JNK-independent. J. Biol. Chem. 279, 11957–11966 [DOI] [PubMed] [Google Scholar]
- 39. Mingo-Sion A. M., Marietta P. M., Koller E., Wolf D. M., and Van Den Berg C. L. (2004) Inhibition of JNK reduces G2/M transit independent of p53, leading to endoreduplication, decreased proliferation, and apoptosis in breast cancer cells. Oncogene 23, 596–604 [DOI] [PubMed] [Google Scholar]
- 40. Hideshima T., Hayashi T., Chauhan D., Akiyama M., Richardson P., and Anderson K. (2003) Biologic sequelae of c-Jun NH2-terminal kinase (JNK) activation in multiple myeloma cell lines. Oncogene 22, 8797–8801 [DOI] [PubMed] [Google Scholar]
- 41. Medicherla S., Reddy M., Ying J., Navas T. A., Li L., Nguyen A. N., Kerr I., Hanjarappa N., Protter A. A., and Higgins L. S. (2008) p38α-selective MAP kinase inhibitor reduces tumor growth in mouse xenograft models of multiple myeloma. Anticancer Res. 28, 3827–3833 [PubMed] [Google Scholar]
- 42. Feng Y. M., Feng C. W., Chen S. Y., Hsieh H. Y., Chen Y. H., and Hsu C. D. (2015) Cyproheptadine, an antihistaminic drug, inhibits proliferation of hepatocellular carcinoma cells by blocking cell cycle progression through the activation of P38 MAP kinase. BMC Cancer 15, 134. [DOI] [PMC free article] [PubMed] [Google Scholar]
- 43. Li J. P., Yang Y. X., Liu Q. L., Pan S. T., He Z. X., Zhang X., Yang T., Chen X. W., Wang D., Qiu J. X., and Zhou S. F. (2015) The investigational Aurora kinase A inhibitor alisertib (MLN8237) induces cell cycle G2/M arrest, apoptosis, and autophagy via p38 MAPK and Akt/mTOR signaling pathways in human breast cancer cells. Drug Des. Devel. Ther. 9, 1627–1652 [DOI] [PMC free article] [PubMed] [Google Scholar] [Retracted]
- 44. Liu L., Zhu Y., Xu Y., and Reiter R. J. (2012) Prevention of ERK activation involves melatonin-induced G1 and G2/M phase arrest in the human osteoblastic cell line hFOB 1.19. J. Pineal Res. 53, 60–66 [DOI] [PubMed] [Google Scholar]
- 45. Hatashita M., Taniguchi M., Baba K., Koshiba K., Sato T., Jujo Y., Suzuki R., and Hayashi S. (2014) Sinodielide A exerts thermosensitizing effects and induces apoptosis and G2/M cell cycle arrest in DU145 human prostate cancer cells via the Ras/Raf/MAPK and PI3K/Akt signaling pathways. Int. J. Mol. Med. 33, 406–414 [DOI] [PubMed] [Google Scholar]
- 46. Su C. C. (2014) Tanshinone IIA inhibits gastric carcinoma AGS cells through increasing p-p38, p-JNK and p53 but reducing p-ERK, CDC2 and cyclin B1 expression. Anticancer Res. 34, 7097–7110 [PubMed] [Google Scholar]
- 47. Tang D., Wu D., Hirao A., Lahti J. M., Liu L., Mazza B., Kidd V. J., Mak T. W., and Ingram A. J. (2002) ERK activation mediates cell cycle arrest and apoptosis after DNA damage independently of p53. J. Biol. Chem. 277, 12710–12717 [DOI] [PubMed] [Google Scholar]
- 48. Meloche S., and Pouysségur J. (2007) The ERK1/2 mitogen-activated protein kinase pathway as a master regulator of the G1- to S-phase transition. Oncogene 26, 3227–3239 [DOI] [PubMed] [Google Scholar]
- 49. Elder D. J., Halton D. E., Playle L. C., and Paraskeva C. (2002) The MEK/ERK pathway mediates COX-2-selective NSAID-induced apoptosis and induced COX-2 protein expression in colorectal carcinoma cells. Int. J. Cancer 99, 323–327 [DOI] [PubMed] [Google Scholar]
- 50. Moussa O., Ashton A. W., Fraig M., Garrett-Mayer E., Ghoneim M. A., Halushka P. V., and Watson D. K. (2008) Novel role of thromboxane receptors β isoform in bladder cancer pathogenesis. Cancer Res. 68, 4097–4104 [DOI] [PubMed] [Google Scholar]