Abstract
Acyl-CoA:cholesterol acyltransferase 1 (Acat1) converts cellular cholesterol to cholesteryl esters and is considered a drug target for treating atherosclerosis. However, in mouse models for atherosclerosis, global Acat1 knockout (Acat1−/−) did not prevent lesion development. Acat1−/− increased apoptosis within lesions and led to several additional undesirable phenotypes, including hair loss, dry eye, leukocytosis, xanthomatosis, and a reduced life span. To determine the roles of Acat1 in monocytes/macrophages in atherosclerosis, we produced a myeloid-specific Acat1 knockout (Acat1−M/−M) mouse and showed that, in the Apoe knockout (Apoe−/−) mouse model for atherosclerosis, Acat1−M/−M decreased the plaque area and reduced lesion size without causing leukocytosis, dry eye, hair loss, or a reduced life span. Acat1−M/−M enhanced xanthomatosis in apoe−/− mice, a skin disease that is not associated with diet-induced atherosclerosis in humans. Analyses of atherosclerotic lesions showed that Acat1−M/−M reduced macrophage numbers and diminished the cholesterol and cholesteryl ester load without causing detectable apoptotic cell death. Leukocyte migration analysis in vivo showed that Acat1−M/−M caused much fewer leukocytes to appear at the activated endothelium. Studies in inflammatory (Ly6Chi-positive) monocytes and in cultured macrophages showed that inhibiting ACAT1 by gene knockout or by pharmacological inhibition caused a significant decrease in integrin β 1 (CD29) expression in activated monocytes/macrophages. The sparse presence of lesion macrophages without Acat1 can therefore, in part, be attributed to decreased interaction between inflammatory monocytes/macrophages lacking Acat1 and the activated endothelium. We conclude that targeting ACAT1 in a myeloid cell lineage suppresses atherosclerosis progression while avoiding many of the undesirable side effects caused by global Acat1 inhibition.
Keywords: acyltransferase, atherosclerosis, cholesterol, cholesterol metabolism, macrophage
Introduction
In the early stages of atherogenesis, chronic inflammation increases the adherence of monocytes to activated endothelial cells of the artery, causing more monocytes to infiltrate the subendothelial space and transform into macrophages. In sustained hypercholesterolemia, resident macrophages continue to devour denatured lipoproteins, converting excess cholesterol to cholesteryl esters, and cause the cholesterol-loaded cells to become foamy. The cholesterol esterification process is carried out by acyl-coenzyme A:cholesterol acyltransferases (ACATs),5 also known as sterol O-acyltransferases. There are two ACAT genes, Acat1 (1) and Acat2 (2–4). Most tissues, including macrophages, express ACAT1 as the major isoenzyme and express ACAT2 as the minor isoenzyme (5). For many years, targeting ACAT1 to reduce foam cell formation has been considered as a strategy to treat atherosclerosis. Pharmacological studies in mouse models have shown that partial inhibition of both ACAT1 and ACAT2 (6, 7) or of ACAT1 only (8) reduces foam cell content in plaques and is beneficial in reducing atherosclerosis without much toxicity. In human trials, the ACAT inhibitors avasimibe and pactimibe (a second generation of avasimibe) were tested as supplements to statin (the potent HMG-CoA reductase inhibitor). However, neither drug showed efficacy in reducing plaque volume. These trials were inconclusive, likely because of the fact that avasimibe activates the expression of hepatic CYP3A4, which metabolizes various drugs, including statin. Co-administering avasimibe with statin might have neutralized the beneficial effects of statin. In addition, these trials did not examine whether ACAT inhibitors stabilized plaques. Mouse genetic studies were employed as an independent approach to evaluate the effect of ACAT1 inhibition in atherosclerosis. The results showed that, in hyperlipidemic mouse models, global Acat1 KO (Acat1−/−) or transplant study using bone marrow cells from Acat1−/− mice did not prevent lesion development. In addition, global Acat1−/− caused several additional undesirable phenotypes, including hair loss, dry eye, cutaneous xanthomatosis, and a shortened life span (9, 10). It was not clear whether the effects observed using the Acat1−/− mice were due to lack of ACAT1 in macrophages or in other cell types. We have shown recently that global Acat1 KO also increases proliferation of hematopoietic stem cells within the bone marrow (BM) and causes leukocytosis in mice (11). Increasing the production of myeloid and lymphoid lineages may affect atherosclerosis at various stages. A conditional Cre-recombinase transgenic mouse line under the control of the lysozyme-M promoter (LyzMCre) is available (12) and has been used successfully by many laboratories to delete specific genes in the myeloid lineage (i.e. monocytes, macrophages, dendritic cells, neutrophil granulocytes, and eosinophils) at 80–95% efficiency with no significant deletion in lymphoid lineages (T and B cells) as well as other cell lineages. To study the roles of ACAT1 in the myeloid lineage, here we report the generation and detailed characterization of a myeloid-specific Acat1 KO mouse model (Acat1−M/−M). We also report the atherosclerotic effects of Acat1−M/−M in hypercholesterolemic Apoe knockout (Apoe−/−) mice in vivo and on macrophage integrin β 1 expression in vitro. Additionally, we compare the effects of Acat1−/− versus Acat1−M/−M on leukocytosis, xanthomatosis, and life span.
Experimental Procedures
Mice and Generation of a Conditional Myeloid-specific Acat1 Knockout Mouse
WT, Apoe−/−, global Acat1−/− (generated by Dr. Robert V. Farese, Jr. at the University of California, San Francisco and received in the C57BL/6J background from Dr. Sergio Fazio at Vanderbilt), Acat1flox/flox, and Acat1−M/−M (myeloid cell-specific Acat1 knockout) mice were all in the C57BL/6J background. The conditional Acat1 mouse (Acat1flox/flox)was created in collaboration with InGeneious Laboratories (Stony Brook, NY). The Acat1 LoxP construct was made by inserting two LoxP sites covering Acat1 exon 14, which includes amino acid His-450, known to be essential for ACAT1 enzymatic activity (13). The construct was injected into ES cells, and the correctly targeted clones, determined by Southern blotting and by diagnostic PCR, were injected in C57BL/6 blastocysts. The Neo marker was removed by backcrossing the resultant mice with C57BL/6 Frt mice. Mice with a heterozygous Acat1 flox allele were crossed to produce WT mice with an Acat1 allele (Acat1+/+), mice with a heterozygous Acat1 LoxP allele (Acat1flox/+), and mice with a homozygous Acat1 LoxP allele (Acat1flox/flox). The alleles were confirmed by diagnostic PCR. Acat1−M/−M mice were generated by crossing Acat1flox/floxmice with the Cre-recombinase-transgenic mice under the control of the lysozyme-M promoter (LyzMCre) (The Jackson Laboratory).
The Apoe−/− mice were as described previously (11). The Apoe−/−/Acat1−/− and Apoe−/−/Acat1−M/−M mice were generated by crossing Acat1−/− mice or Acat1−M/−M mice with Apoe−/− mice. Mice were housed in a specific pathogen-free barrier facility under a regular light-dark cycle and fed standard chow (Harlan, catalog no. 2918, 0.02% cholesterol and 13.5 kCal% from fat) until they reached 8 weeks of age. Mice were then fed continuously with regular chow or a high-cholesterol, high-fat diet (designated here as Western diet) (Research Diet, catalog no. 99020201, 12.5%cholesterol and 35 kCal% from fat) (14) for various periods of time as indicated. Animal care and procedures were approved by the Dartmouth College Institutional Animal Care and Use Committee.
Mice Genotype Analysis
The PCR primers employed to genotype the Acat1LoxP allele were as follows: SDL2, 5′-TATGCCCTCGCCATCTGCCT-3′; LOX1, 5′-CCAGCAGTAGGCTCTCATATGC-3′. The PCR procedure to identify the loxP site is to start the initial denaturation step at 94 °C for 2 min (1 cycle), followed by cycling steps at 94 °C for 30 s, 60 °C for 30 s, and 72 °C for 1 min and 35 s (35 cycles) and, to complete the final elongation step, at 72 °C for 7 min (1 cycle). The primers to genotype LyzMCre+/+ were as follows: mutant, 5′-CCCAGAAATGCCAGATTACG-3′; common, 5′-CTTGGGCTGCCAGAA TTTCTC-3′; wild type, 5′-TTACAGTCGGCCAGGCTGAC-3′. The PCR procedure to identify LyzMCre is to start the initial denaturation step at 94 °C for 2 min (1 cycle), followed by cycling steps at 94° for 30 s, 65 °C for 30 s, and 72 °C for 1 min and 35 s (35 cycles) and, to complete the final elongation step, at 72 °C for 7 min (1 cycle).
ACAT1 Protein and mRNA Expression and ACAT Activity Assay in Intact Cells
For ACAT1 expression in mouse adrenal glands, animals were killed by CO2 asphyxiation. The adrenal glands were isolated rapidly and frozen on dry ice until ACAT1 immunoblotting analysis. Freshly thawed tissue samples were homogenized on ice in 50 mm Tris, 1 mm EDTA (pH 7.8) with protease inhibitors and then solubilized in detergent using 2.5% CHAPS and 1 m KCl. The homogenates were centrifuged at 100,000 × g for 45 min at 4 °C. The supernatants were used for immunoblotting analysis. For ACAT1 expression in peritoneal macrophages, monolayers of cells were solubilized with 10% SDS. The freshly solubilized lysate was used for immunoblotting analysis. For ACAT1 mRNA expression in peritoneal macrophages, total RNA was isolated with TRIzol reagent (Invitrogen) and stored at −80 °C until use. Real-time PCR was performed using the DyNamo HS SYBR Green quantitative PCR kit (New England Biolabs) according to the protocol supplied by the manufacturer. The primer sequences used for detection of the Acat1 gene in the Acat1−M/−M mouse were as follows: forward, 5′-TACATCATACTCCAACTACTACAG-3′; reverse, 5′-GACTGTCGTTAACAATGAAG-3′; amplicon size of 251 base pairs. For detection of the GAPDH gene, the primer sequences were as follows: forward, 5′-ATGGTGAAGGTCGGTGTG-3′; reverse, 5′-CATTCTCGGCCTTGACTG-3′; amplicon size of 186 base pairs. The PCR temperature conditions included an initial denaturation at 94 °C for 5 min. Subsequently, 40 cycles of amplification were performed that included denaturation at 94 °C for 10 s and annealing and elongation at 60 °C for 30 s. For measurement of ACAT activity in intact macrophage cells, peritoneal macrophages were isolated, plated, and fed with 100 μg/ml aggregated LDL, as described previously (15), with or without 5 μm F12511 (a small molecule isotype-nonspecific ACAT inhibitor) (16), for 12 h in a 6-well plate at 37 °C. 20 μl/well of 10 mm [3H]oleate in 10% bovine serum albumin was added to the 2 ml of medium/well at 37 °C for 60 min. The formation of [3H]cholesteryl oleate was quantitated by scintillation counting after lipid extraction and separation by thin-layer chromatography as described previously (17).
Isolation of Peritoneal Macrophages
Macrophages were recruited to the peritoneal cavity by injecting 1 ml of thioglycolate (3% w/v, Sigma) to induce acute aseptic peritonitis. 3 days after injection, the peritoneal cavities were infused with 6 ml of cold PBS. After agitation, 5 ml of fluid from the cavity was withdrawn carefully. Cells were collected as pellets after spinning down at 1000 × g for 5 min at 4 °C. The cell pellets were resuspended with DMEM containing 10% FBS and incubated in 6-well culture dishes with 2 ml/well in a 10% CO2 incubator at 37 °C for 2 h. After washing with PBS twice, the firmly attached macrophages were used to measure ACAT1 mRNA, ACAT1 protein, and ACAT enzyme activity in intact cells. These cells and the RAW macrophages were also used to monitor integrin β 1 expression as described in the legend for Fig. 5. The mouse RAW macrophage cell line 264.7 was a gift from Dr. Brent Berwin (Geisel School of Medicine at Dartmouth).
FIGURE 5.
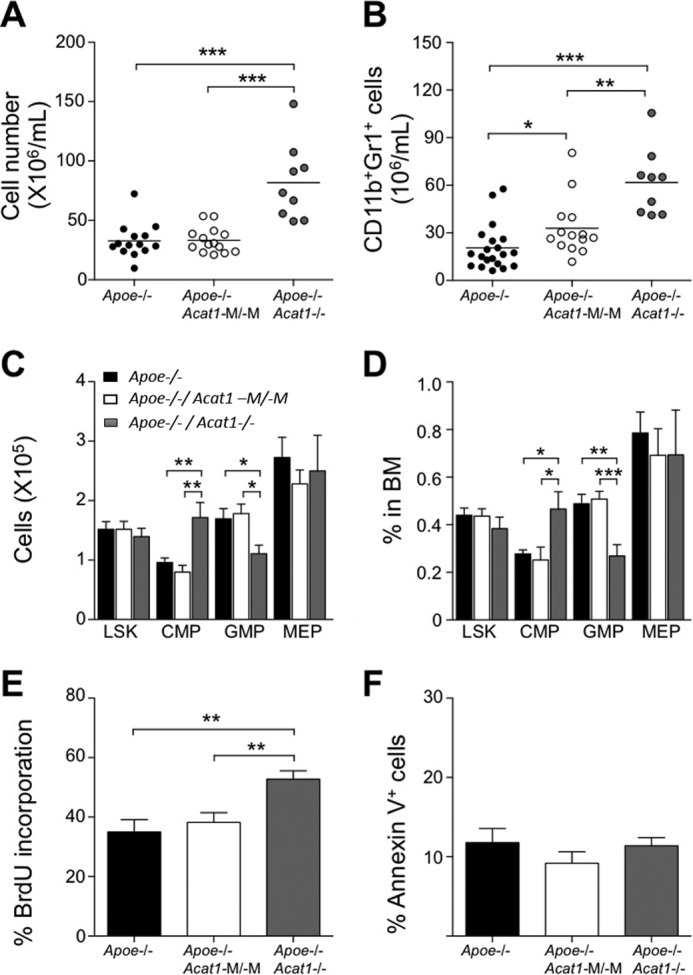
Apoe−/−/Acat1−/− mice, but not Apoe−/−/Acat1−M/−M mice on a Western diet display leukocytosis and higher LSK cell proliferation in bone marrow. Black, white, and gray columns represent results from Apoe−/−, Apoe−/−/Acat1−M/−M, or Apoe−/−/Acat1−/− mice, respectively. A and B, peripheral blood leukocyte numbers (A) and CD11b+Gr1+ myeloid cell numbers (B) were measured by flow cytometry. Horizontal bars represent mean values. Male Apoe−/−, Apoe−/−/Acat1−M/−M, and Apoe−/−/Acat1−/− mice were fed a Western diet for 6 weeks after they reached 8 weeks of age. Each circle represents a result from one animal (n = 9–20 mice/group). C and D, LSK, common myeloid progenitor (CMP), granulocyte/macrophage progenitor (GMP), and megakaryocyte/erythrocyte-restricted progenitor (MEP) cells in BM were quantified by flow cytometry. Results are reported as total number (C) and percentage of total cell numbers within the BM (n = 9–20 mice/group) (D). E and F, proliferation and apoptosis of LSK cells were quantified by bromodeoxyuridine (BrdU, E) or Annexin V staining (F) (n = 8–10 mice/group). Results are reported as mean ± S.E. *, p < 0.05; **, p < 0.01; ***, p < 0.001.
Flow Cytometry and Immunoblot Analysis to Monitor Integrin β 1 Expression
The methods used for flow cytometry analyses of blood cells and bone marrow cells were the same as those used in Ref. 11. The Ly6Chi monocyte subsets in the blood were isolated to measure the cell surface marker CD11b and integrin β 1 (CD29). The antibodies used (CD29-PE (HMβ1–1) and CD11b-PE (M1/70)) were from Biolegend. Cells were stained with antibodies as indicated at room temperature for 15 min and washed once with PBS containing 3% FBS. Flow cytometry analysis was performed by using a BD FACSCantoTM flow cytometer (BD Biosciences). Data were analyzed with FlowJo Software (TreeStar). For immunoblotting analysis, monolayers of RAW macrophages or peritoneal macrophages were rinsed in Hanks' buffer and then solubilized in radioimmune precipitation assay buffer with protease inhibitor mixture. The anti-CD29 antibodies used for immunoblot analysis were from Santa Cruz Biotechnology (catalog no. sc-374429).
Measurement of CD11b+ Myeloid Cell Migration into Aortas in Vivo
This procedure was on the basis of the method described in Ref. (18), with some modifications. WT and Acat1−M/−M myeloid cells (CD11b+) were isolated from blood leukocytes with a cell sorter and labeled with two different fluorescent dyes. The labeling involved the use of cell surface cross-linking reagents that carried two different fluorescent colors (PKH67GL and PKH26GL, Sigma). After labeling, equal numbers of WT and Acat1−M/−M CD11b+ myeloid cells were mixed and served as the donor. The cell mixtures were transferred at 4 × 10⁶ cells/mouse into recipient Apoe−/− mice fed a Western diet for 8 weeks. After 16 h, mouse aortas were isolated. Aortas were removed and immersed in DMEM, penicillin-streptomycin (1:100 dilution of 10,000 μg/ml stock), and amphotericin B (1:100 dilution of 250 μg/ml stock). Adherent connective and fatty tissues were removed by dissection. Isolated mouse aortas were incubated in a sterile collagenase-elastase solution containing collagenase type II (315 units/ml, Sigma) and elastase (1.25 units/ml, Sigma) in Hanks' balanced salt solution at 37 °C for 10 min to remove the adventitia. The remaining aortas were chopped into small pieces and incubated for 1 h in the collagenase-elastase solution at 37 °C. After pipetting several times to generate single-cell suspensions, the residual undigested tissues were filtered with 40-μm filters. The resultant single-cell suspensions were centrifuged (1000 × g, 5 min) to collect the pellets. The cell pellets were resuspended in PBS containing 3% FBS for flow analyses.
Preparation of Mouse Aortas for en Face Analysis
The en face analysis was performed according to the procedure described in Ref. 14. Briefly, the animals were fasted for 5 h. Blood was drawn. Mice were euthanized and perfused with PBS. The innominate artery, carotid arteries, aortic arch, and descending aorta to the iliac bifurcation were removed surgically and fixed in 4% formalin. After staining with Sudan IV (a neutral lipid stain), the lesion areas were quantified separately as anatomical areas, including the aortic arch (from the aortic valve to the left subclavian artery), the thoracic aorta (from the left subclavian artery to the final intercostal arteries), and the abdominal aorta (from the intercostal arteries to the bifurcation of the iliac arteries). The lesion areas in these regions were then summed to quantity the total lesion area. Quantification of Sudan staining was done with Image J.
Plaque Cholesterol and Cholesterol Ester Content Measurement
Mice were euthanized, and descending aortas were removed and weighed. Lipids in these samples were extracted by using chloroform:methanol at (2:1 v/v). After evaporation of organic solvents by nitrogen blowing, lipid samples were redissolved in ethanol for cholesterol measurements with the Wako cholesterol kit. Cholesterol ester content was calculated by subtraction of the total cholesterol (free cholesterol and cholesterol ester) value from the free cholesterol value.
Tissue Procurement for Histology
Histological tissues (aortas and skin) were collected from mice following an 8- or 12-week Western diet treatment. The specimens were submerged immediately in 10% formalin solution and sent to the Department of Pathology at Dartmouth Hitchcock Medical Center for paraffin embedding, sectioning, and H&E staining. Tissues needed for Oil Red O and immunofluorescence histochemical staining were embedded in OCT (a cryo-embedding medium) and flash-frozen on dry ice. 10-μm sections were cut with a cryostat and stored in a −80 °C freezer until processed.
Aortic Lesion Morphology and Cellular Content Analyses
The lesions were analyzed using immunofluorescence methods adapted from Ref. 19. In short, 10-μm frozen aortic sections were blocked with 3% BSA in Tris-buffered saline and Tween 20 (TBST) and then stained with primary antibodies (anti-CD68 or anti-α smooth muscle actin) overnight at 4 °C. The sections were then rinsed with TBST and incubated with the appropriate Alexa Fluor-conjugated secondary antibodies for 1 h at room temperature. After five TBST washes, an antifade reagent and coverslip were added to the stained sections. Images were taken with a Zeiss LS510 confocal microscope. The cross-sectional area of aortic plaque was quantified with ImageJ software. To stain and visualize aortic lipids, a protocol described in Ref. 20 was utilized. Briefly, a 0.3% Oil Red O staining solution was made freshly in H20 from a 0.5% isopropanol stock. Frozen OCT-embedded aortic sections were thawed and stained with Oil Red O for 15 min at room temperature. The sections were washed 20 times with H20 and mounted with an antifade reagent and coverslip. Images were visualized with an Olympus IX73 inverted fluorescence microscope. The lipid area was measured and quantified with ImageJ software.
TUNEL Assay
A Roche in situ cell death detection kit was used to quantify apoptosis within aortic lesions. The assay was conducted according to the protocol of the manufacturer. In short, 10-μm aortic root sections were rinsed with PBS, fixed with 4% paraformaldehyde for 10 min, and permeabilized with 2% Triton X-100 and 1% sodium citrate for 2 min. For a positive control, sections were incubated with 100 units of DNase for 15 min at room temperature and washed twice with PBS. After the permeabilization step, sections were incubated with 50 μl of TUNEL reaction mixture (5 μl of terminal deoxynucleotidyltransferase enzyme + 45 μl of fluorescein label solution) for 1 h at 37 °C. To counterstain for plaque macrophages, a rat anti-CD68 primary antibody was added to the sections and incubated overnight at 4 °C. After five TBST washes, sections were incubated with Alexa Fluor 568 goat anti-rat secondary antibody. For nuclear staining, sections were incubated with a Hoechst DNA stain (1:10,000) for 5 min, followed by three TBST washes. After the final wash step, antifade and coverslips were added to each slide. Images were taken with a Zeiss LS510 confocal microscope, and cells positive for all three stains (CD68, Hoechst, and TUNEL) were counted using ImageJ software.
Measurement of Body Weight and Food Intake
Body weight was monitored once a week. The measurements were done at 4 p.m. To measure food intake, a known amount of food was given to each animal. Every 2 weeks, the food was reweighed. The amount consumed was calculated by the difference between the original amount and the amount left.
Results
Generation and Characterization of a Myeloid-specific Acat1 KO Mouse
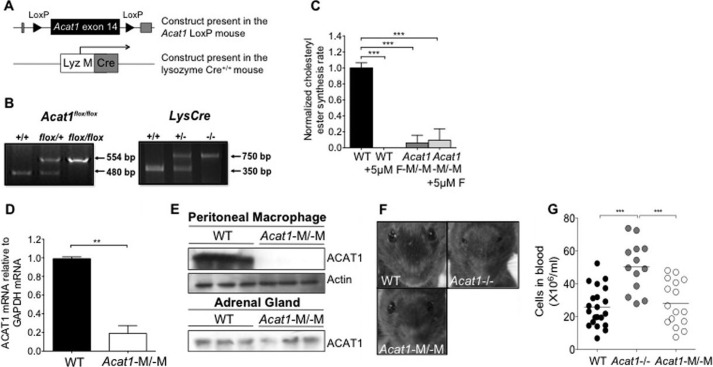
The lysozyme M Cre (LysMCre+/+) mouse was employed to inactivate genes in mice that contain the floxsites in the myeloid cell lineages (i.e. monocytes, macrophages, microglia, and granulocytes). We crossed conditional Acat1 mice (Acat1flox/flox) (described under “Experimental Procedures”) with the LysMCre+/+ mice (Fig. 1A) to obtain Acat1flox/flox/LysMCre+/+ (Acat1−M/−M) and Acat1flox/flox /LysMCre−/− (Acat1+M/+M) mice (Fig. 1B). To examine ACAT activity, peritoneal macrophages from Acat1−M/−M and Acat1+M/+M mice were obtained, and ACAT activities in these cells were quantified by measuring the cholesteryl ester synthesis rate in intact cells. To serve as a control, cells were treated with or without the ACAT inhibitor compound F12511 (16) at 5 μm as indicated. The result showed that ACAT activity in Acat1−M/−M macrophages was decreased by 90–95% compared with that in Acat1+M/+M macrophages (Fig. 1C, compare the first and third columns). Additional results showed that treating Acat1+M/+M macrophages with compound F12511 completely inhibited ACAT activity in these cells (Fig. 1C, compare the first and second columns). However, the same treatment of Acat1−M/−M macrophages did not seem to completely eliminate the residual ACAT activity present in these cells (Fig. 1C, compare the third and fourth columns). The significance of the latter observation is unknown at present. Additional analysis showed that the mRNA and protein expression of ACAT1 in Acat1−M/−M macrophages was decreased significantly (by at least 80%) compared with WT macrophages (Fig. 1, D and E). The Acat1−M/−M mouse does not exhibit dry eye syndrome as the Acat1−/− mouse does (Fig. 1F).
FIGURE 1.
Generation and characterization of a myeloid Acat1 KO (Acat1−M/−M) mouse model. A, constructs present in the Acat1 LoxP mouse and in the lysozymeM Cre+/+ mouse. The Acat1 LoxP mouse and the lysozyme M Cre+/+ (LysMCre+/+) mouse, described under “Experimental Procedures,” were crossed to obtain two mouse lines: Acat1flox/flox/LysMCre+/+ (Acat1−M/−M) and Acat1flox/flox/LysMCre−/−(Acat1+M/+M). B, genotyping of Acat1flox/flox mice (left panel) and of the Cre+/+ mice (right panel) by diagnostic PCRs. C, analysis of ACAT enzyme activity in peritoneal macrophages with or without treatment with an isotype-nonspecific ACAT inhibitor (compound F12511) (n = 3). D, analysis of Acat1 mRNA content (n = 3). E, analysis of ACAT1 protein content in macrophages and adrenal glands (n = 3). For Western blotting analysis, the anti-human ACAT1 polyclonal antibodies used were as described previously (16). The anti-actin antibodies were from Sigma. F, facial appearance of 6-week-old WT, Acat1−/−, and Acat1−M/−M mice. G, peripheral blood leukocyte number. WT, Acat1−/−, and Acat1−M/−M mice 8 weeks old with comparable numbers in males and females were used. Each circle represents a result from one animal (n = 13–21 mice/group). Results are reported as mean ± S.E. **, p < 0.01; ***, p < 0.001.
Acat1−M/−M Does Not Cause Leukocytosis in Normal Mice, nor Does It Cause Augmented Leukocytosis in Apoe−/− Mice
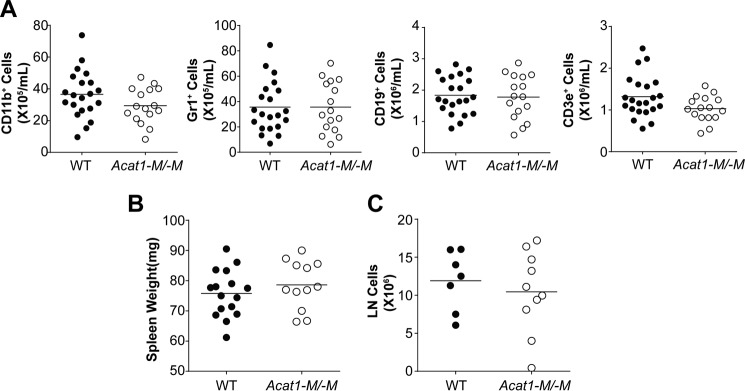
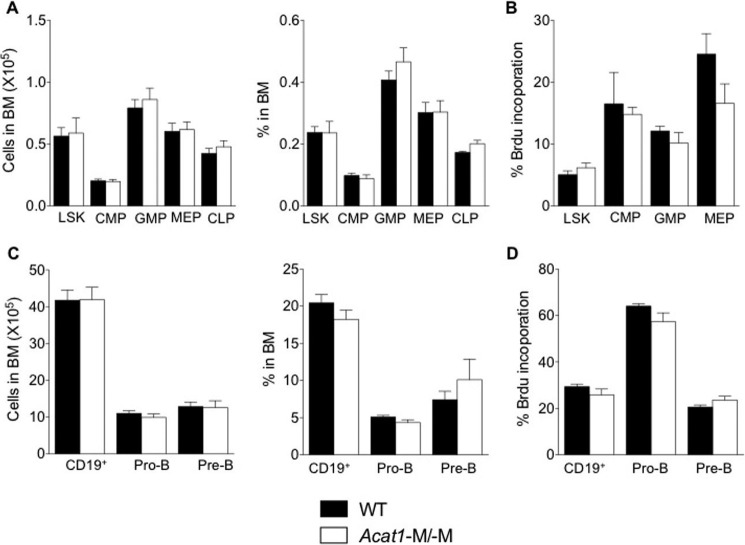
Bone marrow contains hematopoietic stem cells that give rise to cells in both the myeloid and the lymphoid lineages. These cell types are known to affect atherosclerosis at various stages. We have reported previously (11) that global Acat1−/− increased the proliferation rates of hematopoietic stem cells and altered their composition within the bone marrow, resulting in significantly higher numbers of myeloid cells in their blood. We also found that Acat1−/− increased the expression of interleukin 3 and interleukin 7 receptors in bone marrow cells, enabling these cells to proliferate more rapidly in response to interleukin 3/interleukin 7-mediated signaling (11). These results show that, to monitor the effects of Acat1−/− in monocytes/macrophages during atherosclerosis development, a better Acat1 KO model is needed. Here we asked whether Acat1−M/−M also leads to leukocytosis. The result showed that, in contrast to Acat1−/−, Acat1−M/−M does not cause leukocytosis (Figs. 1G and 2). Additional analyses show that, unlike Acat1−/− mice, Acat1−M/−M mice do not exhibit abnormalities in the following parameters: composition and proliferation rates of hematopoietic stem cells (Figs. 3 and 4), blood leukocyte composition and spleen weight (Fig. 2), and bone marrow cell expression of interleukin 3 and 7 receptors (Fig. 4).
FIGURE 2.
Acat1−M/−M mice do not display leukocytosis. Blood leukocytes were analyzed by flow cytometry. A, 2-month-old WT and Acat1−M/−M mice fed a chow diet with comparable numbers in males and females were used. Each circle represents a result from one animal. A, 21 WT and 16 Acat1−M/−M mice were used. B and C, spleen weight (B) and inguinal lymph node (LN, C) cell numbers from WT and Acat1−M/−M mice were compared. 7- to 9-week-old, age-matched WT and Acat1−M/−M mice with comparable numbers in males and females were used. The procedures used were as described under “Experimental Procedures.” Results are mean ± S.E. B, 16 WT and 12 Acat1−M/−M mice were used. C, 7 WT and 10 Acat1−M/−M mice were used.
FIGURE 3.
Acat1−M/−M does not affect proliferation of hematopoietic progenitor cells in BM. A, LSK, common myeloid progenitor (CMP), granulocyte/macrophage progenitor (GMP), megakaryocyte/erythrocyte-restricted progenitor (MEP), and common lymphoid progenitor (CLP) cells in BM were quantified by flow cytometry as described under “Experimental Procedures.” Results are reported as total number (left panel) and as percentage of total cells within the BM (right panel). 17 WT mice and 10 Acat1−M/−M mice were used for LSK, common myeloid progenitor, megakaryocyte/erythrocyte-restricted progenitor, and granulocyte/macrophage progenitor determinations. B, proliferation of various progenitors was quantified by using bromodeoxyuridine (BrdU) incorporation as described under “Experimental Procedures.” C, BM B (CD19+), pro-B (CD43+CD19+), and pre-B (CD43−CD19+IgM−) cells were measured as total cell number (left panel) and as percentage of total cells within the BM (right panel) as described under “Experimental Procedures.” Proliferation of B and B progenitor cells was quantified by bromodeoxyuridine. Results are reported as mean ± S.E. Mice fed a chow diet were analyzed when they were 2 months old.
FIGURE 4.
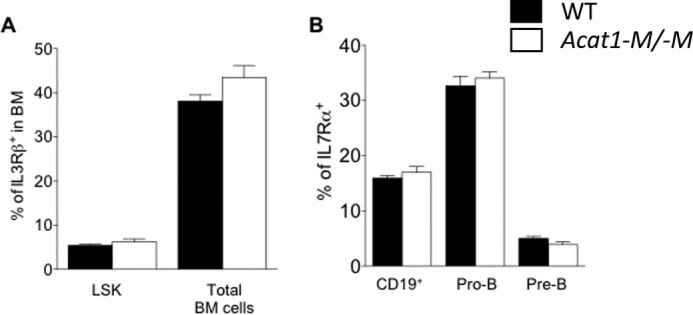
Acat1−M/−M does not affect IL3Rβ expression in LSK cells and IL7Rα expression in B cells and B progenitor cells. A and B, cell surface IL3Rβ (A) and IL7Rα (B) expression was monitored by flow cytometry using the same procedure as described previously (11). A, expression in LSK cells and in total BM cells, and in B and B progenitor cells as indicated. Results are from nine WT mice and nine Acat1−M/−M mice. Mice fed a chow diet were analyzed when they were 2 months old. Results are reported as mean ± S.E.
ApoE deficiency causes leukocytosis in mice and likely accelerates atherosclerosis (21). To test whether Acat1−/− and/or Acat1−M/−M augments leukocytosis in Apoe−/− mice, we fed Apoe−/−, Apoe−/−/Acat1−M/−M, and Apoe−/−/Acat1−/− mice a Western diet for 6 weeks and monitored peripheral blood leukocyte numbers and CD11b+Gr1+ myeloid cell numbers The results (Fig. 5, A–D) show that only Acat1−/−, but not Acat1−M/−M, further increased leukocytosis in Apoe−/− mice. Additional results show that Acat1−/−, but not Acat1−M/−M, increased the proliferation rate of primitive hematopoietic stem cells (LSK cells) (Fig. 5E). Additional results showed that neither Acat1−/− nor Acat1−M/−M affected apoptosis in LSK cells (Fig. 5F).
Acat1−M/−M Decreases the Plaque Area and Reduces Lesion Size in Apoe−/− Mice Fed a High-fat/High-cholesterol Diet
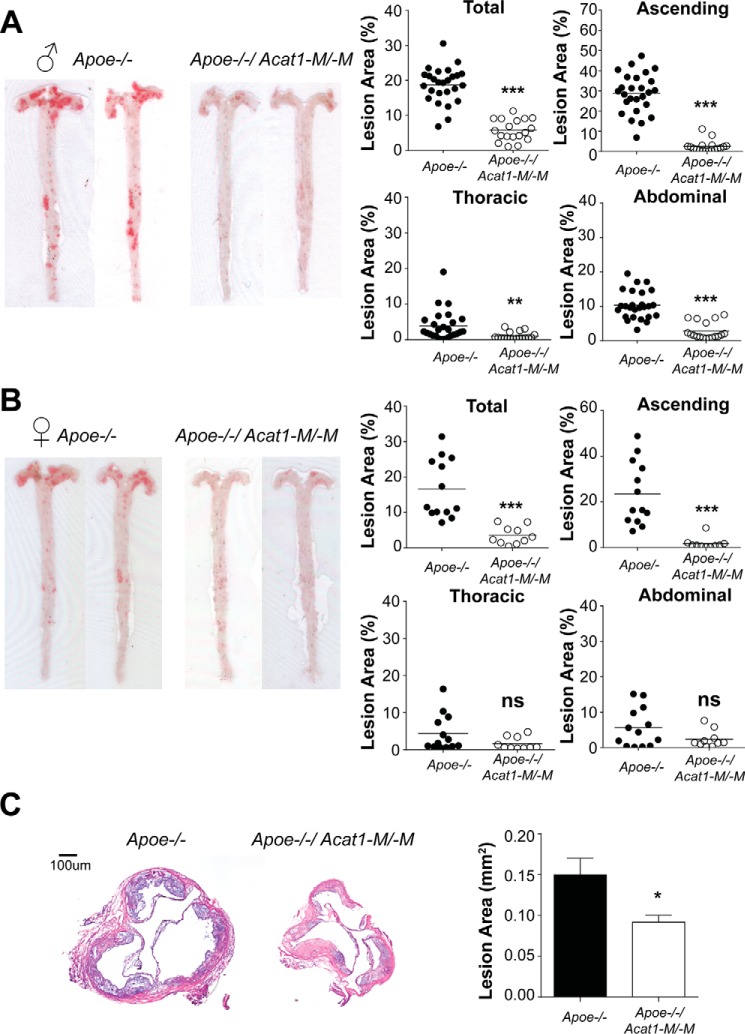
The results described above show that the Acat1−M/−M mouse is a more suitable model than the global Acat1−/− mouse to investigate the function of Acat1 specifically in macrophages in atherosclerosis. We fed Apoe−/−/Acat1−M/−M and Apoe−/−/Acat1+M/+M mice (age and sex-matched) a Western diet for 12 weeks. Afterward, the mice were euthanized. The aortas were isolated, stained with Sudan IV, and cut longitudinally for en face analysis. The results (Fig. 6) show that, for male mice, the percent total lesion area is decreased significantly in Apoe−/−/Acat1−M/−M mice compared with the value in Apoe−/− mice (5% versus 18%). Detailed analysis shows that Acat1−M/−M consistently caused significant decreases in percent lesion area in various regions of the aorta (ascending, thoracic, and abdominal) (Fig. 6A, right panels). In female mice, Acat1−M/−M also caused a significant decrease in percent total lesion area as well as in percent lesion area in the ascending region. However, for the thoracic and abdominal regions, the lesion areas in Apoe−/− mice were small, so the effect of Acat1−M/−M could not be quantified reliably (Fig. 6B, right panels). We also monitored lesion size from cross-sectional samples isolated from the aortic root. The result (Fig. 6C) shows that Acat1−M/−M caused a significant reduction in lesion size. Together, these results demonstrate that, in the Apoe−/− mouse, Acat1−M/−M reduces the plaque area and lesion size during atherosclerosis progression.
FIGURE 6.
Acat1−M/−M protects against atherosclerosis progression. A and B, mouse aortas stained with Sudan IV were cut longitudinally for en face preparation. Shown are representative images of (A) male and (B) female mice (left panels). Quantifications as percentage of plaque areas in different regions are as indicated (right panels) (n = 10–26 mice/group). C, lesion size analysis. Left panel, representative images of 10 μm cross-sections of aortic roots stained with hematoxylin. Right panel, quantification of results (n = 8–10 male mice/group). Horizontal bars represent mean values. * p < 0.05; **p < 0.01; ***p < 0.001; ns, not significant.
The Effect of Myeloid ACAT1 Deletion on Atherosclerotic Lesion Composition and Apoptosis
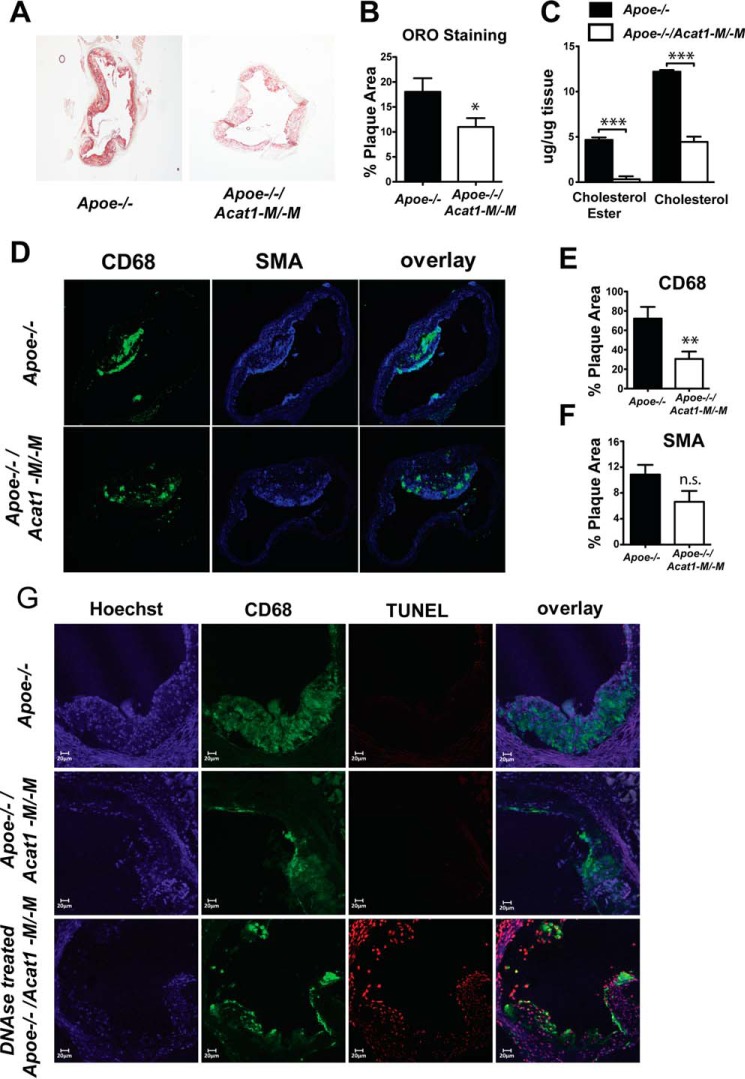
To further characterize the effect of depleting myeloid ACAT1 on atherosclerosis progression, we examined the aortic plaque lipid content in Apoe−/− and Apoe−/−/Acat1−M/−M mice fed a Western diet for 12 weeks. Oil Red O-stained aortic sections revealed that Apoe−/−/Acat1−M/−M mice accumulate less atheroma lipid compared with the Apoe−/− control (Fig. 7, A and B). Similarly, the levels of free cholesterol and cholesteryl esters extracted from whole aorta tissue of Apoe−/−/Acat1−M/−M mice were significantly lower than those of Apoe−/− mice (Fig. 7C). Taken together, these data suggest that knocking out Acat1 in myeloid cells results in reduced aortic lipid content. Interestingly, immunofluorescence microscopy revealed that Apoe−/− mice harboring ACAT1-null myeloid cells exhibited significantly less plaque macrophages, as demonstrated by a reduction in macrophage marker CD68-positive staining in the aortic intimal layer compared with that of Apoe−/− mice (Fig. 7, D and E). Lesion smooth muscle content, detected with an anti-α smooth muscle-specific actin antibody, was also analyzed by immunofluorescence. Quantification of the α smooth muscle actin-positive area in aortic cross sections showed that there is no significant difference in smooth muscle content between the two genotypes (Fig. 7, D and F). It has been speculated that inhibiting ACAT1 by genetic or pharmacological methods may benefit atherosclerosis because it may result in macrophage cell death, which leads to less plaque formation. To investigate whether a reduced macrophage presence within the aortic lesions of Apoe−/−/Acat1−M/−M is a result of increased macrophage apoptosis, we measured lesion apoptosis by double-staining with an anti-CD68 antibody and TUNEL. Cells positive for CD68 (red), TUNEL (green) and exhibiting a yellow color in the overlay microscopy image were depicted as TUNEL-positive macrophages. The result of the colocalization analysis shows that, compared with a positive control sample (DNase-treated lesion section, Fig. 7G, bottom panels), Apoe−/− and Apoe−/−/Acat1−M/−M mice on 12 weeks of a Western diet did not show detectable evidence for lesion cell death (Fig. 7G, first and second columns). This result is consistent with the work of Rong et al. (7), who demonstrated that partial pharmacological inhibition of ACAT1 and ACAT2 was beneficial for atherosclerosis and that ACAT inhibition was not associated with increased lesion cell death.
FIGURE 7.
Comparison of atherosclerotic lesions in Apoe−/− and Apoe−/−/Acat1−M/−M mice. A, Oil Red O (ORO)-stained aortic root sections from Apoe−/− and Apoe−/−/Acat1−M/−M mice fed a Western diet for 12 weeks. B, quantification of the lipid content shown in A. C, aortic free cholesterol and cholesterol ester content measured by a Wako colorimetric assay. D, immunofluorescence confocal microscopy analysis of lesion macrophages (CD68 as a marker) and smooth muscle cells (α smooth muscle actin (SMA) as a marker). E and F, quantitations of CD68 or α smooth muscle actin-positive areas detected per lesion area. G, TUNEL analysis of macrophage apoptotic cell death. * p < 0.05; **p < 0.01; ***p < 0.001; ns, not significant.
Acat1−M/−M Causes Decreased Appearance of Leukocytes at the Activated Endothelium in Vivo and Decreased Expression of Integrin β 1 (CD29) in Activated Inflammatory Monocytes in Vitro
The result described above (Fig. 7D) showed that, in atherosclerotic Apoe−/− mice, Acat1−M/−M caused fewer foamy macrophages within the lesion. Previously, others have reported that global Acat1 KO caused fewer foamy macrophages within the lesion; however, the cause for their observations remained unexplained (9, 10). Because we could not demonstrate significant macrophage cell death within lesions from Apoe−/− mice or the Apoe−/−/Acat1−M/−M mice (Fig. 7G), we hypothesized that the lack of Acat1 in monocytes/macrophages might retard the ability of inflammatory monocytes to move into the lesion area. To test this possibility, we first performed an in vivo leukocyte migration assay (18) to monitor the number of exogenously labeled leukocytes appearing at the aortas of atherosclerotic mouse. Chow-fed, 2-month-old male WT and Acat1−M/−M mice were used as blood leukocyte donors. Male Apoe−/− mice fed a Western diet for 8 weeks were used as leukocyte recipients. The results showed that, 16 h after injecting equal amounts of WT and Acat1−M/−M leukocytes into Apoe−/− mice, significantly fewer Acat1−M/−M leukocytes appeared at the aorta than WT leukocytes (Fig. 8A). The leukocytes used in the experiment described in Fig. 8A consisted mainly of monocytes/macrophages and neutrophil granulocytes. In the remainder of this work, we focused on monocytes/macrophages. In inflammatory monocytes, integrin β 1 (CD29), along with its heterodimeric partners (i.e. integrins α 1, α 3, α 4, etc.), is known play key roles in facilitating the interaction between monocytes and the activated endothelium (23). The result described in Fig. 8A led us to speculate that Acat1−M/−M might decrease the CD29 expression in monocytes. It is known that, during inflammation, monocytes, but not neutrophil granulocytes, express the specific antigen Ly6Chi at their cell surface (24). Therefore, to test this possibility, we isolated Ly6Chi-positive monocytes (the major subset of monocytes under inflammatory conditions) from the blood of Apoe−/− and Apoe−/−/Acat1−M/−M mice on a Western diet for 8 weeks and then quantitated the expression levels of CD29 and the monocyte cell surface marker CD11b by flow cytometry. The results show that, compared with Apoe−/− monocytes, the surface expression of CD29 was decreased significantly in Apoe−/−/Acat1−M/−M monocytes (Fig. 8C), whereas the expression of CD11b remained the same in these two cell types (Fig. 8D). The result of an additional control experiment showed that the total number of Ly6Chi monocytes in the blood is the same in Apoe−/− and Apoe−/−/Acat1−M/−M mice (Fig. 8B). This result suggests that Acat1 KO decreases integrin β 1 expression in inflammatory monocytes. To further investigate this finding, we asked whether the link between ACAT1 blockage and integrin β 1 expression could also be demonstrated in cultured macrophages in vitro. Previous studies showed that, in the mouse macrophage cell line RAW 264.7, the CD29 expression level was up-regulated in response to various inflammatory cytokines. Interestingly, treating RAW macrophage cells acutely with manganese ions (for 30 min) mimics the stimulatory effects of the cytokines (25). Here we show that treating RAW macrophages (maintained in medium without inflammatory stimulants) with the ACAT1-specific inhibitor K604 at 1 μm for 24 h, known to inhibit ACAT1 activity by more than 80% without inhibiting ACAT2 activity (8), did not cause any detectable change in CD29 expression (Fig. 9A). Adding manganese ions to cells not pretreated with the ACAT1 inhibitor significantly increased CD29 protein content. However, adding manganese ions to cells pretreated with the ACAT1 inhibitor failed to elicit the same stimulatory response (Fig. 9B). We performed similar experiments in peritoneal macrophages isolated from WT and Acat1−M/−M mice (Fig. 9C), from WT and global Acat1 KO mice (Fig. 9D), or from Apoe KO mice treated with or without the ACAT1 inhibitor K604 at 1 μm (Fig. 9E). The results consistently show that inhibiting ACAT1, either by gene KO or by small molecule inhibition, decreases CD29 expression in peritoneal macrophages activated by manganese ions (Fig. 9, C–E). Together, these results suggest that inhibiting ACAT1 enzyme activity decreases CD29 expression in inflammatory monocytes/macrophages when they are in an activated state. These results also show that the effect of ACAT1 inhibition on CD29 expression does not require the presence of the ApoE protein in macrophages.
FIGURE 8.
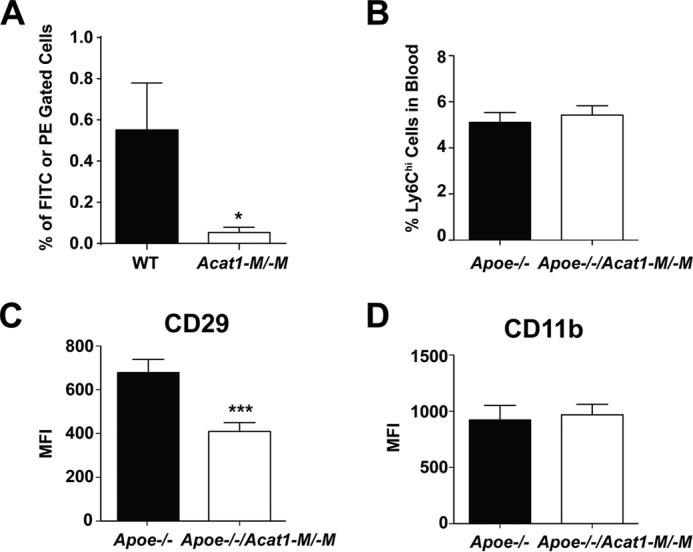
A, Acat1−M/−M retards leukocyte movement to the atherosclerotic endothelium. Chow-fed male WT and Acat1−M/−M mice 2 months old were employed as blood leukocyte donors. Male Apoe−/− mice fed a Western diet for 8 weeks were employed as leukocyte recipients. Blood leukocytes were withdrawn, sorted by CD11b antibody, and labeled with fluorescent dye (FITC) from a WT donor and with fluorescent dye (PE) from Acat1−M/−M donor as described under “Experimental Procedures.” After injecting equal numbers of mixed CD11b+ leukocytes from both genotypes intravenously for 16 h, mice aortas were collected, and cells from the aortas were extracted and analyzed by flow cytometry (n = 6 mice). The percentage of fluorescent FITC- or PE-labeled cells in the total amount of extracted aortic cells is plotted in the y axis. B, Acat1−M/−M does not alter the total number of Ly6Chi monocytes in the blood. C, Acat1−M/−M decreases the cell surface level of the key integrin β 1 in Ly6Chi monocytes. Ly6Chi monocytes were isolated from the blood of male Apoe−/− and Apoe−/−/Acat1−M/−M mice fed a Western diet for 8 weeks. Cell surface expression levels of integrin β 1 CD29 and the surface marker CD11b in these monocytes were quantified by flow cytometry (n = 20–25 mice/group). MFI, mean fluorescence intensity. Results are reported as mean ± S.E. *, p < 0.05; ***, p < 0.001.
FIGURE 9.
Inactivating ACAT1 by gene KO or by pharmacological inhibition decreases the integrin β 1 (CD29) level in manganese ion-activated macrophages. A and B, the effect of ACAT1 inhibition on CD29 expression level in RAW 264.7 mouse macrophage cells depends on manganese treatment. RAW 264.7 macrophages were plated in 6-well dishes in DMEM plus 10% fetal bovine serum and grown in the same medium. Cells in DMEM plus 10% fetal bovine serum were treated with 1 μm of an ACAT1-specific inhibitor (K604) and 0.02% ethanol or with 0.02% ethanol only for 24 h until ∼90–100% confluency. A, cells were harvested without manganese ion treatment. B, cells were rinsed twice with Hanks' buffer without calcium or magnesium ions and then incubated with the same buffer and 5 mm manganese ions for 30 min at 37 °C. Afterward, cells were harvested in radioimmune precipitation assay buffer with protease inhibitor mixture. The extracts were used for immunoblotting analysis using a mouse monoclonal antibody against CD29 (Santa Cruz Biotechnology, catalog no. sc-374429) to monitor CD29 expression. C–E, Acat1 KO or ACAT1 enzyme activity inhibition decreases CD29 expression in manganese-activated peritoneal macrophages. Peritoneal macrophages isolated from WT and Acat1−M/−M mice (C), WT and global Acat1−/− mice (D), or Apoe KO mice treated without or with 1 μm ACAT1-specific inhibitor K604 for 24 h (E) were subjected to manganese activation and then harvested for immunoblot analysis in the same manner as described in A and B. Quantitation of immunoblots was performed by ImageJ analysis. *, p < 0.05; ***, p < 0.001. E, p = 0.09.
Acat1−M/−M Exacerbates Cutaneous Xanthomatosis but Does Not Cause a Shortened Life Span in Hyperlipidemic Apoe−/− Mice
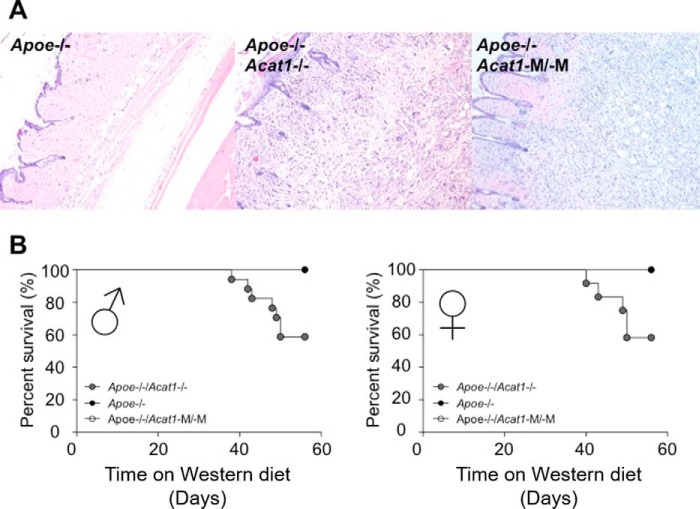
In Apoe−/− mice on a high-fat/high-cholesterol diet, Acat1−/− increase atherosclerotic lesions and exacerbates cutaneous xanthomatosis. Atherosclerosis involves the accumulation of foamy macrophages in the intima of the arterial wall, whereas xanthomatosis is caused by large accumulations of lipids in macrophage-like cells at the skin area. To test the involvement of macrophage ACAT1 in xanthomatosis, we fed Apoe−/−, Apoe−/−/Acat1−/−, and Apoe−/−/Acat1−M/−M mice a Western diet for 8 weeks and examined xanthomas after H&E staining. The results show (Fig. 10A) that xanthomas (characterized by the presence of abundant cholesterol crystals) are amply present in both Apoe−/−/Acat1−/− and Apoe−/−/Acat1−M/−M mice but not readily detectable in Apoe−/− mice. Additional analyses showed that xanthomas were absent from Acat1−/− mice or Acat1−M/−M mice (data not shown). Therefore, similar to Acat1−/−, Acat1−M/−M also exacerbates cutaneous xanthomatosis. When placed on a high-cholesterol/high-fat diet, Acat1−/− reduces the life span of Apoe−/− mice. We tested the effects of Acat1−M/−M versus Acat1−/− on the life span of Apoe−/− mice placed on a Western diet for various time periods as indicated. The results (Fig. 10B; left panel, male; right panel, female) show that only Acat1−/−, but not Acat1−M/−M,significantly shortens the life span of hyperlipidemic Apoe−/− mice. Together, these results show that, in Apoe−/−/Acat1−M/−M mice, xanthomatosis does not lead to augmented leukocytosis or a shortened life span.
FIGURE 10.
A, global or myeloid Acat1 deficiency exacerbates xanthoma in Apoe−/− mice. Hematoxylin and eosin staining of skin sections from male Apoe−/−, Apoe−/−/Acat1−/−, and Apoe−/−/Acat1−M/−M mice treated with a Western diet for 8 weeks was examined. The sections shown are representative of 4 sections/mouse, with 4–6 mice/genotype. B, Apoe−/−/Acat1−/− mice have a reduced survival rate on a Western diet. Survival curves of Apoe−/−, Apoe−/−/Acat1−/−, and Apoe−/−/Acat1−M/−M mice fed a Western diet over time, as indicated, were monitored. Mice were used when they reached 2 month of age. In each group, 17 Apoe−/−, 8 Apoe−/−/Acat1−/−, and 8 Apoe−/−/Acat1−M/−M male mice and 12 Apoe−/−, 8 Apoe−/−/Acat1−/−, and 8 Apoe−/−/Acat1−M/−M female mice were used. Results are mean ± S.E.
Food Intake, Weight Gain, and Serum Lipids of Mice Fed a Western Diet
We monitored the food intake of Apoe−/− and Apoe−/−/Acat1−M/−M mice on chow or a Western diet for various time periods as indicated and found no significant difference between the two genotypes (Fig. 11). We also monitored weight gain in Apoe−/−, Apoe−/−/Acat1−/−, and Apoe−/−/Acat1−M/−M mice on a Western diet for up to 8 weeks (Fig. 12). The result showed that, compared with Apoe−/− mice, the weight gain in Apoe−/−/Acat1−/− mice occurred faster from the third to the seventh week, but the mice dropped their weights in the eighth week. In contrast, Apoe−/−/Acat1−M/−M mice gained weight more slowly than Apoe−/− mice. The causes of the weight changes observed in Apoe−/−/Acat1−/− and Apoe−/−/Acat1−M/−M mice relative to Apoe−/− mice are currently unknown. As described earlier, both Apoe−/−/Acat1−/− and Apoe−/−/Acat1−M/−M mice, but not Apoe−/− mice, exhibited xanthomatosis (Fig. 10A). Xanthoma can lead to edema. The changes in weights observed (Fig. 12) may reflect the differences in the degree of swelling around the skin tissues of these two mouse genotypes. Further investigations are needed to clarify this issue.
FIGURE 11.
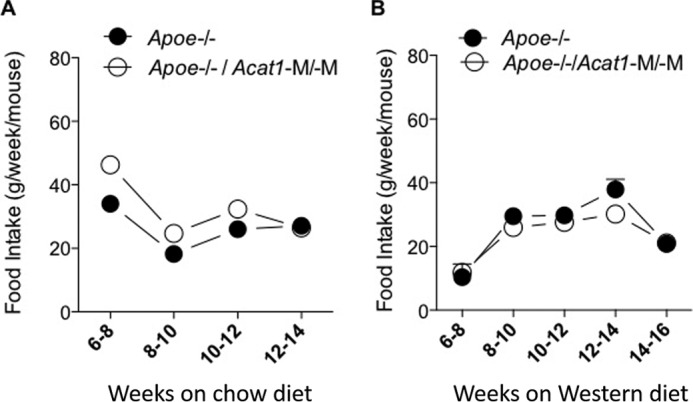
Comparison of Apoe−/− and Apoe−/−/Acat1−M/−M mice for food intake on a regular chow diet or Western diet. A and B, the food intake of male Apoe−/− and Apoe−/−/Acat1−M/−M mice fed a normal chow diet (A) and a Western diet (B) when they reached 2 months of age was measured according to the procedure described under “Experimental Procedures” at the indicated times (n = 4 mice/group). Values a reported as mean ± S.E.
FIGURE 12.
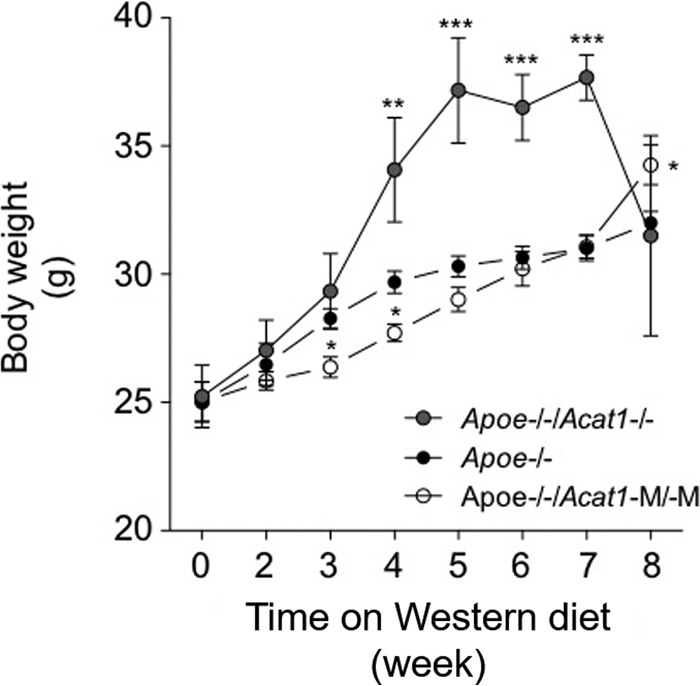
Comparison of changes in body weight of Apoe−/−, Apoe−/−/Acat1−/−, and Apoe−/−/Acat1−M/−M mice on a Western diet. The weights of male Apoe−/−, Apoe−/−/Acat1−/−, and Apoe−/−/Acat1−M/−M mice fed a Western diet when they reached 2 months of age were measured at the indicated times according to the procedure described under “Experimental Procedures.” 19 Apoe−/−, 13 Apoe−/−/Acat1−/−, and 8 Apoe−/−/Acat1−M/−M mice were used. Values are reported as mean ± S.E.
Discussion
In the Apoe−/− mouse model for atherosclerosis, Acat1−M/−M decreases the plaque area, reduces lesion size, and does not increase lesional cell death. Most interestingly, Acat1−M/−M also leads to less foamy macrophages in the lesion. To provide a mechanism for the latter finding, we performed a leukocyte migration assay in vivo and showed that lack of ACAT1 causes less leukocyte adherence at the activated endothelium. We also performed cell culture studies in vitro and showed that Acat1−M/−M causes decreased surface expression of integrin β 1 (CD29) in inflammatory monocytes, but only in an activated state. Our results suggests that the sparse presence of Acat1−/− macrophages in plaque is, at least in part, caused by the decreased surface expression of integrin CD29 in Acat1−/− monocytes, which weakens the interactions between monocytes and endothelial cells. The mechanism by which blocking of ACAT1 reduces the expression of CD29 in activated monocytes/macrophages is currently unknown. Studies using model cell lines have shown that, without cytokine/chemokine stimulation, the β1-bearing heterodimers located at the plasma membrane of monocytes stay at a low-affinity state. At a stimulated state, the integrin dimers become activated at the plasma membrane and undergo rapid endocytosis, lysosomal degradation, and recycling back to the plasma membrane (26, 27). We are currently testing whether ACAT1 blockage affects one or more of these processes. In addition, in the future, it would be interesting to test whether Acat1−/− alters the surface expression of other ligands that are also known to be involved in recruiting macrophages into plaques.
The Lys MCre technology used in this study is expected to delete Acat1 in all cells in the myeloid lineage (i.e. monocytes, macrophages, dendritic cells, neutrophil granulocytes, and eosinophils) at 80–95% efficiency. This work focused on the effect of Acat1 deletion in monocytes and macrophages (Figs. 1; 7; 8, B and C; and 9), and the results strongly suggest that depleting Acat1 in monocytes/macrophages contributes to the atherosclerosis resistance phenotype observed in Apoe−/−/Acat1−M/−M mice. In addition to monocytes, neutrophils are abundantly present in the blood. Because of their short life span, only a sparse amount of neutrophils can be found within an atherosclerotic lesion. However, emerging evidence implies that neutrophils play multiple roles in atherosclerosis, as reviewed in Ref. 28. Both dendritic and eosinophils are specialized immune cells present in the blood. Their roles in atherosclerosis remain largely unexplored. Further investigations are needed to investigate the effects of deleting Acat1 in other myeloid cells in atherosclerosis development.
Previous work has shown that, in hyperlipidemic mouse models, global Acat1−/− causes an increase in lesion size (9). Why global Acat1−/− failed to prevent atherosclerosis development is not clear at present; global Acat1 is expected to also diminish the presence of macrophages in atherosclerotic lesions. To offer one clue: unlike Acat1−M/−M, which only depletes cells in the myeloid lineage, global Acat1−/− is expected to delete Acat1 from all cells involved in the lesion progression process, including endothelial cells (which act as a barrier for the infiltration of various immune cells), activated T cells, and smooth muscle cells, etc., as reviewed in Ref. 22. In addition, global Acat1, but not Acat1−M/−M, causes augmented leukocytosis in apoe−/− mice. It is possible that deletion of Acat1 in endothelial cells and/or lymphoid cells coupled with augmented leukocytosis may cause enlargement of the lesion.
In addition to increasing lesion size and inducing augmented leukocytosis, Acat1−/− is associated with several additional undesirable phenotypes, including hair loss, dry eye, early lethality, and cutaneous xanthomatosis. Acat1−M/−M in hyperlipidemic Apoe−/− mice does not cause any of the undesirable phenotypes described above, with the exception that Acat1−M/−M also exacerbates xanthomatosis. The cellular mechanisms that lead to xanthomatosis are not well understood at present. To speculate why Acat1−M/−M decreases the plaque area/size while augmenting xanthomatosis: macrophages are derived from multiple cell lineages. Therefore, it seems plausible that, although most of the macrophages in the plaque originate from monocytes in the blood, the macrophages present in xanthoma may reside locally within the skin tissue. The interactions between monocytes and activated endothelium, which is a required step for atherogenesis, may not be part of the rate-limiting steps that produce xanthoma. This and other possibilities need to be investigated further in the future. Would inhibiting ACAT1 in macrophages produce xanthomas as a mechanistic side effect in patients affected by atherosclerosis? We think this is unlikely because blocking ACAT1 in myeloid cells (Acat1−M/−M) alone without Apoe deficiency does not cause xanthomatosis. In humans, xanthomatosis can only be observed in patients who genetically lack Apoe or the low-density lipoprotein receptor. Xanthomatosis also occurs in certain rare genetic diseases, but it has not been reported in patients who suffer from diet-induced atherosclerosis.
Our results suggest that, in a mouse model, targeting ACAT1 specifically in a myeloid lineage may benefit atherosclerosis progression by reducing the infiltration of foamy macrophages. Atherosclerotic plaques can be classified as initial, intermediate, and advanced lesions. Unlike initial and intermediate lesions, advanced lesions contain a much larger necrotic core and lipid-laden smooth muscle cells in addition to foamy macrophages. In the future, it will be interesting to examine the effects of Acat1−M/−M in mouse models for advanced lesions.
Author Contributions
T. Y. C. and C. C. Y. C. conceived and coordinated the study. L. H. H., E. M. M., H. L., and P. S. designed, performed, and analyzed the experiments. M. J. M. K. provided critical advice and assisted with plaque analyses. M. A.R. and S. N. F. participated in producing the Acat1flox/flox mice. W. F. H. and E. M. M. performed xanthoma analyses. T. Y. C., L. H. H., and E. M. M. wrote the paper with help from the other authors. All authors read and approved the final version of the manuscript.
Acknowledgments
We thank Drs. Dean Madden, Brent Berwin, Ching-Yi Tsai, Jingang Gui, and Tian Ma for advice and members of the Chang laboratory for helpful discussions.
This work was supported by National Institutes of Health Grant RO1-HL060306 (to T. Y. C. and C. C. Y. C.). The authors declare that they have no conflicts of interest with the contents of this article. The content is solely the responsibility of the authors and does not necessarily represent the official views of the National Institutes of Health.
- ACAT
- acyl-CoA:cholesterol acyltransferase
- BM
- bone marrow
- LSK
- Lin−Sca-1+c-Kit+.
References
- 1. Chang C. C., Huh H. Y., Cadigan K. M., and Chang T. Y. (1993) Molecular cloning and functional expression of human acyl-coenzyme A:cholesterol acyltransferase cDNA in mutant Chinese hamster ovary cells. J. Biol. Chem. 268, 20747–20755 [PubMed] [Google Scholar]
- 2. Cases S., Novak S., Zheng Y. W., Myers H. M., Lear S. R., Sande E., Welch C. B., Lusis A. J., Spencer T. A., Krause B. R., Erickson S. K., and Farese R. V. Jr. (1998) ACAT-2, a second mammalian acyl-CoA:cholesterol acyltransferase: its cloning, expression, and characterization. J. Biol. Chem. 273, 26755–26764 [DOI] [PubMed] [Google Scholar]
- 3. Anderson R. A., Joyce C., Davis M., Reagan J. W., Clark M., Shelness G. S., and Rudel L. L. (1998) Identification of a form of acyl-CoA:cholesterol acyltransferase specific to liver and intestine in nonhuman primates. J. Biol. Chem. 273, 26747–26754 [DOI] [PubMed] [Google Scholar]
- 4. Oelkers P., Behari A., Cromley D., Billheimer J. T., and Sturley S. L. (1998) Characterization of two human genes encoding acyl coenzyme A:cholesterol acyltransferase-related enzymes. J. Biol. Chem. 273, 26765–26771 [DOI] [PubMed] [Google Scholar]
- 5. Chang T. Y., Li B. L., Chang C. C., and Urano Y. (2009) Acyl-coenzyme A:cholesterol acyltransferases. Am. J. Physiol. Endocrinol. Metab. 297, E1–9 [DOI] [PMC free article] [PubMed] [Google Scholar]
- 6. Kusunoki J., Hansoty D. K., Aragane K., Fallon J. T., Badimon J. J., and Fisher E. A. (2001) Acyl-CoA:cholesterol acyltransferase inhibition reduces atherosclerosis in apolipoprotein E-deficient mice. Circulation 103, 2604–2609 [DOI] [PubMed] [Google Scholar]
- 7. Rong J. X., Blachford C., Feig J. E., Bander I., Mayne J., Kusunoki J., Miller C., Davis M., Wilson M., Dehn S., Thorp E., Tabas I., Taubman M. B., Rudel L. L., and Fisher E. A. (2013) ACAT inhibition reduces the progression of preexisting, advanced atherosclerotic mouse lesions without plaque or systemic toxicity. Arterioscler. Thromb. Vasc. Biol. 33, 4–12 [DOI] [PMC free article] [PubMed] [Google Scholar]
- 8. Ikenoya M., Yoshinaka Y., Kobayashi H., Kawamine K., Shibuya K., Sato F., Sawanobori K., Watanabe T., and Miyazaki A. (2007) A selective ACAT-1 inhibitor, K-604, suppresses fatty streak lesions in fat-fed hamsters without affecting plasma cholesterol levels. Atherosclerosis 191, 290–297 [DOI] [PubMed] [Google Scholar]
- 9. Accad M., Smith S. J., Newland D. L., Sanan D. A., King L. E. Jr., Linton M. F., Fazio S., and Farese R. V. Jr. (2000) Massive xanthomatosis and altered composition of atherosclerotic lesions in hyperlipidemic mice lacking acyl CoA:cholesterol acyltransferase 1. J. Clin. Invest. 105, 711–719 [DOI] [PMC free article] [PubMed] [Google Scholar]
- 10. Yagyu H., Kitamine T., Osuga J., Tozawa R., Chen Z., Kaji Y., Oka T., Perrey S., Tamura Y., Ohashi K., Okazaki H., Yahagi N., Shionoiri F., Iizuka Y., Harada K., Shimano H., Yamashita H., Gotoda T., Yamada N., and Ishibashi S. (2000) Absence of ACAT-1 attenuates atherosclerosis but causes dry eye and cutaneous xanthomatosis in mice with congenital hyperlipidemia. J. Biol. Chem. 275, 21324–21330 [DOI] [PubMed] [Google Scholar]
- 11. Huang L. H., Gui J., Artinger E., Craig R., Berwin B. L., Ernst P. A., Chang C. C., and Chang T. Y. (2013) Acat1 gene ablation in mice increases hematopoietic progenitor cell proliferation in bone marrow and causes leukocytosis. Arterioscler. Thromb. Vasc. Biol. 33, 2081–2087 [DOI] [PMC free article] [PubMed] [Google Scholar]
- 12. Clausen B. E., Burkhardt C., Reith W., Renkawitz R., and Förster I. (1999) Conditional gene targeting in macrophages and granulocytes using LysMcre mice. Transgenic Res. 8, 265–277 [DOI] [PubMed] [Google Scholar]
- 13. Guo Z. Y., Lin S., Heinen J. A., Chang C. C., and Chang T. Y. (2005) The active site His-460 of human acyl-coenzyme A:cholesterol acyltransferase 1 resides in a hitherto undisclosed transmembrane domain. J. Biol. Chem. 280, 37814–37826 [DOI] [PubMed] [Google Scholar]
- 14. Drinane M., Mollmark J., Zagorchev L., Moodie K., Sun B., Hall A., Shipman S., Morganelli P., Simons M., and Mulligan-Kehoe M. J. (2009) The antiangiogenic activity of rPAI-1(23) inhibits vasa vasorum and growth of atherosclerotic plaque. Circ. Res. 104, 337–345 [DOI] [PMC free article] [PubMed] [Google Scholar]
- 15. Sakashita N., Chang C. C., Lei X., Fujiwara Y., Takeya M., and Chang T. Y. (2010) Cholesterol loading in macrophages stimulates formation of ER-derived vesicles with elevated ACAT1 activity. J. Lipid Res. 51, 1263–1272 [DOI] [PMC free article] [PubMed] [Google Scholar]
- 16. Chang C. C., Sakashita N., Ornvold K., Lee O., Chang E. T., Dong R., Lin S., Lee C. Y., Strom S. C., Kashyap R., Fung J. J., Farese R. V. Jr., Patoiseau J. F., Delhon A., and Chang T. Y. (2000) Immunological quantitation and localization of ACAT-1 and ACAT-2 in human liver and small intestine. J. Biol. Chem. 275, 28083–28092 [DOI] [PubMed] [Google Scholar]
- 17. Chang C. C., and Chang T. Y. (1986) Cycloheximide sensitivity in regulation of acyl coenzyme A:cholesterol acyltransferase activity in Chinese hamster ovary cells: 2: effect of sterol endogenously synthesized. Biochemistry 25, 1700–1706 [DOI] [PubMed] [Google Scholar]
- 18. Shah Z., Kampfrath T., Deiuliis J. A., Zhong J., Pineda C., Ying Z., Xu X., Lu B., Moffatt-Bruce S., Durairaj R., Sun Q., Mihai G., Maiseyeu A., and Rajagopalan S. (2011) Long-term dipeptidyl-peptidase 4 inhibition reduces atherosclerosis and inflammation via effects on monocyte recruitment and chemotaxis. Circulation 124, 2338–2349 [DOI] [PMC free article] [PubMed] [Google Scholar]
- 19. Gaudreault N., Kumar N., Posada J. M., Stephens K. B., Reyes de Mochel N. S., Eberlé D., Olivas V. R., Kim R. Y., Harms M. J., Johnson S., Messina L. M., Rapp J. H., and Raffai R. L. (2012) ApoE suppresses atherosclerosis by reducing lipid accumulation in circulating monocytes and the expression of inflammatory molecules on monocytes and vascular endothelium. Arterioscler. Thromb. Vasc. Biol. 32, 264–272 [DOI] [PMC free article] [PubMed] [Google Scholar]
- 20. Mehlem A., Hagberg C. E., Muhl L., Eriksson U., and Falkevall A. (2013) Imaging of neutral lipids by Oil Red O for analyzing the metabolic status in health and disease. Nat. Protoc. 8, 1149–1154 [DOI] [PubMed] [Google Scholar]
- 21. Murphy A. J., Akhtari M., Tolani S., Pagler T., Bijl N., Kuo C. L., Wang M., Sanson M., Abramowicz S., Welch C., Bochem A. E., Kuivenhoven J. A., Yvan-Charvet L., and Tall A. R. (2011) ApoE regulates hematopoietic stem cell proliferation, monocytosis, and monocyte accumulation in atherosclerotic lesions in mice. J. Clin. Invest. 121, 4138–4149 [DOI] [PMC free article] [PubMed] [Google Scholar]
- 22. Bornfeldt K. E., and Tabas I. (2011) Insulin resistance, hyperglycemia, and atherosclerosis. Cell Metab. 14, 575–585 [DOI] [PMC free article] [PubMed] [Google Scholar]
- 23. Imhof B. A., and Aurrand-Lions M. (2004) Adhesion mechanisms regulating the migration of monocytes. Nat. Rev. Immunol. 4, 432–444 [DOI] [PubMed] [Google Scholar]
- 24. Dunay I. R., Fuchs A., and Sibley L. D. (2010) Inflammatory monocytes but not neutrophils are necessary to control infection with Toxoplasma gondii in mice. Infect. Immun. 78, 1564–1570 [DOI] [PMC free article] [PubMed] [Google Scholar]
- 25. Clahsen T., and Schaper F. (2008) Interleukin-6 acts in the fashion of a classical chemokine on monocytic cells by inducing integrin activation, cell adhesion, actin polymerization, chemotaxis, and transmigration. J. Leukocyte Biol. 84, 1521–1529 [DOI] [PubMed] [Google Scholar]
- 26. Böttcher R. T., Stremmel C., Meves A., Meyer H., Widmaier M., Tseng H. Y., and Fässler R. (2012) Sorting nexin 17 prevents lysosomal degradation of β1 integrins by binding to the β1-integrin tail. Nat. Cell Biol. 14, 584–592 [DOI] [PubMed] [Google Scholar]
- 27. Steinberg F., Heesom K. J., Bass M. D., and Cullen P. J. (2012) SNX17 protects integrins from degradation by sorting between lysosomal and recycling pathways. J. Cell Biol. 197, 219–230 [DOI] [PMC free article] [PubMed] [Google Scholar]
- 28. Soehnlein O. (2012) Multiple roles for neutrophils in atherosclerosis. Circ. Res. 110, 875–888 [DOI] [PubMed] [Google Scholar]


