

Abstract
Clinical trials using recombinant adeno-associated virus (rAAV) vectors have demonstrated efficacy and a good safety profile. Although the field is advancing quickly, vector analytics and harmonization of dosage units are still a limitation for commercialization. AAV reference standard materials (RSMs) can help ensure product safety by controlling the consistency of assays used to characterize rAAV stocks. The most widely utilized unit of vector dosing is based on the encapsidated vector genome. Quantitative polymerase chain reaction (qPCR) is now the most common method to titer vector genomes (vg); however, significant inter- and intralaboratory variations have been documented using this technique. Here, RSMs and rAAV stocks were titered on the basis of an inverted terminal repeats (ITRs) sequence-specific qPCR and we found an artificial increase in vg titers using a widely utilized approach. The PCR error was introduced by using single-cut linearized plasmid as the standard curve. This bias was eliminated using plasmid standards linearized just outside the ITR region on each end to facilitate the melting of the palindromic ITR sequences during PCR. This new “Free-ITR” qPCR delivers vg titers that are consistent with titers obtained with transgene-specific qPCR and could be used to normalize in-house product-specific AAV vector standards and controls to the rAAV RSMs. The free-ITR method, including well-characterized controls, will help to calibrate doses to compare preclinical and clinical data in the field.
Introduction
Recombinant adeno-associated virus (rAAV) vectors are among the most widely used viral vectors for gene therapy. Many years of preclinical research have preceded the success of rAAV in clinical trials for a handful of diseases, including hemophilia, retinal degeneration and neurological disorders.1–3 Moreover, the European Commission’s approval of an AAV vector-based gene therapy for the treatment of lipoprotein lipase deficiency4 has fueled the interest of pharmaceutical companies in the field.
Clinical dosing of rAAV therapeutics is usually based on vector genome (vg) titer (vector strength (vg/ml)), thus having accurate quality control methods that determine the amount of vector being administered is important. In order to calibrate therapeutic vector doses used by different investigators, the research community recognized the need for well-characterized rAAV reference standard materials (RSMs). The AAVRSM Working Group was established and committed to the development of two standards based on the rAAV serotype 2 and serotype 8 (AAV2RSM and AAV8RSM, respectively).5–7 Volunteer laboratories have produced and characterized these RSMs; the data have been published and they are accessible to the community through the American Type Culture Collection (ATCC, Manassas, VA)-LGC Standards (catalog numbers, VR-1616 and VR-1816). Mean titers and confidence intervals for the AAV2RSM and AAV8RSM were established for capsid particles, infection units and vector genomes.5,6
The most widely used method for quantification of packaged AAV vector genomes is the quantitative polymerase chain reaction (qPCR) assay that uses a calibration curve prepared with plasmid DNA as a reference.8 An accurate standard operating procedure (SOP) for vector genome titration based on qPCR was established by the AAVRSM working group and was sent to the testing laboratories together with the AAV2RSM and AAV8RSM. Surprisingly, despite this consensual SOP, the results of both studies have shown a large interlaboratory variability in PCR-based vector genome tittering that can account for almost 2-log variations.5,6 These differences could even be higher for therapeutic vectors if we consider that most of the laboratories use primers and probe specific for the therapeutic vector sequence. This creates a complex situation since there may be no transgene cassette sequences in common between a therapeutic vector sequence and the RSM, thus making it difficult to compare titers. Recently, a statement from US Food and Drug Administration encouraged the use of the RSMs as benchmarking tools for qualifying in-house reference materials and controls, and for demonstrating that assay methods are appropriately controlled.9 Similarly, the UK regulatory agency (NIBSC/Medicines and Healthcare Products Regulatory Agency) has published data showing the variability in vg titration and also recommended the use of RSMs.10
In 2012, Aurnhammer and colleagues established a molecular biological method that allows quantification of AAV serotype 2 (AAV2) genomes on the basis of qPCR targeting the inverted terminal repeat (ITR-2) sequence11 (from now on named “ITR2 qPCR”). Because this method can be used universally for all ITR2-based vectors (included in the vast majority of vectors used in the field), it could be of interest to use it as a standardized assay for vg titrations. However, we have compared vg titers obtained using the ITR2 qPCR with that obtained for qPCR assays utilizing primers and probes with binding sites located internally to the vector and we found systematically higher titers (up to eightfold) using the ITR2 qPCR protocol.
Therefore, the ITR2 qPCR method for vector genome quantification as described by Aurnhammer needs to be optimized to obtain vector genome titers that are accurate and comparable to each other. In the present study, we have optimized the ITR2 qPCR assay and showed that the artificial increase in vg titer can be eliminated by using plasmid standards linearized just outside the ITR region on each end to facilitate the melting of the palindromic ITR sequences during PCR (designated here as “Free-ITR” qPCR). This modification allows in-house reference standards to be reliably calibrated to the AAV RSMs.
In addition to vector genomes, the quantification of total capsid content is critical for clinical trials, since the AAV capsid triggers cytotoxic T lymphocytes-mediated immune responses.1,12 Despite the importance of this quantification there is no harmonized method for titration of total capsids and to distinguish empty particles from genome containing particles. Electronic microscopy, analytical ultracentrifugation, optical density, and enzyme-linked immunosorbent assay (ELISA) methods are available techniques for the quantification of empty/full particles, however, each method has their own limitations. We have shown that the utilization of commercial ELISA kits for the quantification of total particles results in relatively low inter-laboratory variations.6 Here, we provide a practical example of how the ELISA method and also the dot blot titration could be used as orthogonal methods for titration of rAAV stocks.
In summary, the practical examples of the utilization of RSMs described here provide guidelines for the use of these materials and can help the field to harmonize vector dosing units. More accurately determining vector strength (vg/ml) leads to accurate vector dosing and patient safety. Furthermore, since the ratio between vector genome titer and infectious titers (vg/IU) is a key parameter to evaluate vector quality, accurate titration of vector genomes by the Free-ITR PCR can enable better vector characterization.
Results
Overestimation of vector genome titer by ITR2 qPCR
Quantitative PCR is the most utilized method for tittering rAAV vector genomes, but selecting the target sequence within the therapeutic cassette is not simple. Significant variations of the vg titer have been reported both in single-stranded (ss) and self-complementary (sc) rAAV vectors depending on the target region chosen for qPCR.10,13,14 Here, we have used the ITR2 qPCR developed by Aurnhammer and colleagues to titer different rAAV stocks (including the AAV2RSM and AAV8RSM) and have compared the results with qPCR assays targeting the polyA or the cDNA sequences of the transgene cassette. As shown in Table 1, we have observed a systematic increase in vector genome titers using the ITR2 qPCR with linearized plasmid template used for standard curve samples, compared with other qPCR targets located internally within the vector. The slope obtained experimentally by qPCR (Transgene cassette/ITR2) was 0.2022 and below 0.4236 with 95% confidence intervals. Experimental slope obtained by linear regression was significantly different (P < 0.0001) to the theoretical slope of 1 if the cassette titration was equal to the ITR2 titration (Suppementary Figure S1). Thus, we concluded that the differences between the slopes (random sampling) were statistically significant.
Table 1. Titration of rAAV vector stocks and AAV RSMs using ITR2 or cassette (transgene or polyA) target sequences for qPCR.
| Sample ID | ITR2 qPCR (vg/ml) |
Expression cassette qPCR (transgene or pA) (vg/ml) |
Ratio ITR2/cassette | |
|---|---|---|---|---|
| Mean SD | Mean SD | |||
| AAVBAC028 | 5.60 ± 0.16 E+12 | 4.97 ± 3.3 E+12 |
1.13 | |
| AAVBAC016 | 6.88 ± 0.12 E+12 | 2.29 ± 0.78 E+12 |
3.00 | |
| Prod 12/2012 n°1 | 8.94 ± 2.06 E+12 | 6.77 ± 4.4 E+12 |
1.32 | |
| Prod 12/2012 n°2 | 9.45 ± 1.34 E+12 | 7.00 ± 4.9 E+12 |
1.35 | |
| AAVBAC017 | 1.03 ± 0.14 E+13 | 3.38 ± 0.92 E+12 |
3.06 | |
| AAVBAC010 | 1.14 ± 0.43 E+13 | 5.60 ± 3.08 E+12 |
2.04 | |
| AAVBAC040 | 1.15 ± 0.38 E+13 | 7.12 ± 2.18 E+12 |
1.62 | |
| BACTRANS002 | 1.33 ± 0.52 E+13 | 3.60 ± 1.33 E+12 |
3.69 | |
| AAVBAC009 | 1.67 ± 0.81 E+13 | 6.60 ± 2.42 E+12 |
2.53 | |
| BACTRANS003 | 2.66 ± 1.1 E+13 | 8.78 ± 0.63 E+12 |
3.03 | |
| Mean | 2.28 | |||
| AAV2RSM (lab1) | 1.68 ± 0.2 E+11 | 3.26 ± 0.2 E+10 |
5.10 | |
| AAV2RSM (lab2) | 1.50 ± 0.4 E+11 | 2.10 ± 0.6 E+10 |
7.10 | |
| Mean | 6.10 | |||
| AAV8RSM (lab1) | 1.93 ± 0.05 E+12 | 5.65 ± 0.09 E+11 |
3.40 | |
| AAV8RSM (lab2) | 1.30 ± 0.2 E+12 | 1.90 ± 0.5 E+11 |
6.80 | |
| Mean | 5.10 | |||
Titrations of RSMs were performed in two independent laboratoris (lab1, lab2). Mean ITR2/cassette ratios are indicated in bold letters for rAAV vector stocks, AAV2RSM, and AAV8RSM.
AAV, adeno-associated virus; ITR, inverted terminal repeats; RSM, reference standard materials; qPCR, quantitative polymerase chain reaction.
The average increase in vg titration using the ITR2 qPCR was confirmed using the AAV2RSM and AAV8RSM. Notably, titration of RSMs was carried out in two independent laboratories. Differences observed between laboratories could be due to multiple parameters, including the use of different qPCR machines (Step One plus from Life technologies versus LightCycler 480 from Roche), but all results consistently show an overestimation of vector titers using the ITR2 qPCR. Since the ITRs in the viral vector genome are found as free ends, we hypothesized that ITRs embedded in a plasmid backbone reduces the efficiency of qPCR and artificially inflates the titer of the rAAV vector product.
Plasmid standard curves show lower Cq upon release of the ends of the ITRs
Double-stranded plasmid DNA templates are used as standard curves to quantify (titer) the ssAAV viral vector DNA. We hypothesize that the ITRs in the double strand plasmid standard are not easily denatured during qPCR and this decreases hybridization of the ITR reverse primer. This would result in an apparently lower plasmid DNA standard copy number (as determined by the Cq values) resulting in a pseudo-high vg titer for the ssAAV viral vector DNA that has free ends. In order to confirm this hypothesis and to test the effect of providing free ends for the ITRs, psub201 plasmid DNA containing AAV-2 ITRs15 was prepared and tested in the ITR2 qPCR assay as a circular template or linearized by digesting with HindIII (one cut within the rep2 gene leaving the ITRs embedded in the plasmid backbone), Figure 1. Additionally, to create free ends for the ITRs, psub201 was digested with PvuII that cuts outside of both ITRs as shown in Figure 1a,b. Figure 1c shows the separation of these digested fragments on a 1% agarose gel. The concentration of these templates was determined by A260 using a nanophotometer (Implen) and shown in Figure 1d.
Figure 1.

Generation of free ends for the plasmid inverted terminal repeats (ITRs). (a) Schematic representation of the plasmid psub201 and the PvuII and HindIII restriction sites. (b) Magnification of the plasmid DNA sequences close to the PvuII digestion sites. pEMBL8(+) plasmid backbone (lower case); AAV2-sub201 viral genome (upper case) and PvuII site (CAG/CTG): underlined. (c) Separation of undigested and digested plasmid DNA on a 1% agarose gel; supercoiled and linear DNA ladder were used as electrophoresis standards. (d) Plasmid DNA purity and concentration measured by spectrophotometry.
To determine whether the structure of the plasmid DNA used to generate the standard curve affected viral vector genome copy number, we analyzed the differentially digested psub201 (HindIII and PvuII) and non-digested psub201 DNA in the ITR2 qPCR assay. A graph of the copy number of the circular, linear, and free-ITR plasmid DNAs as quantified by spectrophotometry was plotted against the quantification cycle (Cq) values obtained in the qPCR assay (Figure 2; n = 3). The Cq values obtained for 1e8 copies of psub201/PvuII were significantly lower (12.42 ± 0.04) than those obtained for either the linearized or uncut plasmids (15.26 ± 0.06 and 16.80 ± 0.12). These data confirm that the higher titer obtained for rAAV viral vectors using the ITR2 qPCR are a result of an early depressed amplification round for linear or circular plasmid standard curves (with ITRs embedded in the plasmid backbone) resulting in lower standard curve copy number, and apparent higher viral vector titer values.
Figure 2.
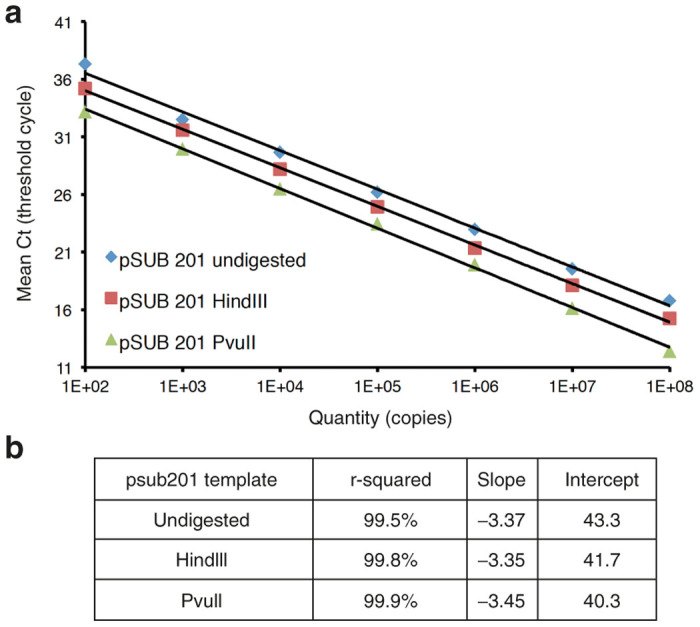
ITR2 quantitative polymerase chain reaction (qPCR) using psub201 plasmid undigested, linearized with HindIII, or digested with PvuII to create inverted terminal repeats (ITRs) with free ends. (a) The differences between mean quantification cycles (Cq) obtained in each experimental condition with an equal amount of plasmid quantified by spectrophotometry are shown. (b) r-square, slope, and intersection values of the qPCR tests shown in a).
Copy number estimation of a non-ITR target
In order to confirm that the difference observed was specific to the ITR2 qPCR and not an artifact of the plasmid templates, the same psub201 templates (uncut, linearized (HindIII) and Free-ITR end (PvuII)) were used in a rep2-specific qPCR assay that detects the AAV rep gene in psub201. The mean Cq values (n = 3) obtained at each concentration of plasmid for the three standard curves (undigested, linear (HindIII digested and PvuII digested)) were plotted versus copy number as shown in Figure 3. The Cq values at each concentration for the linearized and free-end templates were very similar (mean Cq value for 1e8 copies was 12.49 ± 0.19) contrary to the Cq value obtained with the circular plasmid DNA template (mean Cq value for 1e8 copies was 13.56 ± 0.12). This confirms that a difference in plasmid template concentration as determined by spectrophotometry is not responsible for the dramatic difference in Cq values obtained in the ITR2 qPCR assay.
Figure 3.
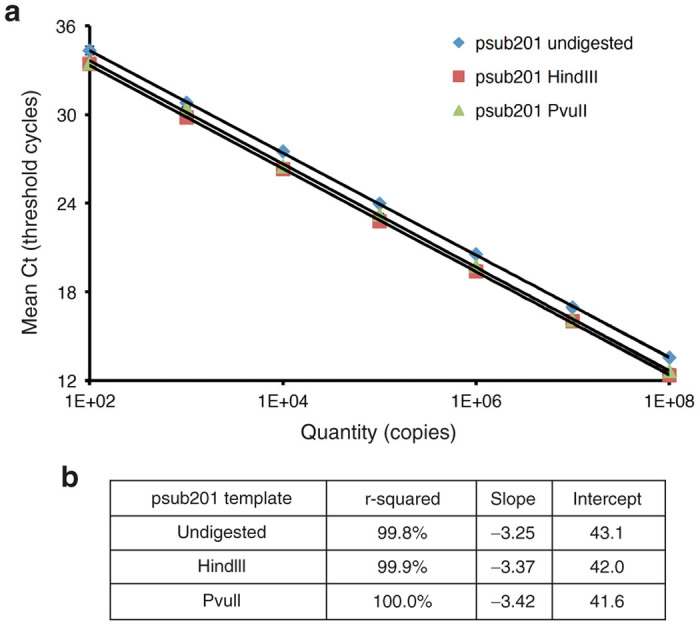
Quantitative polymerase chain reaction (qPCR) targeting the rep sequence using pSub201 plasmid undigested, linearized with HindIII, or digested with PvuII to create inverted terminal repeats with free ends. (a) The minimal differences observed between mean quantification cycles (Cq) obtained in each experimental condition indicate that the DNA concentrations determined by spectrophotometry are similar. (b) r-square, slope, and intersection values of the qPCR tests shown in a.
Vector genome titer obtained in the Free-ITR assay using the psub201/PvuII digested template as the standard is within range of the transgene cassette qPCR
The vg titers obtained by the ITR2 qPCR assay were compared using either a psub201/Pvu II digested or psub201/HindIII digested template to that obtained in a vector transgene-specific (SV40 polyA; pTR-UF11/XmnI digested) qPCR assay. We tested the rAAV2 and rAAV8 RSMs using these standard curves (Table 2). The assay was performed in three independent runs; each run was done in triplicate and the mean and standard deviations from all three runs are reported in Table 2. For both RSMs, a three- to fourfold increase in vg titer was obtained when the ITR2 qPCR was performed using linearized psub201 (psub201/HindII) as standard compared to the data obtained for the transgene cassette-specific qPCR titer (SV40 polyA) (4.2 ± 1.1 fold change for AAV2RSM and 3.2 ± 0.7 fold change for AAV8RSM). On the other hand, Free-ITR qPCR carried out with psub201/PvuII as a standard yielded very similar titers to those obtained using SV40 polyA qPCR (1.07 ± 0.1 fold change for AAV2RSM and 1.3 ± 0.1 fold change for AAV8RSM). These data confirm that Free-ITR ends are essential for efficient ITR2 qPCR; and the corresponding determination of vg titer.
Table 2. Titration of AAV RSMs using ITR2 or target sequences specific to sample.
| Sample | Template | Run 1 (vg/ml) | Run 2 (vg/ml) | Run 3 (vg/ml) | Average (vg/ml) | ||||||
|---|---|---|---|---|---|---|---|---|---|---|---|
| AAV2 RSM (published range for SV40 pA: 2.70E+10 to 4.75E+10 vg/ml; 95% CI) | ITR2 psub201/HindIII |
1.42 ± 0.09 E+11 |
1.68 ± 0.17 E+11 |
1.53 ± 0.30 E+11 | 1.54 ± 0.19 E+11 (P < 0.001) | ||||||
| Free ITR psub201/PvuII |
3.83 ± 0.15 E+10 |
3.70 ± 0.11 E+10 |
4.21 ± 0.17 E+10 | 3.91 ± 0.14 E+10 (N.S.) | |||||||
| Target: SV40 polyA pTR-UF11 |
4.27 ± 0.42 E+10 |
3.00 ± 0.28 E+10 |
3.88 ± 0.42 E+10 | 3.72 ± 0.37 E+10 | |||||||
| AAV8 RSM (published range for SV40 pA: 3.05E+11 to 1.09E+12 vg/ml; 95% CI) | ITR2 psub201/HindIII |
7.92 ± 0.73 E+11 |
6.87 ± 0.45 E+11 |
7.41 ± 0.24 E+11 | 7.40 ± 0.47 E+11 (P < 0.001) | ||||||
| Free ITR psub201/PvuII |
1.96 ± 0.05 E+11 |
1.42 ± 0.13 E+11 |
1.75 ± 0.27 E+11 | 1.71 ± 0.15 E+11 (N.S.) | |||||||
| Target: SV40 polyA pTR-UF11 |
2.77 ± 0.48 E+11 |
1.69 ± 0.31 E+11 |
2.69 ± 0.60 E+11 | 2.38 ± 0.46 E+11 | |||||||
| Template |
Run 1 |
Run 2 |
Run 3 |
||||||||
| r-squared | Slope | Efficiency | r-squared | Slope | Efficiency | r-squared | Slope | Efficiency | |||
| ITR2 psub201/HindIII | 99.9% | −3.30 | 100.5% | 99.9% | −3.26 | 101.4% | 99.6% | −3.36 | 99.3% | ||
| Free ITR psub201/PvuII | 99.9% | −3.47 | 97.0% | 99.9% | −3.26 | 101.4% | 99.3% | −3.06 | 106.2% | ||
| Target: SV40 polyA pTR-UF11 | 99.5% | −3.16 | 103.50% | 99.6% | −3.20 | 102.80% | 99.7% | −3.19 | 102.80% | ||
ITR2 qPCR was performed using linearized plasmid (psub201/HindIII) or double digested plasmid with free ends at ITR sequences (psub201/PvuII) as standard curve. The standard deviations listed for AAV RSMs in each run is from three replicate samples. P values were calculated between ITR2 and free ITR versus SV40 and considered statistically significant when P < 0.05.
AAV, adeno-associated virus; ITR, inverted terminal repeats; N.S., nonsignificant; RSM, reference standard materials; qPCR, quantitative polymerase chain reaction.
Next, we used the ITR2 qPCR and the optimized “Free-ITR” qPCR to titer two internal controls (IC) that are currently used in our laboratory. Extensive titration of these vectors using targets specific to the transgene cassette allowed us to define a range of titers for each of the ICs. The assay was performed in three independent runs, and the mean and standard deviations from all three runs are reported in Table 3. The ITR2 qPCR titration generated titers that were significantly higher than the expected range, but the Free-ITR method provided titers that were consistent with the expected range of titers obtained with the transgene cassette green fluorescent protein (GFP)-specific probes and primers (Table 3).
Table 3. Titration of IC using ITR2 or target sequences specific to sample.
| Sample | Template | Run 1 (vg/ml) | Run 2 (vg/ml) | Run 3 (vg/ml) | Average (vg/ml) | ||||||
|---|---|---|---|---|---|---|---|---|---|---|---|
| IC1: AAV2/5-GFP | ITR2 psub201/HindIII |
7.53 ± 1.84 E+13 |
6.66 ± 2.02 E+13 |
1.26 ± 0.46 E+14 | 8.93 ± 1.44 E+13 (P = 0.06) | ||||||
| Free ITR psub201/PvuII |
8.29 ± 1.88 E+12 |
1.57 ± 0.31 E+13 |
2.77 ± 0.54 E+13 | 1.72 ± 0.91 E+13 (N.S) | |||||||
| Target: GFP pFBGR |
1.64 ± 0.15 E+13 |
2.28 ± 0.21 E+13 |
2.37 ± 0.28 E+13 | 2.10 ± 0.21 E+13 | |||||||
| IC2: AAV2/6-GFP | ITR2 psub201/HindIII |
1.40 ± 0.55 E+14 |
1.43 ± 0.26 E+14 |
1.08 ± 0.54 E+14 | 1.30 ± 0.45 E+14 (P < 0.05) | ||||||
| Free ITR psub201/PvuII |
1.68 ± 0.25 E+13 |
2.96 ± 0.54 E+13 |
2.90 ± 0.77 E+13 | 2.51 ± 0.52 E+13 (N.S) | |||||||
| Target: GFP pFBGR |
2.14 ± 0.31 E+13 |
2.12 ± 0.25 E+13 |
1.93 ± 0.27 E+13 | 2.06 ± 0.28 E+13 | |||||||
| Template |
Run 1 |
Run 2 |
Run 3 |
||||||||
| r-squared | Slope | Efficiency | r-squared | Slope | Efficiency | r-squared | Slope | Efficiency | |||
| ITR2 psub201/HindIII | 99.8% | -3.04 | 107.0% | 98.2% | -3.03 | 106.9% | 99.9% | -3.28 | 96.3% | ||
| Free ITR psub201/PvuII | 99.2% | -3.33 | 99.9% | 99.1% | -3.42 | 98.0% | 100.9% | -3.51 | 96.3% | ||
| Target: GFP pFBGR | 99.9% | -3.63 | 94.4% | 99.8% | -3.65 | 94.0% | 99.9% | -3.54 | 95.8% | ||
ITR2 qPCR was performed using linearized plasmid (psub201/HindIII) or double digested plasmid with free ends at ITR sequences (psub201/PvuII) as standard curve. The standard deviations listed for Internal Controls in each run is from different dilutions of the same sample. P values were calculated between ITR2 and free ITR versus GFP and considered statistically significant when P < 0.05.
AAV, adeno-associated virus; GFP, green fluorescent protein; IC, internal controls; ITR, inverted terminal repeats; N.S., nonsignificant; qPCR, quantitative polymerase chain reaction.
Discrepancy between DNA-containing particles and total particles titers quantified by ITR2 qPCR and ELISA, respectively
The characterization of the AAV8 RSM has shown that capsid titration using a commercial ELISA kit results in relatively low interlaboratory variation, thus being a viable method for routine analysis. Here, we have generated a rAAV8 in-house rAAV viral control vector (IC 5975) containing the same genome as the RSM (manufactured using the pTR-UF11 plasmid) and have quantified its capsid titer by ELISA using the AAV8RSM as a comparator. The capsid titers of the AAV8RSM that we obtained here were in agreement with published values6 and titers of our IC are reported in Table 4. In parallel, we tittered vector genomes of both stocks using the ITR2 qPCR and the free-ITR method. A discrepancy was observed between the vg titer obtained with the ITR2 qPCR and total capsid titer measured by ELISA, since the amount of vector genomes was higher than the total particle titer which is difficult to explain in terms of viral biology. On the other hand, the vg titers determined using the Free-ITR were similar to the particle titers; this is consistent with the CsCl gradient purification protocol used in the production of both vectors that allows enrichment of full particles.16 As a secondary orthogonal method, we used dot blot hybridization and we obtained a titer of 5.6 E11 vg/ml for AAV8RSM and 9.6 E12 vg/ml for IC5975, being these titers closer to Free-ITR titers than ITR2 qPCR titers (Table 4).
Table 4. Comparison of total capsid particle titer and vector genome titer.
| Sample ID | ELISA titer (cp/ml) | ITR2 qPCR (vg/ml) | Free ITR (vg/ml) | Dot blot (vg/ml) |
|---|---|---|---|---|
| AAV8RSM | 5.55 ± 2.79 E+11 | 2.65 ± 0.84 E+12 | 5.65 ± 1.75 E+11 | 5.65 ± 1.48 E+11 |
| IC 5975 | 1.67 ± 0.37 E+13 | 5.01 ± 1.89 E+13 | 1.05 ± 0.38 E+13 | 9.63 ± 2.9 E+12 |
Total capsid particle (cp) titer was determined by an AAV8-specific ELISA, whereas vector genome titers were quantified by qPCR, using the ITR2 qPCR or the free-ITR qPCR, and dot blot. Values are shown as mean ± SD (n = 3–8).
AAV, adeno-associated virus; ITR, inverted terminal repeats; N.S., nonsignificant; RSM, reference standard materials; qPCR, quantitative polymerase chain reaction.
Taken together, these data support our previous findings suggesting that ITR2 qPCR overestimates vg titers, and also highlight the importance of using orthogonal methods for quality control of rAAV stocks, with a more accurate measurement of vector quality, i.e., the ratio between vector genomes/total capsids.
Titration of rAAV genomes carrying the ITRs from serotype 5 using the Free-ITR assay
The vast majority of rAAV in preclinical and clinical trials uses the ITR sequences from AAV serotype 2. However, it is likely in the future that ITRs from alternative AAV serotypes could be utilized. In order to anticipate this scenario, here we have designed a new qPCR reaction targeting the ITR from AAV serotype 5 following a similar strategy as the one used for the ITR2 (Figure 4a). In addition, we have used a reference plasmid (named pAAVPGK) harboring the ITR5 that could be digested by KpnI close to the ITR sequences to provide the free ends for the qPCR reaction. We analyzed the differentially digested pAAVPGK (linearized, ScaI versus free-ends, KpnI) in the ITR5 qPCR assay. A graph of the copy number of the linear and Free-ITR plasmid DNAs as quantified by spectrophotometry was plotted against the quantification cycle (Cq) values obtained in the qPCR assay (Figure 4b,c). As already shown in Figures 2 and 3 and Tables 2 and 3 for the ITR2, here the differences in Cq values in those two conditions led to a significantly different vector genome titrations of AAV5 vectors (Figure 4d). These data confirm apparent higher viral vector titers using linearized plasmid compared to the use of Free-ITR methodology.
Figure 4.

Design of AAV5 inverted terminal repeats (ITR) quantitative polymerase chain reaction (qPCR). (a) Top: 5’ ITR secondary hairpin structure of wild-type AAV5 and localization of the AAV5 ITR qPCR-specific primers and probe. Bottom: Corresponding 71-bp PCR product. (b) ITR5 qPCR using pAAVPGK plasmid linearized with ScaI, or digested with KpnI to create ITRs with free ends. The differences between mean quantification cycles (Cq) obtained in each experimental condition with an equal amount of plasmid quantified by spectrophotometry are shown. (c) r-square, slope, and intersection values of the qPCR tests shown in a. (d) Titration of an rAAV5 vector sample using the two different linearized plasmids (ITR5 versus free-ITR5). The mean and standard deviations listed for rAAV5 vectors are from four different dilutions of the samples. *P < 0.05.
Discussion
Recombinant AAV vectors are widely used in clinical trials, but it is recognized that each therapeutic vector is unique and dosing is vector-specific (capsid serotype, transcription promoter, transgene codon optimization, etc), organ target-specific, and disease-specific, in the context of its safety profile and therapeutic potency. Hence, accurate titration of rAAV vector genome copies is critical for ensuring correct and reproducible dosing in both preclinical and clinical settings, since genome copy numbers are universally used for dosing purposes. Dot-blot hybridization techniques have been largely used to titer vg in the past,15 but thanks to the sensitivity, specificity, and ability to standardize the qPCR technique;8 it is the reference method for determining vector strength (vg/ml) in most of the laboratories producing and characterizing rAAV vectors today. Unfortunately, high intra- and interlaboratory variations have been observed in qPCR-based rAAV titrations.5,6 Multiple sources of qPCR variability can be listed, including the preparation of the plasmid DNA standard curve (circular versus linearized),17 type of probe used in the qPCR assay (Taqman versus LNA versus SYBR), type of real-time PCR machine (compatibility with fluorescent dyes used with probes and quenchers), master mix, pipetman type and calibration, pipette tip type (siliconized vs natural), pipetting techniques, chemical purity and homogeneity of length of primers and probes, spectrophotometry used to quantify DNA stocks, and removal of inhibitors. Also, the type of vector genome plays an important role as shown by Fagone and collaborators with scAAV; in this case, it was necessary to use restriction enzymes to remove the ITR from the vector to obtain an accurate titer.13 Absolute quantification of rAAV vector genomes by droplet digital PCR can avoid the variability associated with a standard curve,18 but seems to be less sensitive than qPCR and is affected by the DNA structure.19 Recently, a PCR-independent rAAV titration method based on the quantitation of encapsidated DNA with the fluorescent dye PicoGreen(R) has been published.20 According to the authors, the PicoGreen-based assay has less intra- and interassay variability compared with Dot-Blot or qPCR. However, PicoGreen cannot distinguish between vector genomes and residual DNA, thus vg titers using this dye method might be overestimated in those preparations where the residual DNA is prominent. A major problem of all techniques is the lack of harmonization and utilization of standards, but it is unrealistic to expect that different laboratories will use the same vg titration method.
AAV RSMs were generated to help the community to develop a common vector dosage unit (or at least be able to convert to the common dosage unit), but RSMs are limited in quantity, and are intended to calibrate a laboratory’s internal product-specific reference s`tandards. In-house standards should be generated and characterized for routine use in assay qualification and testing, and replenished as needed. Here, we show how internal product-specific control vectors can be compared to the RSMs in terms of vg units using Free-ITR qPCR. By providing free ends for the ITRs in the plasmid standard DNA we eliminated the artificial increase in the viral vg titer seen when utilizing the original ITR2 qPCR, and the vg titers using the Free-ITR qPCR were similar to the vg titers obtained using internal expression cassette-specific qPCR. Although the AAV2RSM and AAV8RSM are publicly available and consensus titers have been published, it is not possible to use the original SOPs for the titration of all therapeutic vectors because the selected qPCR target sequence (SV40 polyA) is not present in most of the therapeutic vectors. Here, we propose to advance toward harmonization and we encourage that the expression cassette-specific titer be reported to the regulatory agencies and in the literature using in-house vg units and in relative RSM vg units that can be used for making comparisons of dosing of different vectors. This may involve a two-step process: (i) perform an RSM vg titer using the harmonized SV40 polyA qPCR to obtain an in-house RSM titer that could be compared to the consensus titer; this step could help to identify a bias in the methodology, equipment or materials used for the titration, (ii) perform the Free-ITR qPCR described here for both for the RSM and the therapeutic vector; the relative titer of the therapeutic vector vs the RSM using common units (ITR) will help the regulatory authorities and the scientific community to better compare the titers from different laboratories. The use of a unique plasmid containing common elements to the RSM and therapeutic-vector (for instance; free-ITRs, SV40 polyA and the therapeutic-specific target sequence) could help to reduce variability in qPCR titrations avoiding multiple standard curves for each qPCR assay. To facilitate comparisons, it is highly recommended that reports including qPCR data follow the MIQE guidelines to reinforce reproducibility of the results.21 We acknowledge that significant interlaboratory variability was detected during the characterization of RSMs. However, we believe that this is not a problem specific to RSMs but rather a major concern affecting the accurate tittering of all types of rAAV vectors in the field. Such variations makes difficult to compare preclinical and clinical data issued from different laboratories. The implementation of the Free-ITR method together with the use of RSMs will not solve all interlaboratory problems of precision at once. However, if the titer of RSM obtained with the Free-ITR method is significantly different to the consensus titer it means that sources of variation exist in a given laboratory. As a consequence, the laboratory could investigate each possible variable affecting the qPCR titer and, eventually, identify the main source of the variation. Since the Free-ITR method can be applied to both RSMs and the therapeutic vector, it is encouraged to include this data in regulatory submissions. This additional data will help the scientific community and the regulatory authorities to work toward harmonization.
Nonetheless, the Free-ITR qPCR has its own limitations. The vast majority of therapeutic vectors harbor the ITR sequences from AAV serotype 2, but ITRs from other serotypes could be used and tested in the future. Here, we demonstrated that a novel qPCR specific for the distantly related ITR sequences from AAV serotype 5 and the Free-ITR methodology produced consistent results compared with Free-ITR method for ITR2, thus validating this approach for a general use with ITRs from other AAV serotypes. Also, the ITR sequences are prone to recombination, mutation or truncation, and most of the times these modifications do not apparently alter vector production. In order to accurately use the Free-ITR method, it is recommended to ensure the integrity of the ITR target sequence both in the plasmid used for the standard curve and in the rAAV genome itself. Here, we have sequenced the ITRs from the AAV2RSM and AAV8RSM using Illumina technology. No variants were observed in the ITR sequences confirming the integrity of the target sequence and legitimate the use of RSMs as controls for ITR-based analytical techniques.
The absolute quantification of capsids found in a rAAV preparations is useful for product characterization, in particular since rAAV capsids play an important role in immunological responses.1,22–24 We showed that ELISA methods can be used for capsid titration and relatively low variations were observed between laboratories, partly because the commercial kit provides the reagents and internal controls. In the present work, we showed an example of how an in-house rAAV viral vector control (IC) can be titered by ELISA and Free-ITR using the RSM as a benchmark. As soon as the IC is compared to RSM using these techniques, it can be used as a reference for other orthogonal methods, such as electronic microscopy, analytical ultracentrifugation, and optical density. Alternative methods to ELISA are also welcome, because there are significant limitations of the capsid ELISA including the fact that such commercially available kits are not “validated” and may vary over time due to, e.g., the need to replace the standard material from time to time. Also, a general limitation is that different mAbs are required for different serotypes. Thus, while the generic free-ITR qPCR approach is a true platform solution that goes across serotypes, the capsid ELISA is not.
In a recent statement, US Food and Drug Administration encourages the use of the RSMs as benchmarking tools for qualifying in-house reference materials and controls, and for demonstrating that assay methods are appropriately controlled.9 The UK regulatory agency (NIBSC/Medicines and Healthcare Products Regulatory Agency) has published data showing the variability in vg titration and also recommended the use of RSMs.10 Furthermore, the European Directorate for the Quality of Medicines and the French regulatory agency (Agence Nationale de sécurité du medicament et des produits de santé) in collaboration with the Gene Therapy Working Group of the Official Medicines Control Laboratories Network are coordinating efforts with the AAV scientific community to develop quality control test for vg titration of AAV-based gene therapy vectors using, in particular, qPCR targeting the ITRs. Here, we used the RSMs to demonstrate that ITR2 qPCR led to overestimation of vector genome titer unless the Free-ITR modification is applied. The practical utilization of AAV RSMs described here could be considered as one more step towards harmonization.
Materials and Methods
Plasmids and vectors
The AAV2 plasmid, psub201, containing the AAV-2 ITRs was used to generate standard curves for the ITR qPCR assay.25 For the SV40 polyA qPCR assay, a linearized pTR-UF11 plasmid26 (ATCC, MBA- 331) was used to generate a standard curve. The concentration of the isolated plasmid DNA was determined by A260 using a nanophotometer (Implen, München, Germany). For the preparation of the linearized plasmids, psub201 was digested with either HindIII or PvuII (New England BioLabs, Ipswich, MA) under the conditions determined by the manufacturer. The linearized plasmid DNAs were then purified using a plasmid purification kit (QIAquick PCR purification kit, Qiagen, Hilden, Germany) and the concentration of each linearized plasmid was determined using a nanophotometer (Implen, München, Germany). One hundred ng of each supercoiled and linearized plasmids were analyzed on a 1% native agarose gel alongside a 2-log DNA ladder and supercoiled ladder (New England BioLabs Cat N3200S and N0472S, Ipswich, MA) to confirm complete digestion and purity, and to confirm concentration. The concentration determined for each of these templates using the nanophotometer was used to calculate the number of copies of DNA present in each series of dilutions.
AAV reference standards rAAV2 RSM (VR-1616) and rAAV8 RSM (VR-1816) were obtained from the ATCC.
Internal controls 1 (IC1: AAV5/GFP) and 2 (IC2: AAV6/GFP) were produced using the baculovirus/insect cells system.27 Briefly, insect cells were infected with baculovirus vectors containing the helper sequences (rep2cap6 or rep2cap5 provided by the Kotin laboratory at the NIH) and AAV vector ITR2/GFP sequences obtained from pFBGFPR28 to produce either rAAV2/5-GFP or rAAV2/6-GFP vectors.
Sequencing of ITR regions
Sequencing of ITR regions from rAAV2 RSM, rAAV8 RSM and psub201 was carried out by ACGT (Wheeling, IL) using multiplexed Illumina sequencing. Briefly, rAAV vector DNA (single stranded) was extracted from rAAV2 RSM and rAAV8 RSM (ATCC) and dsDNA was PCR amplified from these ssDNA templates and used to prepare a barcoded, sized, pooled library. To sequence the ITRs from psub201, plasmid DNA was fragmented to an average 350 bp by ultrasonication and used to construct the sized pooled library. Each library was characterized by multiplexed Illumina sequencing using NextSeq 500. Trimmed and filtered reads were aligned with reference sequence from psub201 or pTR-UF11 (for AAV2 RSM and AAV8 RSM). No variants were observed in the ITR sequences confirming the integrity of the target sequence (data not shown).
Primers and probes
The transgene cassette qPCR was performed using the SV40 poly adenylation signal as the target sequence. The high pressure liquid chromatography-purified forward primer used was 5′AGCAATAGCATCACAAATTTCACAA3′ and the high pressure liquid chromatography-purified reverse primer was 5′CCAGACATGATAAGATACATTGATGAGTT3′. The fluorescent probe was labeled with fluorescein (FAM) and quenched with TAMRA (5′-FAM-AGCATTTTTTTCACTGCATTCTAGTTGTGGTTTGTC-TAMRA-3′). The high pressure liquid chromatography-purified primers and probe set used to detect AAV-2 ITRs were as described before by Aurnhammer et al.11 For the rep2 qPCR, the sequence of the forward primer was 5′GCC GAG GAC TTG CAT TTC TG3′ and the reverse primer was 5′-TCG GCC AAA GCC ATT CTC-3′, and the fluorescent probe was FAM-AAGCAAGGTGCGCGTG-BHQ. For the GFP qPCR, the sequence of the forward primer was 5′GATGTTGTGGCGGATCTTGA3′ and the reverse primer was 5′CAACAGCCACAACGTCTATATCATG3′ and the fluorescent probe was 5′FAM-ACGCAGCCATCACAAACACGCGCA-BHQ3′. For the ITR5 qPCR, the sequence of the forward primer was 5′CCCCCCCAAACGAGCCAG3′, the reverse primer was 5′ACCCCCTTGCTTGAGAG3′ and the fluorescent probe was 5′FAM- CGAGCGAACGCGACAGGGGGGAGAGTG-BHQ3′. The primers were synthesized by Integrated DNA Technologies and the probes were synthesized by Biosearch Technologies.
Quantitative PCR analysis
A 10-fold dilution of viral vector sample was initially digested at 37 °C for 1 hour with 100 units/ml of DNase I. The digested samples were incubated with an equal volume of Proteinase K digestion mix (5× PK buffer: 5 mmol/l Tris-HCl, pH8, 5 mmol/l ethylenediaminetetraacetic acid, pH8, 0.5% sodium dodecyl sulfate) containing 12 µg of Proteinase K (20 mg/ml) at 55 °C for 30 minutes prior to analysis by qPCR. qPCR analysis was performed using a StepOne Plus PCR system device (Life Technologies) in a 25 µl final volume using the manufacturer’s master mix (Cat 4318157). When indicated, the qPCR analysis was performed using a LightCycler 480 device (Roche). The SV40 forward and reverse primers were used at a final concentration of 200 nmol/l and the fluorescent probe was used at a final concentration of 100 nmol/l. ITR2 qPCR was performed as described by Aurnhammer et al.11 The PCR profile for the SV40 qPCR was 95 °C for 10 minutes and 40 cycles of 95 °C for 15 seconds, 60 °C for 1 minute. The PCR profile for the rep2 qPCR is as follows: 95 °C for 10 minutes followed by 40 cycles of 95 °C for 15 seconds, 53 °C for 1 minute.
Titration of capsid particles by ELISA
The particle concentration was determined using four separate dilution series from each sample in the Progen AAV8 Titration ELISA (Progen Biotechnik GMBH; Article number PRAAV8), against a standard curve prepared from a previously titered rAAV8 preparation (WL217S).6 Briefly, the rAAV8RSM and IC5975 were diluted with ready-to-use sample buffer so that they can be measured within the linear range of the ELISA (1.47 E+7–9.24 E+8 capsids/ml). The AAV8RSM was diluted in the range of 1:2,000 to 1:16,000, whereas IC5975 was diluted between 1:50,000 and 1:400,000. Hundred microliters of ready-to-use sample buffer, serial dilutions of standard, and specimens were pipetted into the wells of the microtiter strips and incubated for 1 hour at 37 °C. Next, biotin conjugate was added to the wells and incubated for 1 hour at 37 °C followed by the streptavidin conjugate (1 hour at 37 °C) and the substrate (15 minutes at RT). Intensity of color reaction was measured with a photometer at 450 nm wavelength.
Statistical analysis
All values represent means ± standard error of the mean. Significant differences were tested by unpaired Student t-test. A P value less than 0.05 was considered statistically significant. Linear regression statistics were done using an F-test, comparing the ratio of two variances (Supplementary Figure S1). We considered a theoretical slope equal to 1 if the values obtained for the cassette titration were equal to the values obtained for the ITR2 titration. The cassette/ITR2 slope calculated from experimental qPCR data was 0.2022 (<0.4236 with 95% confidence intervals). The P value calculated from the F-test and the degree of freedom was P < 0.0001.
Acknowledgments
This work was performed under a Cooperative Agreement between CHU-Nantes, INSERM, AFM, and the University of Florida Center of Excellence for Regenerative Health Biotechnology.
Footnotes
R.O.S. is an inventor on patents related to recombinant AAV technology. R.O.S. owns equity in a gene therapy company that is commercializing AAV for gene therapy applications. To the extent that the work in this manuscript increases the value of these commercial holdings, R.O.S. has a conflict of interest.
References
- Nathwani, AC, Tuddenham, EG, Rangarajan, S, Rosales, C, McIntosh, J, Linch, DC et al. (2011). Adenovirus-associated virus vector-mediated gene transfer in hemophilia B. N Engl J Med 365: 2357–2365. [DOI] [PMC free article] [PubMed] [Google Scholar]
- LeWitt, PA, Rezai, AR, Leehey, MA, Ojemann, SG, Flaherty, AW, Eskandar, EN et al. (2011). AAV2-GAD gene therapy for advanced Parkinson’s disease: a double-blind, sham-surgery controlled, randomised trial. Lancet Neurol 10: 309–319. [DOI] [PubMed] [Google Scholar]
- Maguire, AM, High, KA, Auricchio, A, Wright, JF, Pierce, EA, Testa, F et al. (2009). Age-dependent effects of RPE65 gene therapy for Leber’s congenital amaurosis: a phase 1 dose-escalation trial. Lancet 374: 1597–1605. [DOI] [PMC free article] [PubMed] [Google Scholar]
- Bryant, LM, Christopher, DM, Giles, AR, Hinderer, C, Rodriguez, JL, Smith, JB et al. (2013). Lessons learned from the clinical development and market authorization of Glybera. Hum Gene Ther Clin Dev 24: 55–64. [DOI] [PMC free article] [PubMed] [Google Scholar]
- Lock, M, McGorray, S, Auricchio, A, Ayuso, E, Beecham, EJ, Blouin-Tavel, V et al. (2010). Characterization of a recombinant adeno-associated virus type 2 Reference Standard Material. Hum Gene Ther 21: 1273–1285. [DOI] [PMC free article] [PubMed] [Google Scholar]
- Ayuso, E, Blouin, V, Lock, M, McGorray, S, Leon, X, Alvira, MR et al. (2014). Manufacturing and characterization of a recombinant adeno-associated virus type 8 reference standard material. Hum Gene Ther 25: 977–987. [DOI] [PMC free article] [PubMed] [Google Scholar]
- Moullier, P and Snyder, RO (2008). International efforts for recombinant adeno-associated viral vector reference standards. Mol Ther 16: 1185–1188. [DOI] [PubMed] [Google Scholar]
- Rohr, UP, Wulf, MA, Stahn, S, Steidl, U, Haas, R and Kronenwett, R (2002). Fast and reliable titration of recombinant adeno-associated virus type-2 using quantitative real-time PCR. J Virol Methods 106: 81–88. [DOI] [PubMed] [Google Scholar]
- Gavin, DK (2015). FDA statement regarding the use of adeno-associated virus reference standard materials. Hum Gene Ther Methods 26: 3. [DOI] [PubMed] [Google Scholar]
- Werling, NJ, Satkunanathan, S, Thorpe, R and Zhao, Y (2015). Systematic Comparison and Validation of Quantitative Real-Time PCR Methods for the Quantitation of Adeno-Associated Viral Products. Hum Gene Ther Methods 26: 82–92. [DOI] [PMC free article] [PubMed] [Google Scholar]
- Aurnhammer, C, Haase, M, Muether, N, Hausl, M, Rauschhuber, C, Huber, I et al. (2012). Universal real-time PCR for the detection and quantification of adeno-associated virus serotype 2-derived inverted terminal repeat sequences. Hum Gene Ther Methods 23: 18–28. [DOI] [PubMed] [Google Scholar]
- Manno, CS, Pierce, GF, Arruda, VR, Glader, B, Ragni, M, Rasko, JJ et al. (2006). Successful transduction of liver in hemophilia by AAV-Factor IX and limitations imposed by the host immune response. Nat Med 12: 342–347. [DOI] [PubMed] [Google Scholar]
- Fagone, P, Wright, JF, Nathwani, AC, Nienhuis, AW, Davidoff, AM and Gray, JT (2012). Systemic errors in quantitative polymerase chain reaction titration of self-complementary adeno-associated viral vectors and improved alternative methods. Hum Gene Ther Methods 23: 1–7. [DOI] [PMC free article] [PubMed] [Google Scholar]
- Wang, F, Cui, X, Wang, M, Xiao, W and Xu, R (2013). A reliable and feasible qPCR strategy for titrating AAV vectors. Med Sci Monit Basic Res 19: 187–193. [DOI] [PMC free article] [PubMed] [Google Scholar]
- Samulski, RJ, Chang, LS and Shenk, T (1989). Helper-free stocks of recombinant adeno-associated viruses: normal integration does not require viral gene expression. J Virol 63: 3822–3828. [DOI] [PMC free article] [PubMed] [Google Scholar]
- Ayuso, E, Mingozzi, F, Montane, J, Leon, X, Anguela, XM, Haurigot, V et al. (2010). High AAV vector purity results in serotype- and tissue-independent enhancement of transduction efficiency. Gene Ther 17: 503–510. [DOI] [PubMed] [Google Scholar]
- Hou, Y, Zhang, H, Miranda, L and Lin, S (2010). Serious overestimation in quantitative PCR by circular (supercoiled) plasmid standard: microalgal pcna as the model gene. PLoS One 5: e9545. [DOI] [PMC free article] [PubMed] [Google Scholar]
- Lock, M, Alvira, MR, Chen, SJ and Wilson, JM (2014). Absolute determination of single-stranded and self-complementary adeno-associated viral vector genome titers by droplet digital PCR. Hum Gene Ther Methods 25: 115–125. [DOI] [PMC free article] [PubMed] [Google Scholar]
- Sanders, R, Huggett, JF, Bushell, CA, Cowen, S, Scott, DJ and Foy, CA (2011). Evaluation of digital PCR for absolute DNA quantification. Anal Chem 83: 6474–6484. [DOI] [PubMed] [Google Scholar]
- Piedra, J, Ontiveros, M, Miravet, S, Penalva, C, Monfar, M and Chillon, M (2015). Development of a rapid, robust, and universal picogreen-based method to titer adeno-associated vectors. Hum Gene Ther Methods 26: 35–42. [DOI] [PubMed] [Google Scholar]
- Bustin, SA, Benes, V, Garson, JA, Hellemans, J, Huggett, J, Kubista, M et al. (2009). The MIQE guidelines: minimum information for publication of quantitative real-time PCR experiments. Clin Chem 55: 611–622. [DOI] [PubMed] [Google Scholar]
- Gao, K, Li, M, Zhong, L, Su, Q, Li, J, Li, S et al. (2014). Empty virions in AAV8 vector preparations reduce transduction efficiency and may cause total viral particle dose-limiting side-effects. Mol Ther Methods Clin Dev 1: 20139. [DOI] [PMC free article] [PubMed] [Google Scholar]
- Mingozzi, F, Anguela, XM, Pavani, G, Chen, Y, Davidson, RJ, Hui, DJ et al. (2013). Overcoming preexisting humoral immunity to AAV using capsid decoys. Sci Transl Med 5: 194ra92. [DOI] [PMC free article] [PubMed] [Google Scholar]
- Mingozzi, F, Maus, MV, Hui, DJ, Sabatino, DE, Murphy, SL, Rasko, JE et al. (2007). CD8(+) T-cell responses to adeno-associated virus capsid in humans. Nat Med 13: 419–422. [DOI] [PubMed] [Google Scholar]
- Walsh, CE, Liu, JM, Xiao, X, Young, NS, Nienhuis, AW and Samulski, RJ (1992). Regulated high level expression of a human gamma-globin gene introduced into erythroid cells by an adeno-associated virus vector. Proc Natl Acad Sci USA 89: 7257–7261. [DOI] [PMC free article] [PubMed] [Google Scholar]
- Burger, C, Gorbatyuk, OS, Velardo, MJ, Peden, CS, Williams, P, Zolotukhin, S et al. (2004). Recombinant AAV viral vectors pseudotyped with viral capsids from serotypes 1, 2, and 5 display differential efficiency and cell tropism after delivery to different regions of the central nervous system. Mol Ther 10: 302–317. [DOI] [PubMed] [Google Scholar]
- Smith, RH, Levy, JR and Kotin, RM (2009). A simplified baculovirus-AAV expression vector system coupled with one-step affinity purification yields high-titer rAAV stocks from insect cells. Mol Ther 17: 1888–1896. [DOI] [PMC free article] [PubMed] [Google Scholar]
- Urabe, M, Ding, C and Kotin, RM (2002). Insect cells as a factory to produce adeno-associated virus type 2 vectors. Hum Gene Ther 13: 1935–1943. [DOI] [PubMed] [Google Scholar]
Associated Data
This section collects any data citations, data availability statements, or supplementary materials included in this article.