

Abstract
T-helper cells are differentiated from CD4+ T cells and are traditionally characterized by inflammatory or immunosuppressive responses in contrast to cytotoxic CD8+ T cells. Mass-spectrometry studies on T-helper cells are rare. In this study, we aimed to identify the proteomes of human Th1 and Th1/Th17 clones derived from intestinal biopsies of Crohn's disease patients and to identify differentially expressed proteins between the two phenotypes. Crohn's disease is an inflammatory bowel disease, with predominantly Th1- and Th17-mediated response where cells of the “mixed” phenotype Th1/Th17 have also been commonly found. High-resolution mass spectrometry was used for protein identification and quantitation. In total, we identified 7401 proteins from Th1 and Th1/Th17 clones, where 334 proteins were differentially expressed. Major differences were observed in cytotoxic proteins that were overrepresented in the Th1 clones. The findings were validated by flow cytometry analyses using staining with anti-granzyme B and anti-perforin and by a degranulation assay, confirming higher cytotoxic features of Th1 compared with Th1/Th17 clones. By testing a larger panel of T-helper cell clones from seven different Crohn's disease patients, we concluded that only a subgroup of the Th1 cell clones had cytotoxic features, and these expressed the surface markers T-cell-specific surface glycoprotein CD28 and were negative for expression of natural killer group 2 member D.
The CD4+ T cells also called T-helper (Th)1 cells are important constituents of the immune system. As their name indicates, Th cells provide help to other cells of the immune system and thereby aid in combatting of both intracellular and extracellular pathogens. However, Th cells can also have an exaggerated or inappropriate response and trigger allergic disorders or other immune-mediated diseases. Th cells are classically grouped into Th1, Th2, Th17, and Treg cells where the distinct Th phenotypes are attributed unique functions. Th1 cells are characterized by the production of IFN-γ (1) and expression of the key transcription factor T-bet (2), Th2 cells produce IL-4 (1) and the transcription factor GATA-3 (3), and Th17 cells produce IL-17 (4, 5) and RORγT (6), while Treg cells are recognized by IL-10 and FOXP3 production (7, 8).
The classical view of specific and unique cytokines and transcriptions factors as master regulators working in a synergy to result in a set of distinguished Th cell subtypes has proved to be a simplification (9). The Th cells have shown to have plasticity features, and their end-fate is not necessarily final as previously believed (10, 11). The different cytokines and transcription factors have been proposed to impact plasticity from one Th cell type to another (12, 13). Th cells of “mixed” phenotypes also contribute greatly to the complexity of Th cell subtypes (9), and mixed phenotypes like e.g. Th1/Th2 (14) and Th1/Th17 (15) are reported in the literature.
The important role of Th cells in protective immunity to pathogens and in immune-mediated diseases makes it of great interest to characterize and better understand the molecular basis contributing to such roles of these cells. Mass-spectrometry-based proteomics is a powerful tool to study immune cells more comprehensively, and it is a growing field. Previous proteomic studies on Th cells focused mainly on comparison of the Th1 and Th2 proteome. The CD4+ T cell response to IL-12 and IL-4 signaling has also been studied (16, 17). These studies all used in vitro differentiation of naive CD4+ T cells from human blood by cytokine supplementation of the growth medium (16–20), while we here investigate in vivo differentiated Th cell clones isolated from gut-derived biopsies. In a study on protein differences between Th1 and Th2 cells, 70 differentially expressed proteins were identified. Out of these, only 14 were reproduced for data collected from cells polarized for different time points (7 and 14 days), indicating the dynamic nature of proteomes of differentiating cells (20). In the present study, we wanted to focus on tissue-derived Th cell clones with the up-to-date mass spectrometry technology. We have previously isolated intestinal Th1 and Th1/Th17 clones from Crohn's disease patients and investigated their reactivity to various intestinal commensals and opportunistic pathogens (21, 22). Crohn's disease is an intestinal disease where exaggerated Th1 and Th17 responses appear to be important (23), and the purpose of this study was to gain increased understanding of the complexity of these CD4+ T cell subsets. In addition to quantifying protein differences between Th1 and Th1/Th17, we also wanted to examine the reproducibility of Th cell clones by common variations in cell culture expansion.
EXPERIMENTAL PROCEDURES
T Cell Clones and Design of the Study
All the T cell clones were derived from intestinal biopsies of Crohn's disease patients. Their phenotype based on cytokine production and expression of surface proteins commonly used as markers have been described previously (21, 22). Briefly, the production of the cytokines IFN-γ, IL-4, and IL-17 together with expression of CD161 and C-C chemokine receptor 6 were used to classify the clones into the Th1, Th2, or Th17 subgroups. Clones expressing large amounts of both IFN-γ and IL-17 were classified to have a mixed Th1/Th17 phenotype, while clones expressing both IFN-γ and IL-4 were classified to have a mixed Th1/Th2 phenotype. Th1 and Th1/Th17 cell clones were selected for proteomic studies. The Th cell clones were isolated from three different donors. The Th cell clones TCC958.A.N.1 (958.1) and TCC958.A.M.2 (958.17) were from the same patient, while TCC955.A.N.6 (955.1) and TCC946.A.8.2B.17 (946.17) were each from different patients. The cells were stimulated with anti-CD3 and anti-CD28 either by beads or plate coated, grown at time apart, and harvested after different passage number. For a more detailed overview, see Table S1. Five expansions each (independent growths) were used for 958.1 and 958.17 as replicates from same clone, and one expansion each for 955.1 and 946.17 as biological replicates from different patients. In total, six replicates were used for each phenotype for proteomics studies; see an overview for the workflow in Fig. S1. All cells were harvested in their resting stage. The study was approved by the Regional Committee for Medical Research Ethics, South Norway.
Expansion of T Cell Clones
The Th cell clones were expanded using irradiated feeder cells, anti-CD3/anti-CD28-coated beads (one bead/cell) or plate-bound anti-CD3 (0.5 μg/ml) together with soluble anti-CD28 (0.2 μg/ml) as previously described (21). In short, cells were dissolved in complete cell culture medium (RPMI 1640 (Gibco) containing 10% human serum, β mercaptoethanol, penicillin and streptomycin, 10 U/ml human IL-2 (R&D Systems, Abingdon, UK), and 1 ng/ml human IL-15 (R&D Systems). The cells were then stimulated using either plate-bound anti-CD3 (clone UCHT1, Biolegend) with soluble anti-CD28, (clone CD28.2, Biolegend) or Dynabeads® Human T-Activator CD3/CD28 (Life Technologies). The cells were expanded for 8 to 9 days with splitting and addition of fresh medium when necessary. Resting cells as examined by visual examination were used for proteomic analyses.
Protein Extraction
Prior to protein extraction, the cells were washed four times in phosphate-buffered saline, pH 7.4 (GIBCO, Life technologies), with centrifugation at 400 × g for 6 min at 4 °C. The cell pellet was frozen down at −80 °C until further use. To lyse the cells, they were first thoroughly crushed inside the Eppendorf tube with a pestle and incubated at 95 °C for 1 min. After three freeze and thaw cycles, 2% SDS/50 mm DTT/25 mm Tris-HCl, pH = 7.6 (SDS: UltraPure, 10%, GIBCO, Invitrogen; DTT: Sigma), was added and incubated again at 95 °C for 1 min. The samples were vortexed briefly (10 s) prior to incubation at 4 °C overnight. The following day, the cells were sonicated for 30 min to fully lyse them. Protein concentration was determined by direct detect instrument from Millipore. To the cell lysate containing 115 μg of proteins, five volumes of ice cold acetone were added and precipitated at −20 °C o/n. After centrifugation at 4 °C with 14.000 × g for 10 min, the supernatant was discarded, and the pellet was dried.
In-Solution Digest
In-solution digest was performed as described by G. L Christensen et al. in 24 with slight modifications. Briefly, the proteins were dissolved in 6 m urea in 10 mm HEPES, pH = 8. Proteins were reduced in 1 mm DTT at room temperature for 30 min, followed by alkylation in 5.5 mm iodoacetamide (Sigma-Aldrich) at room temperature for 15 min. The proteins were then digested with 1:100 endoLys-C (Wako, Germany) for 4 h at room temperature. A fourfold dilution was done with deionized water before o/n digestion at room temperature with 1:100 of the enzyme trypsin (modified grade, Promega).
Peptide Fractionation
In order to reduce the complexity of the samples, peptides were fractionated with strong anion exchange columns as described by J. R Wisniewski et al. (25). Peptides were subsequently eluted with pH 11, pH 8, pH 6, pH 5, pH 4, and pH 3.
Peptide Purification
Before desalting, the pH 8 and pH 6 fractions were combined and so were the pH 5, pH 4, and pH 3 fractions. The peptides were desalted using an in-house made C18 StageTip. Each StageTip was made with three layers of C18 Empore Extraction disks (Varian, St. Paul, MN, USA). The samples were acidified to 0.1% TFA (Fluka, Sigma). Prior to loading on the sample, the C18 material was activated with 100% methanol and equilibrated twice with 0.1% TFA. The sample was passed through the StageTip twice, followed by wash with 0.1% TFA. The peptides were kept on the C18 StageTip, and stored at 4 °C until peptide elution (not more than 1 week). The peptides were eluted with 95% ACN/0.1% FA (ACN: Fluka Analytical, Sigma-Aldrich, FA: Fluka Analytical), dried in a SpeedVac (Eppendorf) until approximately 3 μl, and reconstituted to a total volume of 20 μl in 0.1% FA.
nLC-MS/MS
nLC-MS/MS analysis was performed on a Dionex Ultimate 3000 nLC (Sunnyvale, CA, USA) system coupled to an Q-Exactive (Thermo Electron, Bremen, Germany) mass spectrometer, equipped with a nanospray flex ion source with direct junction (Thermo Scientific). The direct junction was mounted with a stainless steel emitter at the end. For peptide separation, a two-column setup with C18 Acclaim PepMap Nano-Trap Column (5 μm particle size) and 50 cm C18 Acclaim PepMap RSLC (100 Å, 2 μm particle size, 75 μm inner diameter) analytical column (Thermo Scientific) was used. Solvent A was 0.1% FA and solvent B 90% ACN in 0.1% FA. The gradient had a flow rate of 300 nl/min and was 5% B in 5 min, 5–32% until 225 min, then to 45% until 240 min, followed by wash at 90% B for 10 min, and then back to 5% B until 252 min and kept at that until 260 min. The mass spectrometer was operated in a data-dependent mode with top 10 MS/MS scans, and the survey of full-scan MS spectra was from 300–1750 m/z. The following parameters for MS scan were applied: lock mass: off, resolution: 70,000, AGC target: 3e6, and maximum IT: 50 ms. The MS/MS scans were performed at: resolution: 17,500, AGC target: 2e5, maximum IT: 100 ms, isolation window: 3.0 m/z, NCE: 25, underfill ratio: 10.0%, intensity threshold: 2.0e5, and dynamic exclusion: 45.0 s.
Mass-Spectrometry Data Analysis
Protein identification and label-free quantitation was performed in MaxQuant (version 1.3.0.5) using the Andromeda search engine (26). Database search was carried out in Andromeda against the human International Protein Index (IPI) database (v3.84) supplemented with contaminants. The IPI database consisted of 90,160 entries. The following parameters were applied: enzyme: trypsin/P; variable modifications: oxidation (M), acetyl (protein N-term), Gln->pyro-Glu and Glu->pyro-glu; fixed modifications: carbamidomethyl (C); max. peptide PEP: 0.1; min. peptide length: 7; min. unique peptides: 1; advanced: re-quantity, keep low-scoring versions of identified peptides, match between runs (3 min time window), label-free quantitation, and second peptide MS2 identification. Otherwise, the default parameters of MaxQuant were considered. For single peptide identifications, only those that annotated spectra could be retrieved from MaxQuant Viewer were included (File S1). t test calculations were performed in Perseus (version 1.4.0.20). Label-free quantitative (LFQ) intensities were chosen as expression, and log2 was calculated. Proteins marked as possible contaminants, hits from the reverse sequences false discovery rate (FDRs), and proteins marked as “only identified by site” by MaxQuant were removed from the list of identifications prior to statistical analysis. The zero intensity values were imputed by normal distribution. This gave LFQ intensity values that simulate the distribution of low abundant proteins (27). No filtering based on valid values was done prior to imputation. No skewing of the data distribution was inserted regardless if missing values were filtered or imputation was performed as the chosen approach (see Figs. S2 and S3 for more information on impact on the data with and without imputation and with or without filtering for valid values). The original LFQ values, including zero intensity values from MaxQuant data output for all samples (biological and technical replicates), can be found in Table S2. Prior to t test calculations, replicates from the same donor were grouped together, and p value<.01 was used as t test threshold. Pearson correlation was calculated for replicates of the clones 958.1 and 958.17 based on the normalized LFQ values to show clone reproducibility.
Publicly available databases (such as the Database for Annotation, Visualization and Integration Discovery, DAVID, and Search Tool for the Retrieval of Interacting Genes, STRING) were also searched for functional enrichment analysis. These results were not included since they did not provide any further insight into the biology of the cell clones.
Transcription factors were identified from the total protein identification list by cross-search with human transcription factors listed in the Swissregulon Database (http://swissregulon.unibas.ch/) in addition to manual search with use of the word “transcription” followed by recheck in literature and with gene names of transcription factors familiar to the authors.
Flow Cytometry Analyses of Intracellular and Surface Markers
The following antibodies were used for flow-cytometric analyzes: anti-CD4 (FITC, clone OKT4, 5 μl, Biolegend), anti-CD4 (APC, clone RPA-T4, eBioscience), anti-GZMB (Alexa Fluor® 647, clone GB11, Biolegend), anti-PRF (PE, clone BD48, Biolegend), anti-CD28 (Alexa Fluor® 488, clone CD28.2, Biolegend), anti-CX3CR1 (PE, clone 2A9–1, Biolegend), anti-NKG2D (PE, clone 1D11, Abcam), and PerCP anti-CD8 (PerCP, clone SK1, Biolegend). Briefly, the T- cell clones (500,000 cells) were stained with anti-CD4 for 20 min, washed, and mixed with unstained PBMC. The mix was subsequently stained with surface markers (proteins commonly used as phenotypic markers) followed by fixation in 1% paraformaldehyde for 1 h and permeabilization in PBS with 2% FCS and 0.2% saponin for 30 min. The cells were stained with antibodies against GZMB and PRF and analyzed on a FACS Calibur flow cytometer (Becton Dickinson) equipped with Cell-Quest software. Mixing unstained PBMC with the CD4 stained T-cell clones provided an internal control for subsequent staining. The PBMC contains a population of cells that are positive and negative for the various markers. Occasional well-to-well variations in fluorescence intensities were corrected by comparing the expression of the markers in the CD4-labeled T-cell clones to the negative and positive populations in the PBMC.
Degranulation Assay
Plates were coated with anti-CD3 (1 μl/ml, clone UCHT1, Biolegend) in PBS at 4 °C for 24 h. Th cell clones were added together with anti-CD28, (0.2 μl/ml, clone CD28.2, Biolegend), anti-CD49d (1 μg/ml), and anti-human CD107a (5 μl/ml, Alexa Fluor® 647 (LAMP-1). Wells without anti-CD3 were used as negative controls. The samples were incubated for 1 h at 37 °C, GolgiStop™ was added followed by incubation for 5 additional hours. The samples were analyzed on FACS Calibur. The expression of CD107a in anti-CD3-stimulated wells was compared with the expression in control wells containing only anti-CD28 and anti-CD49d.
RESULTS
Protein Expression and Effect of In Vitro Expansion on Protein Expression
Label-free quantitative mass-spectrometry analysis of Th1 and Th1/Th17 clones resulted in the identification of a total number of 7401 unique protein groups with protein false discovery rate at 0.01. The obtained protein identifications and quantitative values (protein ID, LFQ values, sequence coverage, unique peptides, PEP score, t test significant, t test p value, and t test difference,) are reported in Table S3.
The effect of expansion number and method on protein expression was assessed by using two different expansion protocols and three different expansion numbers for a Th1 and a Th1/Th17 clone derived from the same patient (Table S1). Pearson correlation was calculated between the replicates of the Th1 cell clone 958.1 and the Th1/Th17 cell clone 958.17 based on label-free quantitative (LFQ) values. The five replicates gave a reproducibility of 94.8%-97.9% for 958.1 and 93.2%-97.2% for 958.17 (Figs. S4 and S5). There were no systematic differences in protein expression between replicates from the same clone that could be related to variations in the different growth parameters applied. These results indicated that difference in in vitro conditions had low impact on cell expression profiles.
Two additional clones from two different patients were included in an attempt to identify differentially expressed proteins that were specific for the two phenotypes and patient independent. These two clones, 955.1 and 946.17, had a Th1 and a Th1/Th17 phenotype, respectively (Table S1).
Hierarchical clustering was made based on the LFQ values for all the samples (Fig. S6), and the overall results showed that the Th cell clone proteomes in general were very similar. The replicates from 958.1 and 958.17 (derived from the same patient) clustered together, demonstrating that patient origin had a stronger impact on protein expression than Th phenotype.
Differential Protein Expression
The number of differential expressed proteins identified by mass-spectrometry analysis was 1267 between 958.1 and 958.17 (including all five replicates) and 1405 proteins between 955.1 and 946.17. The total number of differentially expressed proteins present in both datasets was 430 proteins, and of these, 334 were similarly over- or underrepresented in both datasets for the same phenotype. Most of these 334 proteins, although significantly different, elicited relatively low differences in protein expression with ratios from 1.5 to 2.5. The complete data of the differentially expressed proteins detected can be found in Table S3. The hierarchical clustering of differentially expressed proteins for all clones is shown in Fig. 1. Hierarchical clustering of these data showed that cells with similar phenotype from the different patients grouped together.
Fig. 1.

Hierarchical clustering of significantly differential proteins. Proteins that were differentially observed in 958.1 compared with 958.17 and 955.1 compared with 946.17 were included. LFQ values (log2) are used as intensity measurements. The hierarchical clustering shows clones of the same phenotype grouped together.
The largest differences between the two phenotypes were observed for proteins that are classified as having cytotoxic function (Table I). The protein with the highest difference was granzyme B (GZMB) with 369.4x (958.1/958.17) and 316.7 x (955.1/946.17) higher expression in Th1 cell clones. Also the cytotoxic proteins GZMA, GZMH, GZMK, granulysin, perforin (PRF), and GZMM were clearly more abundant in the Th1 cells (Table I).
Table I. Differentially expressed proteins in Th1 compared to Th1/Th17 clones with more than 2.5x fold change in comparison of 958.1 with 958.17 plus in comparison of 955.1 with 946.17.
| Th1 vs. Th1/Th17 | Gene name | Protein name | 958.1 vs. 958.17* fold change | 955.1 vs. 946.17* fold change |
|---|---|---|---|---|
| Up-regulated | GZMB | Granzyme B | 369.4 | 316.7 |
| ITGAX | Integrin alpha-X | 7.7 | 181.9 | |
| GNLY | Granulysin | 9.8 | 167.5 | |
| GZMK | Granzyme K | 89.9 | 54.8 | |
| ANXA1 | Annexin A1 | 24.1 | 60.8 | |
| FLNB | Filamin-B | 13.5 | 39.7 | |
| MX1 | Interferon-induced GTP-binding protein Mx1 | 12.3 | 37.6 | |
| PRF | Perforin | 28.0 | 4.3 | |
| CHDH | Choline dehydrogenase, mitochondrial | 4.7 | 27.5 | |
| ACSL6 | Long-chain-fatty-acid–CoA ligase 6 | 4.2 | 24.8 | |
| RNASE6 | Ribonuclease K6 | 2.7 | 24.0 | |
| GZMH | Granzyme H | 10.2 | 10.8 | |
| AACS | Acetoacetyl-CoA synthetase | 6.3 | 11.8 | |
| HBA1 | Hemoglobin subunit alpha | 11.8 | 5.1 | |
| CKAP4 | Cytoskeleton-associated protein 4 | 5.2 | 9.1 | |
| MMP25 | Matrix metalloproteinase-25 | 3.6 | 10.6 | |
| AOAH | Acyloxyacyl hydrolase | 8.0 | 5.5 | |
| LGALS3BP | Galectin-3-binding protein | 4.5 | 7.8 | |
| GZMA | Granzyme A | 2.8 | 7.8 | |
| IGHM | Ig mu chain C region | 4.8 | 4.4 | |
| AGPAT9 | Glycerol-3-phosphate acyltransferase 3 | 3.9 | 4.6 | |
| MAN2B2 | Epididymis-specific alpha-mannosidase | 3.5 | 4.5 | |
| LMNA | Prelamin-A/C | 4.7 | 2.6 | |
| GZMM | Granzyme M | 4.7 | 2.6 | |
| MPP1 | 55 kDa erythrocyte membrane protein | 4.0 | 3.2 | |
| SLC27A2 | Very long-chain acyl-CoA synthetase | 2.7 | 3.9 | |
| PLG | Plasminogen | 3.7 | 2.7 | |
| CECR1 | Adenosine deaminase CECR1 | 3.0 | 3.4 | |
| GOLT1B | Vesicle transport protein GOT1B | 2.9 | 3.0 | |
| ITGB1 | Integrin beta-1 | 2.7 | 2.9 | |
| APOA1 | Apolipoprotein A-I | 2.6 | 2.6 | |
| Down-regulated | IL4I1 | l-amino-acid oxidase | −55.0 | −8.9 |
| FSD1 | Fibronectin type III and SPRY domain-containing protein 1 | −36.6 | −12.2 | |
| MCAM | Cell surface glycoprotein MUC18 | −22.3 | −12.9 | |
| CTSH | Pro-cathepsin H | −26.5 | −8.4 | |
| ANK1 | Ankyrin-1 | −17.3 | −4.0 | |
| KLRB1 | Killer cell lectin-like receptor subfamily B member 1 | −2.9 | −16.9 | |
| UNC93B1 | Protein unc-93 homolog B1 | −12.7 | −2.6 | |
| ASB2 | Ankyrin repeat and SOCS box protein 2 | −3.6 | −7.2 | |
| TTC39C | Tetratricopeptide repeat protein 39C | −4.6 | −3.8 | |
| EPG5 | Ectopic P granules protein 5 homolog | −2.7 | −4.7 | |
| SIRPG | Signal-regulatory protein gamma | −3.2 | −3.9 | |
| UAP1L1 | UDP-N-acetylhexosamine pyrophosphorylase-like protein 1 | −4.0 | −3.0 | |
| MYEF2 | Myelin expression factor 2 | −3.5 | −3.1 | |
| LGALS3 | Galectin-3 | −2.9 | −3.6 | |
| NLN | Neurolysin, mitochondrial | −2.6 | −3.3 | |
| NCOA7 | Nuclear receptor coactivator 7 | −2.6 | −2.7 |
* Only proteins with a t-test p value<0.01 and more than 2.5x difference in both comparison sets are included. The differentially expressed proteins are ranked from high to low fold change in average between Th1 and Th1/Th17 clones, with up-regulated proteins in Th1 cell clones listed before down-regulated. Proteins involved in cytotoxic granules are highlighted in bold.
Other differentially expressed proteins with higher expression in the Th1 clones included MX1, GIMAP1, GIMAP4, GIMAP5, and GIMAP7. Several transcription factors with both known and unknown functions in CD4+ T cell differentiation were also identified to be differentially expressed in the Th1 compared with the Th1/Th17 clones. Among other Th-cell-associated transcription factors, we identified RORC and FOXP3, which had more than 2 x differences in expression in both comparison sets. RORC was up-regulated in the Th1/Th17 cell clones while FOXP3 was up-regulated in Th1 clones. An overview of all transcription factors found to be differentially expressed with t test p value < .01 can be found in Table S4.
Cytotoxic Phenotype Traits Validated by Flow Cytometry
To validate the difference in expression of cytotoxic markers between the 958.1 and the 958.17 clones, intracellular staining and flow cytometry analyses were performed. The 958.1 clone expressed much higher amounts of PRF and GZMB compare with the 958.17 clone (Fig. 2), which was in accordance with the proteomic data. To see whether PRF and GZMB were present in all Th1 clones, a larger panel of Th cell clones derived from seven different patients was screened. In total. 21 clones were tested, where 12 of the clones were Th1, two were Th1/Th2, one Th17, and eight Th1/Th17 (Table II). The phenotypes of the Th cell clones were based on previously published cytokine expression data (21, 22). Five out of the total 12 Th1and the two Th1/Th2 clones expressed GZMB, and four of the GZMB expressing Th1 clones also expressed PRF. None of the Th1/Th17 or the Th17 clones expressed GZMB or PRF. The GZMB-expressing clones were derived from four different patients. To further characterize the clones, staining for markers that have previously been associated with phenotype characterization of cytotoxic CD4+ T cells was performed (28–32). The Th cell clones were stained for CD8, CX3CR1, NKG2D, and CD28 (Table II). The GZMB-expressing clones were all CD28+, NKG2D-, and CD8-, while two expressed CX3CR1. To see whether the T cell clones were able to release the cytotoxic granules after stimulation of the T cell receptor, a degranulation assay was performed. As expected, a much higher degranulation, as measured by CD107c expression, was detected after stimulation by anti-CD3 in the 958.1 clone compared with the 958.17 clone (Fig. 3).
Fig. 2.
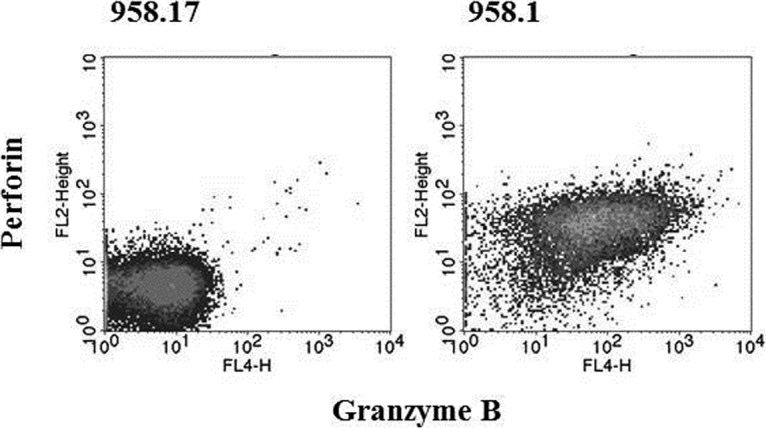
Granzyme B and perforin expression. The expression of granzyme B and perforin in the Th1/Th17 clone (958.17) and the Th1 clone (958.1) was assessed by intracellular staining and flow cytometry.
Table II. Expression of proteins related to cytotoxicity in Th cell clones assessed by flow cytometry.
| Clone ID | Granzyme | Perforin | CD28 | NKG2D | CX3CR1 | CD8 | Phenotype |
|---|---|---|---|---|---|---|---|
| TCC958.A.N.1 | + | + | + | − | − | − | Th1 |
| TCC918.B.N.6 | + | + | + | − | − | − | Th1 |
| TCC956.A.B.1 | + | + | + | − | − | − | Th1 |
| TCC955.A.N.4 | + | + | + | − | + | − | Th1 |
| TCC955.A.M.3a | + | − | + | − | + | − | Th1 |
| TCC955.A.M.1 | + | − | + | − | − | − | Th1/Th2 |
| TCC956.A.B 2 | + | − | + | − | − | − | Th1/Th2 |
| TCC955.A.N.1 | − | − | + | − | − | − | Th1 |
| TCC955.A.N.3 | − | − | + | − | − | − | Th1 |
| TCC946.A.8.2b.5 | − | − | + | − | − | − | Th1 |
| TCC954.A.7.2.204 | − | − | (+) | − | − | − | Th1 |
| TCC918.B.N.2 | − | − | + | − | − | − | Th1 |
| TCC955.A.E.1 | − | − | + | − | − | (+) | Th1 |
| TCC958.A.N.4 | − | − | + | − | − | (+) | Th1 |
| TCC956.A.N.4 | − | − | + | − | − | − | Th17 |
| TCC958.A.M.2 | − | − | + | − | − | − | Th1/Th17 |
| TCC918.B.M.1 | − | − | + | − | − | − | Th1/Th17 |
| TCC918.B.M.2 | − | − | + | − | − | − | Th1/Th17 |
| TCC946.A.8.2b.17 | − | − | + | − | − | − | Th1/Th17 |
| TCC918.B.E.1 | − | − | + | − | − | − | Th1/Th17 |
| TCC918.B.N.1 | − | − | + | − | − | − | Th1/Th17 |
| TCC918.B.N.3 | − | − | + | − | − | − | Th1/Th17 |
| TCC909.A.8.2.34 | − | − | − | − | − | − | Th1/Th17 |
* Weakly positive measurements are represented by “(+)”. Phenotype characterization data can be found in Olsen, I., et al., 2009 and 2013 [21, 22].
Fig. 3.

Degranulation after stimulation with anti-CD3. The ability to degranulate after stimulation was measured in the Th1/Th17 clone; 958.17, and the Th1 clone; 958.1. The cells were stimulated with anti-CD49d, anti-CD28 and anti-CD3 (filled histogram) or anti-CD49d an anti-CD28 only (open histograms) in the presence of anti-CD107a for 5 h. The accumulation of anti-CD107a was assessed by flow cytometry. The following mean fluorescence intensities were measured. Th1Th17 clone 958.17: anti-CD3 stimulation (11.2), negative control (4.7). Th1 clone 958.1: anti-CD3 stimulation (52.1), negative control (9.7).
DISCUSSION
In the present work, we performed quantitative proteomic analysis using high-resolution mass spectrometry on Th1 and Th1/Th17 clones, derived from intestinal biopsies from Crohn's disease patients. The most striking differences in protein expression were seen in proteins responsible for cytotoxicity. The two Th1 clones analyzed by mass spectrometry had a much higher expression of cytotoxic proteins such as GZMs and PRF compared with the Th1/Th17 clones (Table I). Flow cytometry analyses confirmed the presence of GZMB and PRF in a subset of Th1 cells, and degranulation after anti-CD3 stimulation was demonstrated. These findings altogether imply identification of CD28+ NKG2D- Th1 phenotype as a cytotoxic CD4+ T cell, a phenotype that is currently not described in literature as cytotoxic.
Cytotoxic proteins are known effectors of cytotoxic T cells that cause apoptosis of target cells (33), and is a function generally assigned to CD8+ T cells. However, demonstration of cytotoxic CD4+ T cells has been reported in both humans and mice (34–36). CD4+ cytotoxic T cells are reported in acute and chronic infections (28, 29, 37) and also in immune-mediated diseases where they have been found in higher levels (30, 32). There are also studies done on Crohn's disease patients that show increased number of cytotoxic CD4+ T cells, both from inflammatory and noninflammatory site compared with controls (30, 38, 39). However, the role of cytotoxic CD4+ T cells in Crohn's disease is not known. Cytotoxic CD4+ CD28- T cells have been shown to have a protective role in chronic viral infections where they emerge during the latency phase, while early in infection a more classic Th1 phenotype was observed (40). On the other hand, in immune-mediated diseases like rheumatoid arthritis, CD4+ CD28- T cells have been suggested to have a pathogenic role (41). Further studies regarding the role of cytotoxic CD4+ T cells in Crohn's disease are justified.
A few proteomics studies using biopsies and PBMCs from Crohn's disease patients have been published (42–44). The heterogeneity of these samples makes it impossible to characterize the individual T cells. To achieve this, it is necessary to obtain individual T cell clones. However, a challenge with characterization of T cell clones is the need for in vitro expansion. Even though mass-spectrometry-based methods have improved in sensitivity, practical issues still exist to characterize the proteome of primary T cells especially at the clonal level. The cytotoxic CD4+ T cells initially reported in the literature were explained by being merely an artifact of in vitro growth, and the question whether the proteome of a specific primary cell truly reflects the original phenotype is obviously an issue. In an attempt to address this question, several expansions were made using variations in the growth conditions, and the cells were analyzed independently by mass spectrometry. The results showed that the clone replicates did not significantly differ from each other, and there was no tendency to higher expression of cytotoxic proteins from passage to passage. We also observed the key transcription factor for Th17 phenotype, RORC, to be up-regulated in the Th1/Th17 clone. Furthermore, individual clones isolated from the same patient, expanded at same time using the same protocol, elicited unique phenotypes. It is thus unlikely that the high expression of cytotoxic proteins by a subgroup of the Th cells were caused by the in vitro culture per se.
The relevance of cytotoxic CD4+ T cells has recently been addressed in two studies suggesting that these cells are functionally distinct subtypes with pivotal roles both in protective immunity as well as in immune-mediated pathology (45, 46). These studies showed a major role of the transcription factors ThPOK and RUNX3 in the reprogramming of traditional CD4+ T cells into cytotoxic CD4+ T cells. Traditionally, these factors are known to be important during development of T cells where ThPOK suppresses the cytolytic program in CD4+ T cells while RUNX3 counteracts this action in CD8+ T cells, leading to expression of the cytolytic proteins. In the mentioned studies, the cytotoxic CD4+ T cells were characterized by the absence of the master regulator ThPOK, and it was demonstrated that ThPOK can be lost during strong or chronic stimulation, leading to the development of CD4+ cytotoxic cells. ThPOK was not identified in quantitative levels in our study, but several other transcription factors associated with cytotoxic T lymphocytes were identified. GZMB expression in cytotoxic Th1 cells has been reported to be regulated by the transcription factor Eomes (47), and both Eomes and Runx3 were up-regulated in the Th1 clone 958.1 compared with the Th1/Th17 clone 958.17. A similar direction of up-regulation was observed when comparing Th1 clone 955.1 with Th1/Th17 clone 946.17 although this was not significant (Table S4). Ets1 is another transcription factor that is important for CD8+ T cell differentiation. The transcription factor Ets1 is thought to promote the expression of Runx3 during CD8+ T cell differentiation (48). Maybe a bit surprising, Ets1 was found to be significantly down-regulated in both Th1 clones in the present study.
GTP-binding proteins, GIMAPs, were also identified with significantly higher expression in the Th1 clones (Table S3). Although this family of conserved proteins function is poorly understood, they have been associated with various molecular and cellular functions in lymphocyte development and maintenance. GIMAP1 and GIMAP4 have earlier been identified as being more abundant in Th1 compared with Th2 (18) while GIMAP5 and GIMAP7 have not previously been identified as differentially expressed in a specific type of Th cell. Different GIMAP family members interact with anti- and proapoptotic proteins in T cells and are therefore thought to regulate T cell homeostasis (49, 50). GIMAP5 has also been shown to be essential for NK and NKT cell survival, and decreased levels of NKG2D in NK cells are observed in GIMAP5 mice compared with GIMAP5 knockout mice (51). Interestingly, GIMAPs have also been linked to inflammatory and autoimmune diseases (52, 53); however, the role of these proteins in Crohn's disease is unknown.
Several studies have focused on phenotypic characterization of cytotoxic CD4+ T cells. In humans, these cells appeared to be increased in peripheral blood in certain chronic inflammatory conditions (28, 32, 54). A distinct trait of the described cytotoxic CD4+ T cells has been the lack of surface expression of CD28 (28, 29). In addition, the cytotoxic CD4+ CD28- cells in blood usually expressed CX3CR1 (30) and/or NK cell markers like NKG2D (31, 32). The phenotype of cytotoxic CD4+ T cells in tissues derived from patients with chronic inflammatory conditions has not been characterized to the same extent (30, 39). Characterization of the cytotoxic CD4+ T cell clones derived from intestinal biopsies of Crohn's disease patients in the present study showed that these clones were all CD28+ and NKG2D- while five out of seven were CX3CR1 negative. The tissue-derived cytotoxic CD4+ T cells currently described thus appeared to have a different phenotype compared with earlier studies.
In conclusion, we have performed comparison of proteomic content of Th1 and Th1/Th17 cell clones. The most striking differences after quantitative analysis revealed differences in expression of cytotoxic proteins. CD4+ T cells with Th1 phenotype had a much higher degree of cytotoxic features compared with Th1/Th17 phenotype. Further analysis with flow cytometry revealed CD28+ NKG2D- Th1 phenotype as cytotoxic Th cell clones. The Th1 cell clones with cytotoxic features in our study had a different phenotype compared with previous studies, suggesting that a range of cytotoxic CD4+ T cell subsets may exist or that these cells have similar plasticity as described for conventional cytokine producing CD4+ T cells.
Supplementary Material
Acknowledgments
We thank subjects who have donated biological material to the research and Knut Lundin (Oslo University Hospital-Rikshospitalet) for obtaining the biopsies. Mass spectrometry data were collected at Proteomics Core Facility-Rikshospitalet (Oslo University Hospital).
Footnotes
Author contributions: T.R., L.M.S., I.O., and G.A.d. designed the research; T.R. and I.O. performed the research; T.R. analyzed data; T.R., I.O., and G.A.d. wrote the paper; and T.R., L.M.S., I.O., and G.A.d. discussed the results.
* This work was funded by South-Eastern Norway Regional Health Authority.
 This article contains supplemental materials.
The authors declare that they have no conflict of interest.
1 The abbreviations used are:
- Th
- T-helper
- CD28
- T-cell-specific surface glycoprotein CD28
- NKG2D
- natural killer group 2 member D
- LFQ
- label-free quantitative
- GZM
- granzyme
- PRF
- perforin
- PEP
- posterior error probability
- IFN
- interferon
- GATA
- trans-acting T-cell-specific transcription factor
- IL
- interleukin
- ROR
- RAR-related orphan receptor
- FOXP
- forkhead box
- MX
- interferon-induced GTP-binding protein Mx
- GIMAP
- GTPase of immunity associated protein
- ACN
- acetonitrile
- FA
- formic acid
- AGC
- automatic gain control
- NCE
- normalized collision energy
- IT
- injection time
- FDR
- false discovery rate
- FITC
- fluorescein isothiocyanate
- APC
- allophycocyanin
- PerCP
- peridinin chlorophyll protein complex
- PBMC
- peripheral blood mononuclear cell
- RUNX
- runt-related transcription factor
- ThPOK
- T-helper-inducing POZ/Krueppel-like factor
- Ets
- Protein C-Ets
- NK
- natural killer
- NKT
- natural killer T.
REFERENCES
- 1. Mosmann T. R., et al. , (1986) Two types of murine helper T cell clone. I. Definition according to profiles of lymphokine activities and secreted proteins. J. Immunol. 136, 2348–2357 [PubMed] [Google Scholar]
- 2. Szabo S. J., Kim S. T., Costa G. L., Zhang X., Fathman C. G., and Glimcher L. H. (2000) A novel transcription factor, T-bet, directs Th1 lineage commitment. Cell 100, 655–669 [DOI] [PubMed] [Google Scholar]
- 3. Zheng W., and Flavell R. A. (1997) The transcription factor GATA-3 is necessary and sufficient for Th2 cytokine gene expression in CD4 T cells. Cell 89, 587–596 [DOI] [PubMed] [Google Scholar]
- 4. Park H., Li Z., Yang X. O., Chang S. H., Nurieva R., Wang Y. H., Wang Y., Hood L., Zhu Z., Tian Q., and Dong C. (2005) A distinct lineage of CD4 T cells regulates tissue inflammation by producing interleukin 17. Nat. Immunol. 6, 1133–1141 [DOI] [PMC free article] [PubMed] [Google Scholar]
- 5. Harrington L. E., Hatton R. D., Mangan P. R., Turner H., Murphy T. L., Murphy K. M., and Weaver C. T. (2005) Interleukin 17-producing CD4+ effector T cells develop via a lineage distinct from the T helper type 1 and 2 lineages. Nat. Immunol. 6, 1123–1132 [DOI] [PubMed] [Google Scholar]
- 6. Ivanov I. I., McKenzie B. S., Zhou L., Tadokoro C. E., Lepelley A., Lafaille J. J., Cua D. J., and Littman D. R. (2006) The orphan nuclear receptor RORgammat directs the differentiation program of proinflammatory IL-17+ T helper cells. Cell 126, 1121–1133 [DOI] [PubMed] [Google Scholar]
- 7. Fontenot J. D., Gavin M. A., and Rudensky A. Y. (2003) Foxp3 programs the development and function of CD4+CD25+ regulatory T cells. Nat. Immunol. 4, 330–336 [DOI] [PubMed] [Google Scholar]
- 8. Hori S., Nomura T., and Sakaguchi S. (2003) Control of regulatory T cell development by the transcription factor Foxp3. Science 299, 1057–1061 [DOI] [PubMed] [Google Scholar]
- 9. Oestreich K. J., and Weinmann A. S. (2012) Master regulators or lineage-specifying? Changing views on CD4+ T cell transcription factors. Nat. Rev. Immunol. 12, 799–804 [DOI] [PMC free article] [PubMed] [Google Scholar]
- 10. Zhou L., Chong M. M., and Littman D. R. (2009) Plasticity of CD4+ T cell lineage differentiation. Immunity 30, 646–655 [DOI] [PubMed] [Google Scholar]
- 11. Wan Y. Y. (2010) Multi-tasking of helper T cells. Immunology 130, 166–171 [DOI] [PMC free article] [PubMed] [Google Scholar]
- 12. O'Shea J. J., and Paul W. E. (2010) Mechanisms underlying lineage commitment and plasticity of helper CD4+ T cells. Science 327, 1098–102 [DOI] [PMC free article] [PubMed] [Google Scholar]
- 13. Murphy K. M., and Stockinger B. (2010) Effector T cell plasticity: Flexibility in the face of changing circumstances. Nat. Immunol. 11, 674–680 [DOI] [PMC free article] [PubMed] [Google Scholar]
- 14. Peine M., Rausch S., Helmstetter C., Fröhlich A., Hegazy A. N., Kühl A. A., Grevelding C. G., Höfer T., Hartmann S., and Löhning M. (2013) Stable T-bet(+)GATA-3(+) Th1/Th2 hybrid cells arise in vivo, can develop directly from naive precursors, and limit immunopathologic inflammation. PLos Biol. 11, e1001633. [DOI] [PMC free article] [PubMed] [Google Scholar]
- 15. Duhen T., and Campbell D. J. (2014) IL-1beta promotes the differentiation of polyfunctional human CCR6+CXCR3+ Th1/17 cells that are specific for pathogenic and commensal microbes. J. Immunol. 193, 120–129 [DOI] [PMC free article] [PubMed] [Google Scholar]
- 16. Rosengren A. T., Nyman T. A., and Lahesmaa R. (2005) Proteome profiling of interleukin-12 treated human T helper cells. Proteomics 5, 3137–3141 [DOI] [PubMed] [Google Scholar]
- 17. Moulder R., Lönnberg T., Elo L. L., Filén J. J., Rainio E., Corthals G., Oresic M., Nyman T. A., Aittokallio T., and Lahesmaa R. (2010) Quantitative proteomics analysis of the nuclear fraction of human CD4+ cells in the early phases of IL-4-induced Th2 differentiation. Mol. Cell. Proteomics 9, 1937–1953 [DOI] [PMC free article] [PubMed] [Google Scholar]
- 18. Filén J. J., Filén S., Moulder R., Tuomela S., Ahlfors H., West A., Kouvonen P., Kantola S., Björkman M., Katajamaa M., Rasool O., Nyman T. A., and Lahesmaa R. (2009) Quantitative proteomics reveals GIMAP family proteins 1 and 4 to be differentially regulated during human T helper cell differentiation. Mol. Cell. Proteomics 8, 32–44 [DOI] [PMC free article] [PubMed] [Google Scholar]
- 19. Loyet K. M., Ouyang W., Eaton D. L., and Stults J. T. (2005) Proteomic profiling of surface proteins on Th1 and Th2 cells. J Proteome Res. 4, 400–409 [DOI] [PubMed] [Google Scholar]
- 20. Rautajoki K., T.A. Nyman T. A., and Lahesmaa R. (2004) Proteome characterization of human T helper 1 and 2 cells. Proteomics 4, 84–92 [DOI] [PubMed] [Google Scholar]
- 21. Olsen I., Tollefsen S., Aagaard C., Reitan L. J., Bannantine J. P., Andersen P., Sollid L. M., and Lundin K. E. (2009) Isolation of Mycobacterium avium subspecies paratuberculosis reactive CD4 T cells from intestinal biopsies of Crohn's disease patients. PLoS ONE 4, e5641. [DOI] [PMC free article] [PubMed] [Google Scholar]
- 22. Olsen I., Lundin K. E., and Sollid L. M. (2013) Increased frequency of intestinal CD4+ T cells reactive with mycobacteria in patients with Crohn's disease. Scand. J. Gastroenterol 48, 1278–1285 [DOI] [PMC free article] [PubMed] [Google Scholar]
- 23. Annunziato F., Cosmi L., Santarlasci V., Maggi L., Liotta F., Mazzinghi B., Parente E., Filì L., Ferri S., Frosali F., Giudici F., Romagnani P., Parronchi P., Tonelli F., Maggi E., and Romagnani S. (2007) Phenotypic and functional features of human Th17 cells. J. Exp. Med. 204, 1849–1861 [DOI] [PMC free article] [PubMed] [Google Scholar]
- 24. Christensen G. L., Kelstrup C. D., Lyngsø C., Sarwar U., Bøgebo R., Sheikh S. P., Gammeltoft S., Olsen J. V., and Hansen J. L. (2010) Quantitative phosphoproteomics dissection of seven-transmembrane receptor signaling using full and biased agonists. Mol. Cell. Proteomics 9, 1540–1553 [DOI] [PMC free article] [PubMed] [Google Scholar]
- 25. Wiśniewski J. R., Zougman A., and Mann M. (2009) Combination of FASP and StageTip-based fractionation allows in-depth analysis of the hippocampal membrane proteome. J. Proteome Res. 8, 5674–5678 [DOI] [PubMed] [Google Scholar]
- 26. Cox J., and Mann M. (2008) MaxQuant enables high peptide identification rates, individualized p.p.b.-range mass accuracies and proteome-wide protein quantification. Nat. Biotechnol. 26, 1367–1372 [DOI] [PubMed] [Google Scholar]
- 27. Deeb S. J., D'Souza R. C., Cox J., Schmidt-Supprian M., and Mann M. (2012) Super-SILAC allows classification of diffuse large B-cell lymphoma subtypes by their protein expression profiles. Mol. Cell. Proteomics 11, 77–89 [DOI] [PMC free article] [PubMed] [Google Scholar]
- 28. Appay V., Zaunders J. J., Papagno L., Sutton J., Jaramillo A., Waters A., Easterbrook P., Grey P., Smith D., McMichael A. J., Cooper D. A., Rowland-Jones S. L., and Kelleher A. D. (2002) Characterization of CD4(+) CTLs ex vivo. J. Immunol. 168, 5954–5958 [DOI] [PubMed] [Google Scholar]
- 29. van Leeuwen E. M., Remmerswaal E. B., Vossen M. T., Rowshani A. T., Wertheim-van Dillen P. M., van Lier R. A., and ten Berge I. J. (2004) Emergence of a CD4+CD28- granzyme B+, cytomegalovirus-specific T cell subset after recovery of primary cytomegalovirus infection. J. Immunol. 173, 1834–1841 [DOI] [PubMed] [Google Scholar]
- 30. Kobayashi T., Okamoto S., Iwakami Y., Nakazawa A., Hisamatsu T., Chinen H., Kamada N., Imai T., Goto H., and Hibi T. (2007) Exclusive increase of CX3CR1+CD28-CD4+ T cells in inflammatory bowel disease and their recruitment as intraepithelial lymphocytes. Inflamm. Bowel Dis. 13, 837–846 [DOI] [PubMed] [Google Scholar]
- 31. Camus M., Esses S., Pariente B., Le Bourhis L., Douay C., Chardiny V., Mocan I., Benlagha K., Clave E., Toubert A., Mayer L., and Allez M. (2014) Oligoclonal expansions of mucosal T cells in Crohn's disease predominate in NKG2D-expressing CD4 T cells. Mucosal Immunol. 7, 325–334 [DOI] [PubMed] [Google Scholar]
- 32. Zaguia F., Saikali P., Ludwin S., Newcombe J., Beauseigle D., McCrea E., Duquette P., Prat A., Antel J. P., and Arbour N. (2013) Cytotoxic NKG2C+ CD4 T cells target oligodendrocytes in multiple sclerosis. J. Immunol. 190, 2510–2518 [DOI] [PubMed] [Google Scholar]
- 33. Andersen M. H., Schrama D., Thor Straten P., and Becker J. C. (2006) Cytotoxic T cells. J. Invest. Dermatol. 126, 32–41 [DOI] [PubMed] [Google Scholar]
- 34. Mahon B. P., Katrak K., Nomoto A., Macadam A. J., Minor P. D., and Mills K. H. (1995) Poliovirus-specific CD4+ Th1 clones with both cytotoxic and helper activity mediate protective humoral immunity against a lethal poliovirus infection in transgenic mice expressing the human poliovirus receptor. J. Exp. Med. 181, 1285–1292 [DOI] [PMC free article] [PubMed] [Google Scholar]
- 35. Norris P. J., Sumaroka M., Brander C., Moffett H. F., Boswell S. L., Nguyen T., Sykulev Y., Walker B. D., and Rosenberg E. S. (2001) Multiple effector functions mediated by human immunodeficiency virus-specific CD4(+) T-cell clones. J. Virol. 75, 9771–9779 [DOI] [PMC free article] [PubMed] [Google Scholar]
- 36. Fleischer B., (1984) Acquisition of specific cytotoxic activity by human T4+ T lymphocytes in culture. Nature 308, 365–367 [DOI] [PubMed] [Google Scholar]
- 37. Appay V., (2004) The physiological role of cytotoxic CD4(+) T-cells: The holy grail? Clin. Exp. Immunol. 138, 10–13 [DOI] [PMC free article] [PubMed] [Google Scholar]
- 38. Mariani P., Bachetoni A., D'Alessandro M., Lomanto D., Mazzocchi P., and Speranza V. (2000) Effector Th-1 cells with cytotoxic function in the intestinal lamina propria of patients with Crohn's disease. Dig. Dis. Sci. 45, 2029–2035 [DOI] [PubMed] [Google Scholar]
- 39. Allez M., Tieng V., Nakazawa A., Treton X., Pacault V., Dulphy N., Caillat-Zucman S., Paul P., Gornet J. M., Douay C., Ravet S., Tamouza R., Charron D., Lémann M., Mayer L., and Toubert A. (2007) CD4+NKG2D+ T cells in Crohn's disease mediate inflammatory and cytotoxic responses through MICA interactions. Gastroenterology 132, 2346–2358 [DOI] [PubMed] [Google Scholar]
- 40. van Leeuwen E. M., Remmerswaal E. B., Heemskerk M. H., Berge I. J., and van Lier R. A. (2006) Strong selection of virus-specific cytotoxic CD4+ T-cell clones during primary human cytomegalovirus infection. Blood 108, 3121–3127 [DOI] [PubMed] [Google Scholar]
- 41. Gerli R., Schillaci G., Giordano A., Bocci E. B., Bistoni O., Vaudo G., Marchesi S., Pirro M., Ragni F., Shoenfeld Y., and Mannarino E. (2004) CD4+CD28- T lymphocytes contribute to early atherosclerotic damage in rheumatoid arthritis patients. Circulation 109, 2744–2748 [DOI] [PubMed] [Google Scholar]
- 42. Ballard B. R., and M'Koma A. E. (2015) Gastrointestinal endoscopy biopsy derived proteomic patterns predict indeterminate colitis into ulcerative colitis and Crohn's colitis. World J. Gastrointest Endosc. 7, 670–674 [DOI] [PMC free article] [PubMed] [Google Scholar]
- 43. M'Koma A. E., Seeley E. H., Washington M. K., Schwartz D. A., Muldoon R. L., Herline A. J., Wise P. E., and Caprioli R. M. (2011) Proteomic profiling of mucosal and submucosal colonic tissues yields protein signatures that differentiate the inflammatory colitides. Inflamm. Bowel Dis. 17, 875–883 [DOI] [PMC free article] [PubMed] [Google Scholar]
- 44. Hatsugai M., Kurokawa M. S., Kouro T., Nagai K., Arito M., Masuko K., Suematsu N., Okamoto K., Itoh F, and Kato T. (2010) Protein profiles of peripheral blood mononuclear cells are useful for differential diagnosis of ulcerative colitis and Crohn's disease. J. Gastroenterol. 45, 488–500 [DOI] [PubMed] [Google Scholar]
- 45. Mucida D., Husain M. M., Muroi S., van Wijk F., Shinnakasu R., Naoe Y., Reis B. S., Huang Y., Lambolez F., Docherty M., Attinger A., Shui J. W., Kim G., Lena C. J., Sakaguchi S., Miyamoto C., Wang P., Atarashi K., Park Y., Nakayama T., Honda K., Ellmeier W., Kronenberg M., Taniuchi I., and Cheroutre H. (2013) Transcriptional reprogramming of mature CD4(+) helper T cells generates distinct MHC class II-restricted cytotoxic T lymphocytes. Nat. Immunol. 14, 281–289 [DOI] [PMC free article] [PubMed] [Google Scholar]
- 46. Reis B. S., Rogoz A., Costa-Pinto F. A., Taniuchi I., and Mucida D. (2013) Mutual expression of the transcription factors Runx3 and ThPOK regulates intestinal CD4(+) T cell immunity. Nat. Immunol. 14, 271–280 [DOI] [PMC free article] [PubMed] [Google Scholar]
- 47. Qui H. Z., Hagymasi A. T., Bandyopadhyay S., St. Rose M. C., Ramanarasimhaiah R. Ménoret, A., Mittler R. S., Gordon S. M., Reiner S. L., Vella A. T., and Adler A. J. (2011) CD134 plus CD137 dual costimulation induces Eomesodermin in CD4 T cells to program cytotoxic Th1 differentiation. J. Immunol. 187, 3555–3564 [DOI] [PMC free article] [PubMed] [Google Scholar]
- 48. Zamisch M., Tian L., Grenningloh R., Xiong Y., Wildt K. F., Ehlers M., Ho I. C., and Bosselut R. (2009) The transcription factor Ets1 is important for CD4 repression and Runx3 up-regulation during CD8 T cell differentiation in the thymus. J. Exp. Med. 206, 2685–2699 [DOI] [PMC free article] [PubMed] [Google Scholar]
- 49. Nitta T., Nasreen M., Seike T., Goji A., Ohigashi I., Miyazaki T., Ohta T., Kanno M., and Takahama Y. (2006) IAN family critically regulates survival and development of T lymphocytes. PLos Biol. 4, e103. [DOI] [PMC free article] [PubMed] [Google Scholar]
- 50. Chen Y., Yu M., Dai X., Zogg M., Wen R., Weiler H., and Wang D. (2011) Critical role for Gimap5 in the survival of mouse hematopoietic stem and progenitor cells. J. Exp. Med. 208, 923–935 [DOI] [PMC free article] [PubMed] [Google Scholar]
- 51. Schulteis R. D., Chu H., Dai X., Chen Y., Edwards B., Haribhai D., Williams C. B., Malarkannan S., Hessner M. J., Glisic-Milosavljevic S., Jana S., Kerschen E. J., Ghosh S., Wang D., Kwitek A. E., Lernmark A., Gorski J., and Weiler H. (2008) Impaired survival of peripheral T cells, disrupted NK/NKT cell development, and liver failure in mice lacking Gimap5. Blood 112, 4905–4914 [DOI] [PMC free article] [PubMed] [Google Scholar]
- 52. Lim M. K., Sheen D. H., Kim S. A., Won S. K., Lee S. S., Chae S. C., Chung H. T., and Shim S. C. (2009) IAN5 polymorphisms are associated with systemic lupus erythematosus. Lupus 18, 1045–1052 [DOI] [PubMed] [Google Scholar]
- 53. Lee Y. J., Horie Y., Wallace G. R., Choi Y. S., Park J. A., Choi J. Y., Song R., Kang Y. M., Kang S. W., Baek H. J., Kitaichi N., Meguro A., Mizuki N., Namba K., Ishida S., Kim J., Niemczyk E., Lee E. Y., Song Y. W., Ohno S., and Lee E. B. (2013) Genome-wide association study identifies GIMAP as a novel susceptibility locus for Behcet's disease. Ann. Rheum. Dis. 72, 1510–1516 [DOI] [PubMed] [Google Scholar]
- 54. Broux B., Pannemans K., Zhang X., Markovic-Plese S., Broekmans T., Eijnde B. O., Van Wijmeersch B., Somers V., Geusens P., van der Pol S., van Horssen J., Stinissen P., and Hellings N. (2012) CX(3)CR1 drives cytotoxic CD4(+)CD28(-) T cells into the brain of multiple sclerosis patients. J. Autoimmun. 38, 10–19 [DOI] [PubMed] [Google Scholar]
Associated Data
This section collects any data citations, data availability statements, or supplementary materials included in this article.