

Abstract
Histones, and their modifications, are critical components of cellular programming and epigenetic inheritance. Recently, cancer genome sequencing has uncovered driver mutations in chromatin modifying enzymes spurring high interest how such mutations change histone modification patterns. Here, we applied Top-Down mass spectrometry for the characterization of combinatorial modifications (i.e. methylation and acetylation) on full length histone H3 from human cell lines derived from multiple myeloma patients with overexpression of the histone methyltransferase MMSET as the result of a t(4;14) chromosomal translocation. Using the latest in Orbitrap-based technology for clean isolation of isobaric proteoforms containing up to 10 methylations and/or up to two acetylations, we provide extensive characterization of histone H3.1 and H3.3 proteoforms. Differential analysis of modifications by electron-based dissociation recapitulated antagonistic crosstalk between K27 and K36 methylation in H3.1, validating that full-length histone H3 (15 kDa) can be analyzed with site-specific assignments for multiple modifications. It also revealed K36 methylation in H3.3 was affected less by the overexpression of MMSET because of its higher methylation levels in control cells. The co-occurrence of acetylation with a minimum of three methyl groups in H3K9 and H3K27 suggested a hierarchy in the addition of certain modifications. Comparative analysis showed that high levels of MMSET in the myeloma-like cells drove the formation of hypermethyled proteoforms containing H3K36me2 co-existent with the repressive marks H3K9me2/3 and H3K27me2/3. Unique histone proteoforms with such “trivalent hypermethylation” (K9me2/3-K27me2/3-K36me2) were not discovered when H3.1 peptides were analyzed by Bottom-Up. Such disease-correlated proteoforms could link tightly to aberrant transcription programs driving cellular proliferation, and their precise description demonstrates that Top-Down mass spectrometry can now decode crosstalk involving up to three modified sites.
The field of epigenetics has seen an explosion of research in the past decade as scientists from different fields discovered its critical roles in many aspects related to human health, ranging from stem cell pluripotency to aging (1–3), from cancer to microbial infection (4–8), from memory processing to drug addiction (9, 10). Histone modifications, including methylation (me), acetylation (ac), monoubiquitylation (ub1), etc., are related to the study of epigenetics (11, 12). These modifications, as well as their different states in case of methylation (i.e. mono-, di-, and trimethylation) and positions on the histone, play important and distinct roles in almost every activity operative on the chromatin template. The significance of these modifications are further underscored by the unexpected identification of many driver mutations underlying cancer biology within histone modifying enzymes (13, 14) and somatic mutations in histone H3.3 (7, 15, 16).
Widely used antibody-based measurements of histone modifications face two analytical challenges: (1) similar chemical structure of modification (e.g. three distinct methylation states of mono-, di-, and tri-methylation) and closely related flanking sequence can lead to cross-reactivity (17); (2) close proximity of many modifications can have unexpected effects in antibody recognition (18). For example, H4K20me2 antibody can lose its recognition when acetylation is present in the neighboring H4K16 (19). Therefore, analyzing histone modifications by MS can provide a highly valuable orthogonal measurement. There are two general modes of interrogation by MS: Bottom-Up analysis of tryptic peptides, and Top-Down or Middle-Down measurement of full-length histones or large tail peptides, respectively (20). The value of mass spectrometric analysis of histone modifications in the field of cancer epigenetics was further demonstrated by the recent identification of a recurrent point mutation of E1099K in MMSET in lymphoid malignancies (8, 21).
The “histone code” hypothesis posits that the combinatorial nature of histone modifications can serve as the binding platform to elicit specific cellular processes (22). Recently, the combination of modifications has been used to define chromatin states, which are generated from meta-analysis of multiple ChIP-Seq data sets and found to be highly dynamic among different cell lines (23). However, this type of antibody-based technique relies on the associated DNA sequence to infer PTM co-occurrence from an average of histone modifications in the same locus but not necessarily on the same molecule.
MMSET (also known as NSD2 or WHSC1) is one of the eight known histone methyltransferases targeting H3K36 (24) with specificity toward dimethylation (25). Overexpression of MMSET has been documented in ∼20% of multiple myeloma cases as the result of chromosomal translocation t(4;14) (26), which places the MMSET gene under the strong immunoglobulin enhancers (27). A pair of cell lines, TKO and NTKO, were engineered from a t(4;14)+ multiple myeloma patient-derived cell line, KMS11. In the targeted knockout (TKO)1 cell line, the translocated copy of MMSET was knocked out by homologous recombination, which leads to close to normal expression level of MMSET. In the nontargeted knockout (NTKO) cell line, the non-translocated gene was knocked out and the expression level of MMSET remains high (28). Our quantitative Bottom-Up MS assay using selective reaction monitoring revealed how overexpression of a HMT targeting H3K36 led to the global changes in both H3K27 and H3K36 methylation (29–31). Here, our goal was to make differential Top-Down measurement of two histone H3 variants, whose synthesis is (H3.1) and is not (H3.3) dependent on replication during S phase (32).
To directly catalogue modifications co-occurring on the same histone (i.e. combinatorial modifications), we have reported Top-Down MS analysis of all histones (33–37) and Middle-Down MS for 1–50 N-terminal piece of histone H3 (5.3 kDa) (38). Great efforts from many laboratories also continue to improve the utility of Top-Down and Middle-Down MS for histone analysis (39–44). However, it is still very challenging to apply Top-Down approach for the routine analysis of histone proteoforms (45). This was demonstrated in the first pilot project from the Consortium for Top-Down Proteomics to assess intra-laboratory variation in the characterization of histone H4 (46). One of the key limitations identified in that study was a need for continued improvement in high-resolution isolation and high-efficiency fragmentation. These two critical aspects for high quality proteoform characterization align with the development of a new Orbitrap-based tribrid mass spectrometer, whose architecture includes a segmented quadrupole for narrow precursor isolation with high transmission efficiency, improved vacuum conditions, and the optimization of multiple ion dissociation techniques including electron transfer dissociation (ETD) (47), higher-energy collisional dissociation (HCD) (48) and their combination (EThcD) (49, 50). Therefore, we aimed to develop proper workflow and informatic tools to enable Top-Down comparative interrogation of the most highly modified core histone, H3, upon cellular perturbation.
EXPERIMENTAL PROCEDURES
Cell Culture, Histone Extraction and RP-HPLC Fractionation
KMS11 TKO and NTKO cells were cultured in RPMI media supplemented with 10% FBS (Sigma, St. Louis, MI). Harvested cells were flash frozen in liquid nitrogen and stored at −80 °C before sample preparation. Nuclei were isolated with NIB buffer (15 mm Tris, 60 mm KCl, 15 mm NaCl, 5 mm MgCl2, 1 mm CaCl2, 250 mm Sucrose, 0.5 mm 4-(2-aminoethyl)benzenesulfonyl fluoride hydrochloride (AEBSF), 10 mm sodium butyrate, and 1 mm DTT, pH 7.5) containing 0.3% Nonidet P-40 and subsequently washed twice with NIB buffer without detergent. Isolated nuclei were recovered by centrifugation at 600 rcf. Crude histones were extracted from isolated nuclei with 0.4 N H2SO4 and recovered by precipitation with 20% (w/v, final) trichloroacetic acid (TCA). The precipitate was washed first with 0.1% HCl in acetone and twice with pure acetone. Crude histones were then resuspended in water and subjected to fractionation using reverse phase high pressure liquid chromatography (RP-HPLC) as described previously (51). Briefly, histones were separated using a Jupiter C18 analytical column (Phenomenex, Torrance, CA), 15 cm × 4.6 mm, 5 μm diam., 300 Å pores, using a gradient of 30–57% B in 90 min (Buffer A: 5% ACN, 0.1% TFA; Buffer B: 90% ACN, 0.094% TFA) at a flow rate of 0.8 ml/min using an Agilent 1100 HPLC system (Agilent, Santa Clara, CA) monitored by UV absorbance at 214 nm. Fractionated histone H3.1 and H3.3 were collected and dried by speed-vacuum.
Mass Spectrometry
Dried histone pellets were resuspended in 49.95:49.95:0.1 (v:v:v) water/acetonitrile/formic acid (LC-MS grade) at ∼1 μm final concentration, and were sprayed using a NanoFlex ion source (Thermo Fisher Scientific, San Jose, CA) equipped with a nanoelectrospray static probe and coated glass emitters, applying a 1.7–1.9 kV potential at the emitter. All mass spectrometry measurements were performed on an fETD-enabled (52) Orbitrap Fusion Lumos mass spectrometer (Thermo Fisher Scientific) operating in Intact Protein Mode (N2 pressure at the ion routing multipole of 1 mTorr), using a resolving power of 60,000 (at m/z 200) and averaging five microscans for every scan, with transfer capillary temperature set at 275 °C, the RF of the source ion funnel operating at 20% and a source offset of 15 V to favor adduct removal. For each histone fraction, broadband MS1 spectra were recorded over a 500–2000 m/z window using an AGC target value of 2e5. MS1 spectra were used to define a list of histone proteoform peaks differing in mass for ∼14 Da, corresponding to the mass of one methylation. The list included m/z values corresponding to the most abundant isotopic distribution for each isobaric proteoform cluster. MS2 experiments were based on the isolation and subsequent fragmentation of each of these clusters for the 18+ precursor. Each proteoform cluster was quadrupole isolated using a 0.6 Th isolation window, and subjected sequentially first to high capacity ETD (ETD HD) performed with increasing duration, and then to EThcD, performed as previously described (50). Ion–ion interaction times in ETD ranged from 1 to 7 ms, whereas EThcD was performed at a fixed ETD duration of 2 ms varying only the axial potential applied to the ion routing multipole from 10 to 15 V. All MS2 data were collected over a 300–2000 m/z window, using AGC target values of 1e6 and 7e5 for precursor and fluoranthene, respectively. The maximum injection time was set to 2000 ms. Spectra obtained for each MS2 condition were recorded for a fixed duration of 1 min.
Data Analysis
For the semiquantitative analysis of MS2 spectra, the sequences of H3.1 and H3.3 were used to create a list of all theoretical fragment ions with a PTM set including 0–8 methylations and 0–3 acetylations, and charge states from 1 to 18+: c'- and z●-type ions (hereinafter referred to simply as c- and z-ions) were considered for ETD experiment, whereas for EThcD (53) the list included c-, z-, b-, and y-type ions. ETD MS2 spectra were averaged so that two final spectra were obtained: one including experiments with ETD durations from 1 to 4 ms, and a second from 5 to 7 ms; EThcD spectra obtained at 10 and 15 V were also averaged. Ultimately, three MS2 spectra were searched for each proteoform cluster: (1) ETD 1–4 ms, (2) ETD 5–7 ms, and (3) EThcD. An isotope fitting algorithm (54) developed in-house was used for matching experimental product ions with a signal-to-noise ratio ≥3 with the theoretical isotopic distribution of any product ion included in the above described list, generated using the that ion's chemical formula. Matched ion information, including spectral intensity, was stored as a Microsoft Excel file for further processing (see Results section). Fragmentation maps of selected proteoforms were generated using ProSight Lite (55), freely available at the URL, http://prosightlite.northwestern.edu.
RESULTS
Direct Infusion Mass Spectrometry of RP-HPLC Purified Histone H3.1 and H3.3
Although all three H3 variants are fully separable by RP-HPLC (supplemental Fig. S1B), we focused primarily on H3.1 and H3.3 which differ in only five residues (supplemental Fig. S1A). We observed a ∼20% increase of H3.3 and a ∼10% increase of H3.2 counterbalanced by ∼25% loss of H3.1 in MMSET-High NTKO cells compared with TKO (supplemental Fig. S1B). Hereafter, TKO and NTKO will be simply referred to as MMSET-Low and MMSET-High, respectively. Seeking a simple Top-Down approach to decode abundant proteoforms, we directly infused these fractionated histones and observed familiar charge state distributions ranging from 25+ to 14+ for H3.1 (supplemental Fig. S2) and many isotopic distributions corresponding to 0–18 methylations in most charge states (Fig. 1). Because higher charge state favors ETD efficiency but complicates precursor isolation because of reduced m/z space between neighboring proteoform clusters, we proceeded with charge state 18+ for this study (supplemental Fig. S2, inset). A comparison of data from the full MS for the 18+ ions of H3.1 and H3.3 variants from MMSET-Low and MMSET-High cells is shown in Fig. 1. Each peak differs by ∼14 Da as the result of methylation (+14.0157 Da) and/or acetylation (+42.0471 Da). Because the mass difference between trimethylation and acetylation is only 0.036 Da, it is difficult to distinguish them using MS1 data. For this reason, we refer to these clusters of isobaric proteoforms by the number of “methyl equivalents” they contain (38) or “Methyl-Eqs” for short. The mass of the lowest mass isotopic distribution matches unmodified H3, so is Methyl-Eq 0. Overall, in the four samples interrogated here, we observed up to 18 Methyl-Eqs, with a distribution centered on Methyl-Eq 6. In the presence of MMSET overexpression, the distribution of Methyl-Eqs is narrowly centered on Methyl-Eq 6, whereas in the case of low MMSET the distribution is broader, with Methyl-Eqs 5 and 7 being as abundant as Methyl-Eq 6, a change more apparent for H3.1 than for H3.3. (Fig. 1).
Fig. 1.

Full MS scan of charge state 18+ of histone variants H3. 1 and H3.3 from MMSET-Low (upper panels) and MMSET-High (lower panels) cells. Each peak was defined as a methyl equivalent because they differ by ∼14 Da as the results of methylation and acetylation. A total of 18 methyl equivalents were observed for all four samples, with the first peak matching the mass of completely unmodified H3.1 (left panels) and H3.3 (right panels).
Multiple Proteoforms Within an Isobaric Mixture
Proteoform is a term recently proposed to describe all sources of combinatorial variation in intact proteins, including post-translational modifications and/or sequence differences (45). To be consistent with this definition, we refer to histone proteoforms when describing a characterization of all the modifications present within the same intact molecule. By contrast, combinatorial modifications define the co-existence of any number of modifications that is greater than two on proteolytic peptides or intact proteins. For example, we have identified 15 combinatorial modifications of H3K27 and H3K36 methylation in our previous Bottom-Up study of peptides from H3.1 and H3.2 containing residues 27 to 40, without knowing the modification status beyond this region (29). In this study, we were able to achieve a clean isolation of each Methyl-Eq by virtue of the 0.6 Th isolation window, which ensured the MS2 spectra were derived from a single isolated precursor. An example of this clean isolation of Methyl-Eq 3 is shown in Fig. 2A. We then carried out MS2 experiment using ETD to determine the proteoform(s) present in the isolated precursor. Examples of four c-type ions from ETD experiment for the Methyl-Eq 3 precursor are displayed in Fig. 2B. Only one peak was identified as a c8 product ion, and matched this region of H3.1 within −1.2 ppm (first inset of Fig. 2B, peak annotated as “unmod”). Four peaks were observed as c10 ions, matching multiple H3.1 proteoforms carrying either no modification, or 1, 2, or 3 methyl groups in the region from residue 1 to 10 (second inset of Fig. 2B, unmod, 1me, 2me, and 3me). On the other hand, only two sets of peaks (of different charge states) were found for the c28 ion, with the majority of them matching H3.1 proteoforms carrying three methyl groups in the region from residue 1 to 28 (simply called c28-3me) together with small amount of c28-2me. Because “meX” (i.e. me1, me2, and me3) are precise terms in the literature to represent “X” number of methyl groups attached to a single amino acid residue, we use “Xme” to indicate “X” number of methyl group present in a single or multiple sites within a certain portion of the protein sequence. Multiple H3.1 proteoforms, such as K4me1-K9me1-K27me1, K9me1-K27me2, or K27me3, can all generate the c28-3me ion. It is also worth emphasizing that the average mass error of c36-3me ions from averaging multiple ETD MS2 spectra is −1.7 ppm (i.e. −0.006 Da mass error), allowing the confident assignment of three methyl groups instead of one acetyl group.
Fig. 2.

Determination of the major proteoforms in Methyl Equivalents 3 of H3. 1 from MMSET-Low cells. A, Precursors with 3 Methyl Equivalents were isolated using a quadrupole isolation window of 0.6 Th. B, Examples of c ions from ETD spectra and their matched modifications. C, Summed intensities of matched fragment ions observed in MS2 were plotted across the H3.1 sequence to generate the fragment ion bar graph. D, Graphic presentation and scores of major proteoforms determined from ETD-MS2 by ProSight Lite (PCS, proteoform characterization score). Green, cyan, and purple squares indicate mono-, di-, and tri-methylation respectively. Red fragment ion flags: c and z ions.
Determination of Major Proteoforms From Isobaric Precursors Using MS2 Intensities
The intensities of all matched c-type fragment ions from different charge states were summed to generate fragment ion bar graphs (as in Fig. 2C). For Methyl-Eq 3, no methyl group was found before ion c9, indicating the lack of any modification from residue A1 to R8. Four different modification states were found in c ions starting from residue K9 and their levels were quite stable until reaching K27, where c27-3me became dominant. The increase of methyl groups in fragment ions from R8 to K9 and from R26 to K27 (c8-0me → c9-0,1,2,3me and c26-0,1,2,3me → c27-2,3me, Fig. 2C) provides evidence of methylations occurring at both K9 and K27. Because there is no modification alternation before c9 and very small changes are observed after c27, three methyl groups in Methyl-Eq 3 precursor are primarily localized on K9 and K27. Taken together, we determined that K9me2-K27me1, K9me1-K27me2, and K27me3 are the three major proteoforms in Methyl-Eq 3 from H3.1 in MMSET-Low cells. The graphical representations of matched c and z ions from ETD MS2 for these three proteoforms are shown in Fig. 2D. The great sequence coverage and excellent scores strongly support the existence of these three proteoforms. Beyond matching fragment ion masses, the fragment ion bar graphs used for quantitative reporting of H3 can assist characterization of isobaric proteoforms by tracking changes in specific regions of sequence; for example, a lack of change in comparing c27 to c36 ions indicates that no major modification occupancy exists within this region (including at K36) within proteoforms from Methyl-Eq 3 of H3.1 in MMSET-Low cells (Fig. 2C). The above procedures and nomenclature were used throughout this work to detect major changes in the Methy-Eqs 0–8 on histone H3.1 and H3.3.
Mapping Methylation and Acetylation in a Single Sample
Using the approach to the Methyl-Eq 3 outlined above, fragment ion graphs for proteoform clusters with Methyl-Eqs 1 to 10 from H3.1 in MMSET-Low cells were generated (Fig. 3). Similarly to Methyl-Eq 3, no modification before c9 ion was observed, except for Methyl-Eq 10. In addition, most of the modifications appear in the region between c9 and c27, or between c9 and c36 in Methyl-Eqs 5 and 8. Because mass resolution and accuracy in MS2 are enough to distinguish acetylation from trimethylation, we were able to assign specific modifications whereas ambiguity is present for MS1 data. To our delight, it was far less complicated than one would expect from the random combination of acetylation and methylation. The first 10 methyl equivalents of H3.1 from MMSET-Low cells can be divided into three groups according to the number of acetyl moieties contained. The first group includes Methyl-Eqs 1 to 5 that have no acetylation. The second group contains Methyl-Eqs 6 to 8, which carry one acetyl group together with three to five methyl groups. For this second group, we observed the co-occurrence of acetylation only when ≥3 methyl groups in H3K9 and H3K27, suggesting a hierarchy of modifications in this region. The third group is composed of Methyl-Eqs 9 and 10 having two acetyl groups with three or four methyl groups, respectively. Overall, methylation in H3.1 from MMSET-Low cells is rather concentrated in K9 and K27 (1–4 methyl groups with or without acetyl groups). Major monomethylation appears in K36 when there are four methyl groups present in K9 and K27, together with or without acetyl groups (Methyl-Eqs 5 and 8, respectively, Fig. 3).
Fig. 3.

Fragment ion graphs of methyl equivalents from 1 to 10 in H3. 1 variant of MMSET-Low cells. Averaged MS2 spectra intensities from all matched c ions were plotted with absolute intensity in y axis and cleavage sites in x axis. Color bars represent different combinatorial modifications of methylation and acetylation from data base search. Most modification patterns (represented by color bars) changes were occurred between c9 and c27 ions (first two columns) except Methyl-Eq 5 and 8 (third column), where changes occurred between c9 and c36. One acetylation was observed in Methyl-Eq 6–8 (third row) and two acetylations in Methyl-Eq 9–10 (fourth row). No modification was found in all c ions before c8 ion (including c8, indicated by arrows) except 4% of single methyl in c8 from Methyl-Eq 10.
The identical three groups described above are also present in H3.3 from MMSET-Low cells (supplemental Fig. S3), except containing higher amount of methylation in K36. By contrast, the overall modification pattern was very different in H3.1 and H3.3 from MMSET-High cells (supplemental Fig. S4). Compared with MMSET-Low cells, the number of maximum methyl groups increases from 5 to 7 and acetylation co-exists with five methyl groups in K9, K27, and K36 (Methyl-Eq 8) instead of three.
Normalized Fragment Ion Graphs to Determine Major Histone Proteoforms
To better visualize the modification patterns in three key residues (K9, K27, and K36), we selected two c-type fragment ions for each of them; these were c10 and c11, c27 and c28, and c36 and c38, respectively. The identity of modifications (i.e. number of methyl groups) in these three overlapping regions (from N terminus to cleavage site), namely K9, K9+K27, and K9+K27+K36, were inferred by matching theoretical fragment masses and further normalized against the total intensities of all ions from the same cleavage site. The means of normalized levels were then used to represent the relative amounts of different modifications shown in Fig. 4. For example, (K9+K27)-1me was calculated by averaging c27-1me/total c27 and c28-1me/total c28. The normalized modification levels from two sets of fragment ions usually agree with each other as indicated by rather small standard deviation. Because of the stochastic nature of the MS2 event, some selected fragment ions were not present in a few cases. However, at least one set of fragment ions was available for the quantitation. It is worth emphasizing that these relative modification levels represent the corresponding modifications in the region from the N terminus to the cleavage site (c-type fragment ions). We use these normalized values to infer the methylation levels in three key residues, K9, K27, and K36, with the assumption that they are major methylation sites in terms of abundance and most acetylation in H3 are localized in K14, K18, and K23 based on previous studies by us and others (51, 56–59). Because methylation of K4 was mostly not observed in H3.1 (Fig. 3 and supplemental Fig. S4A) or present as minor monomethylation in H3.3 (supplemental Fig. S3 and supplemental Fig. S4B), the methyl group(s) present in K4+K9 as shown in Fig. 4 can be interpreted as methylation in K9.
Fig. 4.

Normalized fragment ion graphs of Methyl Equivalents from 0 to 8 using selected two sets of c ions from two cleavage sites. c9 and c10 were used to determine relative modification levels present in K4+K9; c27 and c28 for K4+K9+K27; and c36 and c38 for K4+K9+K27+K36. Mean: average of normalized values calculated within all detected c ions from the same cleavage residue; error bar: standard deviation. Noting that only a single set of c ions was detected in several cases. Methylation Index (MI) = ∑ (%methylation * number of methyl groups). ΔMI(K27) = MI(K27)-MI(K9), ΔMI(K36) = MI(K36)-MI(K27). ΔMI(K9) = MI(K9) with assumption of no major methylation in K4. ΔMI represents the levels of methylation in each site with a range of 0 (completely unmodified) to 3 (all trimethylated). MI and ΔMI are listed in supplemental Table S1.
Localizing multiple methylations at multiple sites from MS2 data is challenging because of “convolving effect” (explained in detail in supplemental Fig. S5). There are three scenarios in reconstructing methylation in three sites from MS2: ambiguous assignment, confident assignment with a possible abundance range, and confident assignment with exact abundance determination(s). Taking Methyl-Eq 3 of H3.1 from MMSET-High (red bar in the third panel of second row in Fig. 4) as an example, the observation of two methyl groups in K9+K27 (fragment ion region 2) does not simply mean K27me2. It could also indicate K9me1-K27me1, and/or K9me2. Moreover, it could be any combination of one, two, or three of these modification forms. In this case, we can only determine possible proteoforms as K9me2-K36me1, K9me1-K27me1-K36me1, and K27me1-K36me2 (listed in italic font in Table I as ambiguous assignment). However, such a convolving effect only happens when region 2 (K9+K27) is heterogeneous with different modifications. If there is only a single modification in region 2, the exact proteoform can be determined. In the case of Methyl-Eq 1 of H3.1 from MMSET-Low (the first panel of first row in Fig. 4), we could not only determine existing proteoforms but also measure their abundance. This category is listed in bold font with abundances within parentheses in Table I. Another example is the case of K9me2-K27me2-K36me2 in Methyl-Eq 6 from MMSET-High cells. With 62% of K9–2me, 88% of (K9+K27)-4me, and 80% of (K9+K27+K36)-6me, the lower boundary of this triple dimethylation is 30% (the minimal level of possible co-occurrence of the three dimethylations). More explicitly, the 30% minimal level of K9me2-K27me2-K36me2 would occur when K9me2 is connected with all of K27 and K36 carrying modifications other than dimethylation; this can be described mathematically as: 62%-(100–88%)-(100–80%), whereas the upper boundary is 62% (i.e. the maximal level of the triply-dimethylated proteoform when all K9me2 is connected with all the K27me2 and K36me2 present). In other words, there is enough overlap of dimethylation across three sites to ensure their coexistence in the same molecule simply based on the abundance of each modification despite the fact that their connectivity was lost in MS2. Overall, we have unambiguously assigned 16 proteoforms of H3.1 in MMSET-Low and 10 in MMSET-High cells (listed in bold font in Table I).
Table I.
Summary of observed histone proteoforms. Observed major proteoforms of histone H3.1 from MMSET-Low (Methyl Equivalents 1 to 10) and MMSET-High cells (Methyl Equivalents 1 to 8). Bold font indicates confidently determined proteoforms and italic font is ambiguous assignments. N.D., not determined
| Methyl-Eq | H3.1 |
|
|---|---|---|
| MMSET-Low | MMSET-High | |
| 1 | K9me1 (∼25%), K27me1 (∼75%) | K9me1 (∼20%), K27me1 (∼5%), K36me1 (∼75%) |
| 2 | K9me2 | K9me2 |
| K27me2 | K36me2 | |
| K9me1-K27me1 | K27me1-K36me1 | |
| K9me1-K27me1 | ||
| K9me1-K36me1 | ||
| 3 | K9me2-K27me1 | K9me2-K36me1 |
| K9me1-K27me2 | K9me1-K27me1-K36me1 | |
| K27me3 | K27me1-K36me2 | |
| 4 | K9me2-K27me2 | K9me2-K36me2 |
| K9me1-K27me3 | K9me2-K27me1-K36me1 | |
| K9me1-K27me1-K36me2 | ||
| K27me2-K36me2 | ||
| 5 | K9me2-K27me2-K36me1 | K9me2-K27me1-K36me2 |
| K9me1-K27me3-K36me1 | K9me2-K27me2-K36me1 | |
| K9me3-K27me1-K36me1 | K9me1-K27me2-K36me2 | |
| K27me3-K36me1-K79me1 | K27me1-K36me3-K79me1 | |
| 6 | K9me2-K18/23ac-K27me1 | K9me2-K27me2-K36me2 |
| K9me1-K18/23ac-K27me2 | K9me1-K27me3-K36me2 | |
| K9me3-K18/23ac | K9me3-K27me1-K36me2 | |
| K9me2-K27me2-K36me1-K79me1 | K9me2-K27me1-K36me2-K79me1 | |
| 7 | K9me2-K18/23ac-K27me2 | K9me2-K27me3-K36me2 |
| K9me1-K18/23ac-K27me3 | K9me1-K27me3-K36me2-K79me1 | |
| K9me3-K27me2-K36me2 | ||
| 8 | K9me2-K18/23ac-K27me3 | K9me2-K18/23ac-K27me1-K36me2 |
| K9me3-K18/23ac-K27me2 | K9me3-K18/23ac-K27me1-K36me1 | |
| K9me2-K18/23ac-K27me2-K36me1 | ||
| K9me2-K18/23ac-K27me1-K36me1-K79me1 | ||
| 9 | K9me2–2ac (K14, K18, K23)-K27me1 | N.D. |
| 10 | K9me2–2ac (K14, K18, K23)-K27me2 | N.D. |
A Unique Proteoform With Trivalent Hypermethylation in MMSET-High Cells
Because H3K9me2/3 and H3K27me2/3 are well known marks for transcriptional repression and H3K36me2 is associated with transcriptional activation and elongation (30), the observation of K9me2-K27me2/3-K36me2 in Methyl-Eqs 6 and 7 from MMSET-High is very intriguing. We named this observation of histone proteoforms with di- and/or tri-methylation at K9, K27, and K36 as “trivalent hypermethylation” to be consistent with the well-known bivalent mark of H3K4me3-K27me3.
The raw MS2 spectra of Methyl-Eq 6 of H3.1 from both MMSET-High and MMSET-Low cells are shown in Fig. 5A. c10-2me, c28-4me, and c36-6me were the major peaks in MMSET-High cells, consistent with the quantitation results shown in normalized fragment ion graph (the sixth panel of second row in Fig. 4). By contrast, the major proteoform of Methyl-Eq 6 in MMSET-Low cells is K9me2-K18/23ac-K27me1 (one acetylation in K18 or K23, as supported by fragment ions shown in Fig. 5B). In addition, the average mass errors for c366+-6me in MMSET-High and c366+-3me+1ac in MMSET-Low cells were −1.7 and 3.0 ppm, respectively. These corresponded to −0.007 Da and 0.011 Da mass errors, which were enough to distinguish trimethylation from acetylation (a 0.036 Da difference). To better characterize proteoforms in Methyl-Eq 6, we also performed EThcD MS2 experiment, where two types of fragmentation techniques, ETD and HCD, are combined. As shown in Fig. 5C, all three dimethylations were well localized by c-type ions with at least one ion immediately before and one after each modified residue as indicated by red fragment ion flags. In addition, b and y ions from HCD provided some complementary fragmentations in the internal region (blue fragment ion flags). The excellent characterization was further demonstrated by great sequence coverage and P-Score (1.2 × 10−112). Consistent with the heterogeneous proteoforms observed in raw ETD MS2 spectra (Fig. 5A) and the normalized fragment ion graph (the sixth panel of second row in Fig. 4), K9me3-K27me1-K36me2 was another proteoform present in Methyl-Eq 6 in MMSET-High H3.1 (Fig. 5C). However, its abundance was much lower, with upper boundary of ∼10% of the trivalent dimethylation proteoform estimated by the difference in K9 methylation using the normalized fragment ion graph (Fig. 4). Similarly, K9me2-K27me3-K36me2 and K9me3-K27me2-K36me2 were found in Methyl-Eq 7 in H3.1 only from MMSET-High cells (the seventh panel of second row in Fig. 4). The raw ETD MS2 spectra and the graphical representation of the fragment ions supporting the existence of these proteoforms arising from trivalent hypermethylation are shown in supplemental Fig. S6. Furthermore, these unique trivalent proteoforms are also present in H3.3 from MMSET-High cells (the fifth and sixth panel of fourth row in Fig. 4).
Fig. 5.

Different proteoforms present in Methyl Equivalent 6 for H3. 1 variant in the presence of MMSET overexpression. A, Raw mass spectrometry data of c ions from ETD-MS2 and their matched modifications. Graphic representation of major proteoforms determined by EThcD and ETD (B) or EThcD alone (C) using ProSight Lite. Green, cyan, and purple squares indicate mono-, di-, and tri-methylation respectively; red square: acetylation; red fragment ion flags: c and z ions; blue fragment ion flags: b and y ions.
Methylation Reporting for Individual Sites Via the Methyl Index
A semi-quantitative measurement of overall methylation occupancy at each site by Top-Down mass spectrometry is an alternative way to roll up the data and complementary to Bottom-Up because the variation in detection efficiency for different histone peptides in Bottom-Up is difficult to control (60). Therefore, we calculated a methyl index (MI) for three key methylation sites from normalized modification levels determined by selected c ions.
 |
The difference of MI from two consecutive sites (Δ MI) was then used to represent the overall levels of methylation in individual sites, namely K9, K27, and K36. Because there is only one value for each site using this scheme, comparing the difference of two consecutive sites becomes straightforward without the problem of convolving effects mentioned above. As shown in supplemental Table S1A, MIs of K36 in Methyl-Eqs 1–5 of both H3.1 and H3.3 from MMSET-Low cells and Methyl-Eqs 1–7 from MMSET-High are very close to the total methyl number identified in precursor. The rest of them were close to methyl equivalents in their respective precursors after adding three methyl equivalents because of the acetylation. The slight deviation from theoretical MIs at K36 was because of the methylation beyond K36, primarily because of K79 methylation. Interestingly, the higher abundance of K79 methylation is associated with hypermethylated H3 (Methyl-Eqs 5–8).
To test the utility of MI analysis for Top-Down data, we compared these results to targeted Bottom-Up quantitation for the identical four samples analyzed above using a Selective Reaction Monitoring (SRM) approach we developed previously to measure relative levels of methylation on five H3 peptides covering K4, K9, K27, K36, and K79 (29). Three interesting patterns were identified from MI analysis. First, less K9 methylation was observed in H3.3 from Methyl-Eqs 2 to 8 in MMSET-Low cells by MI analysis (the first panel of Fig. 6, no K9me2 in Methyl-Eq 1), which is consistent with the SRM result (supplemental Fig. S7). In addition, higher K9 methylation was found in Methyl-Eqs 6 and 7 of H3.1 from MMSET-High cells, where trivalent hypermethylation was present. Second, similar to the previously reported cross-talk between K27 and K36 methylation in H3.1 and H3.2, the degree of antagonism (i.e. increase of K36me2 with the concomitant decrease of K27me2/3) is less in H3.3. As shown in Fig. 6, there were similar amounts of K36 methylation in MMSET-High for both H3.1 and H3.3. By contrast, the amount of K36 methylation in H3.3 from MMSET-Low cells is higher relative to H3.1. In other words, the basal K36 methylation in H3.3 is higher than for H3.1 and therefore less of an increase of K36 methylation was observed upon overexpression of its methyltransferase; this is consistent with the SRM results shown in supplemental Fig. S7. Third, there was a surprising increase of K27 methylation in MMSET-High cells in Methyl-Eqs 6 and 7, which was opposite with the overall trend of the decrease in K27 methylation from the remaining Methyl-Eqs (second panel of Fig. 6). Importantly, the increase of K27 methylation in Methyl-Eqs 5 and 6 is likely because of trivalent hypermethylation and therefore not detected by Bottom-Up MS.
Fig. 6.
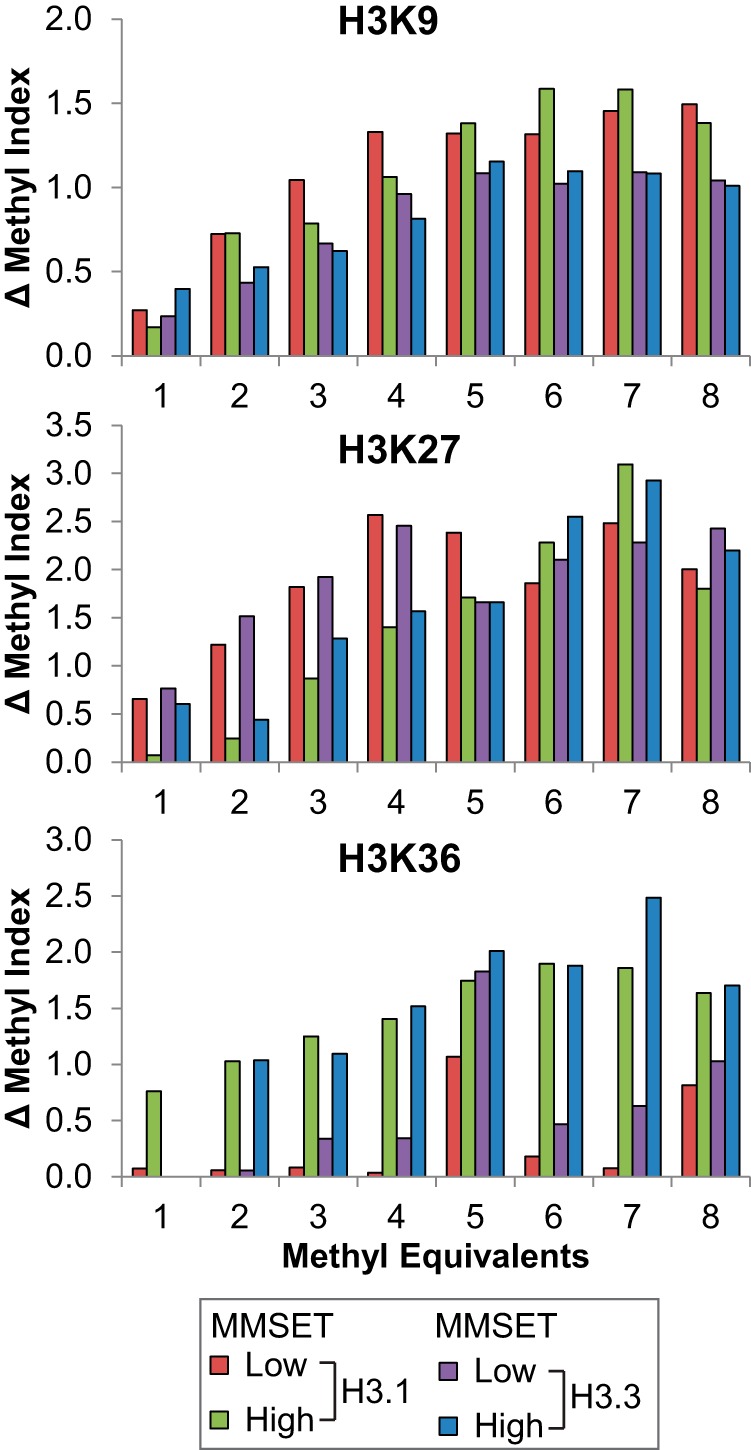
Overall methylation levels in three major methylation sites of histone H3 (K9, K27, and K36) determined by calculating Δ Methyl Index using normalized modification levels derived from ETD MS2 spectral intensities (also see Fig. 4 and supplemental Table S1).
DISCUSSION
Hierarchy of Acetylation
The lack of acetylation in Methyl-Eqs 1–5 in MMSET-Low or Methyl-Eqs 1–7 in MMSET-High suggests a hierarchy of acetylation. In other words, acetylation only coexists with at least three methyl groups in MMSET-Low. Both Top-Down and Bottom-Up MS detected and localized these acetylations to K14, K18, and K23. Although histone acetylations are thought to be associated with transcriptional activation and hence localized to promoters and enhancers (61), the stoichiometry of K14 and K23 acetylations (∼30% in MMSET-Low) suggest their genomic localization could be much broader. To put this conclusion in perspective, stoichiometry of promoter/enhancer-associated H3K4me3 is less than 1% in H3.1. Therefore such coexistence of acetylation with K9 and K27 (plus K36 in MMSET-High) methylation (Fig. 7A) is not surprising. In fact, quantitation of K9 acetylation from K9STGGKAPR17 peptide by Bottom-Up MS has found that K14 acetylation can coexist with mono- and di-methylated K9 (∼20% K9me1/2-K14ac versus ∼30% K9me1/2-K14unmod in supplemental Fig. S7). Moreover, a recent identification of the PHD-bromo cassette of tripartite motif 33 (TRIM33) showed an unanticipated readout of H3 peptide containing unmodified K4, K9me3, and K18ac (62), which corroborates the existence of acetylation with K9me2/3. Another interesting finding by Bottom-Up MS is a significant reduction of histone acetylation in MMSET-High (>30% decrease at H3K23 and >15% at H3K14, supplemental Fig. S7). Importantly, decrease of acetylation in the presence of MMSET overexpression was also detected by the Top-Down analysis, where acetylation appears until Methyl-Eq 8 in MMSET-High cells compared with Methyl-Eq 6 in MMSET-Low.
Fig. 7.
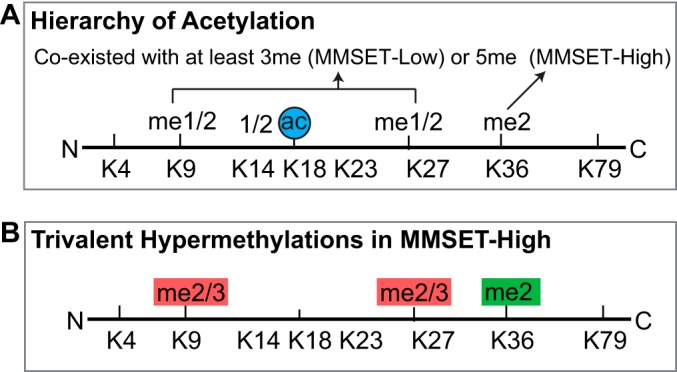
Summary of histone modification crosstalk identified by Differential Top-Down mass spectrometry of histone H3 in this study. A, Observation of the presence of acetylation on histone H3 with at least three methyl groups (MMSET-Low) or five (MMSET-High). B, The aberrant co-existence of hypermethylation (di- and tri-methylation) on lysine 9, 27, and 36 of histone H3 in multiple myeloma cells with MMSET overexpression.
H3.1 versus H3.3
There are three histone variants in mammalian cells (32). The canonical histone H3.1 and H3.2 are DNA-replication dependent variants because they are deposited to chromatin during S phase. By contrast, the production of H3.3 is DNA replication independent and can be deposited throughout cell cycle. Importantly, H3.3 is known to facilitate gene transcription by the formation of a less stable H3.3-H2A.Z-containing nucleosome (63). In the past, we have identified an increase of K36me2 with concomitant decrease of K27me2/3 in MMSET overexpressed multiple myeloma cells by measuring K27SAPATGGVKKPHR40 peptide liberated from total histone using Bottom-Up MS (29). We were able to exclude H3.3 because of the amino acid difference in residue 31 from alanine to serine (A31S, supplemental Fig. S1). Here, we repeated the same analysis using RP-HPLC fractionated H3.1 and H3.3 from the same pair of myeloma cell lines. Similar pattern changes were observed in H3.1 compared with previous studies, suggesting there is no significant difference between H3.1 and H3.2 in terms of K27 and K36 methylations. The most striking alterations of modification patterning on H3.1 upon MMSET overexpression were: a 3-fold increase in K27me1-K36me2 (from 15% to 50%), a >10-fold decrease in K27me2 (from 38% to 2%), and a >5-fold decrease in K27me3 (from 8% to 1%). By contrast, the increase of K27me1-K36me2 on H3.3 was mostly lost (went from 32% to 37%), despite the strong decrease of K27me2/3 on H3.3 (observed at ∼5-fold; supplemental Fig. S7).
In this Top-Down analysis of full-length histone, we have demonstrated that the modifications found in H3.3 using selected fragment ions containing K9, K9+K27, and K9+K27+K36 are more complicated with less degree of overlap than that in H3.1. For this reason, we were unable to unambiguously determine the proteoforms for most Methyl-Eqs in H3.3, except Methyl-Eqs 1 and 2. However, methyl index analysis of Methyl-Eqs 1 to 8 have confirmed the alteration of methylation in K27 and K36. Very interestingly, the methylation switchover between K27 and K36 can be found in all Methyl-Eqs for both H3 variants (Fig. 6), except Methyl-Eq 5 from H3.3. The consistency of two orthogonal analytical platforms, Bottom-Up and Top-Down MS, corroborated the findings presented here.
Determination of Histone Proteoforms by Top-Down Mass Spectrometry
As shown in this study, reconstructing the complete proteoform from MS2 data is not always possible because the connectivity of multiple methylations can be lost in certain cases (supplemental Fig. S5). Because of the relatively simple methylation patterns observed on histone H3.1 from the samples analyzed in this study, we were able to determine 26 unique proteoforms manually. A future implementation of mathematic modeling using linear equations can increase the number of confidently assigned proteoforms and further enable the quantitation of identified proteoforms. In addition, targeted MS3 experiments can resolve ambiguous cases encountered (64). In short, the complete decoding of full-length histone H3 proteoforms present at >5% will be possible, and with additional separations those down to 0.01% total abundance can be accessed (44, 65).
Top-Down Versus Bottom-up MS for Detecting Disease-associated Modification Patterns
In this study, we have determined the abundance range of trivalent hypermethylated H3.1 (K9me2-K27me2-K36me2) identified in MMSET-High to be ∼30–60% of Methyl-Eq 6. Considering Methyl-Eq 6 is the most abundant peak among total of 18 charge states, we estimated the level of this trivalent dimethylation form is at the range of ∼5–10% of total H3.1. In addition, H3.1 K9me2-K27me3-K36me2 is present in Methyl-Eq 7 in MMSET-High cells. Because these H3.1 proteoforms arising from trivalent hypermethylation are largely absent in MMSET-Low, the abundance difference is expected to be very high. However, using the surrogate of these proteoforms (K27me2-K36me2) observed in the Bottom-Up approach simply misses the major difference changing in the system. More specifically, the relative level of H3.1 K27me2-K36me2 is ∼2% in MMSET-High and ∼1% in MMSET-Low by Bottom-Up MS (supplemental Fig. S7). The discrepancies between two approaches is likely because of the variations in detection efficiencies of H3K27-K36 peptide carrying different methyl and propionyl groups as chemical derivatization is necessary to generate uniformly peptides for the quantification by Bottom-Up (66). The ionization efficiencies of these different peptides could vary significantly depending not only on their physicochemical properties but also matrix effects. Although it can be corrected by spiked-in SILAC peptide (60), it is an expensive approach for the complicated challenge of capturing major changes in modifications patterns. For example, SILAC peptides are needed to correct for differences in ionization efficiency for combinatorial K27 and K36 methylations of H3.1/2 and H3.3. On the other hand, modifications in intact protein are far less likely to affect ionization efficiency drastically, making it more robust for differential studies (33). In addition to this technical issue, a more fundamental problem associated with Bottom-Up MS might lead to the failure of detecting disease associated histone modifications. It is likely that K27me2-K36me2 is associated with other modifications (such as acetylation and present in Methyl-Eq > 10). When K27me2-K36me2 is used as a surrogate in Bottom-Up, it averages the increase of K9me2-K27me2-K36me2 and the decrease of K27me2-K36me2 that is associated with other modifications in MMSET-High and leads to misunderstanding of the true dynamics operative in the system.
Trivalent Hypermethylation
A major finding from a recent ChIP-Seq study using H3K36me2 antibodies to probe the same isogenic cell lines used here was that clear H3K36me2 peaks around the transcription start site (TSS) in gene rich regions were obliterated and new H3K36me2 peaks appearing in gene poor regions when MMSET is overexpressed (30). This finding was consistent with results uncovering aberrant gene expression patterns (30). More specifically, despite a ∼3-fold increase in H3.1-K36me2, only small subset of genes were affected (522 genes up-regulated and 308 genes down-regulated). Given our results with the unanticipated redistribution of H3K36me2 from intragenic to intergenic regions in MMSET-High cells, we posit that the K9me2-K27me2/3-K36me2 proteoforms (Fig. 7B) are relocated to heterochromatic regions and may disturb normal genetic programming. It is very tempting to postulate that trivalent hypermethylation is not only the result of aberrant histone methyltransferase but also leads to the disease-causing epigenetic activities through the abnormal recruitment of chromatin effectors.
Supplementary Material
Footnotes
Author contributions: Y.Z., L.F., P.D.C., J.D.L., M.W.S., and N.L.K. designed research; Y.Z., L.F., S.S., J.C., C.M., and V.Z. performed research; Y.Z., R.T.F., and P.M.T. analyzed data; Y.Z., L.F., and N.L.K. wrote the paper.
* This work was supported by Northwestern University, a gift from the Sherman Fairchild Foundation, the NIH (GM067193 and GM108569 to N.L.K.), and Specialized Center for Research Excellence from the Leukemia and Lymphoma Society (to J.D.L.). L.F. would like to thank the Swiss National Science Foundation for an “Early Postdoc. Mobility” Fellowship.
 This article contains supplemental Figs. S1 to S7 and Tables S1 and S2.
1 The abbreviations used are:
- TKO
- targeted knockout
- HILIC
- hydrophilic interaction chromatography
- LC
- liquid chromatography
- MS
- mass spectrometry
- ETD
- electron transfer dissociation
- EThcD
- electron transfer dissociation – higher-energy collision dissociation.
REFERENCES
- 1. Ladewig J., Koch P., and Brustle O. (2013) Leveling Waddington: the emergence of direct programming and the loss of cell fate hierarchies. Nat. Rev. Mol. Cell Biol. 14, 225–236 [DOI] [PubMed] [Google Scholar]
- 2. López-Otín C., Blasco M. A., Partridge L., Serrano M., and Kroemer G. (2013) The hallmarks of aging. Cell 153, 1194–1217 [DOI] [PMC free article] [PubMed] [Google Scholar]
- 3. Greer E. L., Maures T. J., Ucar D., Hauswirth A. G., Mancini E., Lim J. P., Benayoun B. A., Shi Y., and Brunet A. (2011) Transgenerational epigenetic inheritance of longevity in Caenorhabditis elegans. Nature 479, 365–371 [DOI] [PMC free article] [PubMed] [Google Scholar]
- 4. Béguelin W., Popovic R., Teater M., Jiang Y., Bunting K. L., Rosen M., Shen H., Yang S. N., Wang L., Ezponda T., Martinez-Garcia E., Zhang H., Zheng Y., Verma S. K., McCabe M. T., Ott H. M., Van Aller G. S., Kruger R. G., Liu Y., McHugh C. F., Scott D. W., Chung Y. R., Kelleher N., Shaknovich R., Creasy C. L., Gascoyne R. D., Wong K. K., Cerchietti L., Levine R. L., Abdel-Wahab O., Licht J. D., Elemento O., and Melnick A. M. (2013) EZH2 is required for germinal center formation and somatic EZH2 mutations promote lymphoid transformation. Cancer Cell 23, 677–692 [DOI] [PMC free article] [PubMed] [Google Scholar]
- 5. Morin R. D., Johnson N. A., Severson T. M., Mungall A. J., An J., Goya R., Paul J. E., Boyle M., Woolcock B. W., Kuchenbauer F., Yap D., Humphries R. K., Griffith O. L., Shah S., Zhu H., Kimbara M., Shashkin P., Charlot J. F., Tcherpakov M., Corbett R., Tam A., Varhol R., Smailus D., Moksa M., Zhao Y., Delaney A., Qian H., Birol I., Schein J., Moore R., Holt R., Horsman D. E., Connors J. M., Jones S., Aparicio S., Hirst M., Gascoyne R. D., and Marra M. A. (2010) Somatic mutations altering EZH2 (Tyr641) in follicular and diffuse large B-cell lymphomas of germinal-center origin. Nat. Genet. 42, 181–185 [DOI] [PMC free article] [PubMed] [Google Scholar]
- 6. Sneeringer C. J., Scott M. P., Kuntz K. W., Knutson S. K., Pollock R. M., Richon V. M., and Copeland R. A. (2010) Coordinated activities of wild-type plus mutant EZH2 drive tumor-associated hypertrimethylation of lysine 27 on histone H3 (H3K27) in human B-cell lymphomas. Proc. Natl. Acad. Sci. U.S.A. 107, 20980–20985 [DOI] [PMC free article] [PubMed] [Google Scholar]
- 7. Schwartzentruber J., Korshunov A., Liu X.-Y., Jones D. T. W., Pfaff E., Jacob K., Sturm D., Fontebasso A. M., Quang D.-A. K., Tonjes M., Hovestadt V., Albrecht S., Kool M., Nantel A., Konermann C., Lindroth A., Jäger N., Rausch T., Ryzhova M., Korbel J. O., Hielscher T., Hauser P., Garami M., Klekner A., Bognar L., Ebinger M., Schuhmann M. U., Scheurlen W., Pekrun A., Fruhwald M. C., Roggendorf W., Kramm C., Durken M., Atkinson J., Lepage P., Montpetit A., Zakrzewska M., Zakrzewski K., Liberski P. P., Dong Z., Siegel P., Kulozik A. E., Zapatka M., Guha A., Malkin D., Felsberg J., Reifenberger G., von Deimling A., Ichimura K., Collins V. P., Witt H., Milde T., Witt O., Zhang C., Castelo-Branco P., Lichter P., Faury D., Tabori U., Plass C., Majewski J., Pfister S. M., and Jabado N. (2012) Driver mutations in histone H3.3 and chromatin remodelling genes in paediatric glioblastoma. Nature 482, 226–231 [DOI] [PubMed] [Google Scholar]
- 8. Jaffe J. D., Wang Y., Chan H. M., Zhang J., Huether R., Kryukov G. V., Bhang H. E., Taylor J. E., Hu M., Englund N. P., Yan F., Wang Z., Robert McDonald E. 3rd, Wei L., Ma J., Easton J., Yu Z., deBeaumount R., Gibaja V., Venkatesan K., Schlegel R., Sellers W. R., Keen N., Liu J., Caponigro G., Barretina J., Cooke V. G., Mullighan C., Carr S. A., Downing J. R., Garraway L. A., and Stegmeier F. (2013) Global chromatin profiling reveals NSD2 mutations in pediatric acute lymphoblastic leukemia. Nat. Genet. 45, 1386–1391 [DOI] [PMC free article] [PubMed] [Google Scholar]
- 9. Gräff J., and Tsai L. H. (2013) Histone acetylation: molecular mnemonics on the chromatin. Nat. Rev. Neurosci. 14, 97–111 [DOI] [PubMed] [Google Scholar]
- 10. Schmidt H. D., McGinty J. F., West A. E., and Sadri-Vakili G. (2013) Epigenetics and psychostimulant addiction. Perspectives Med. 3, a012047. [DOI] [PMC free article] [PubMed] [Google Scholar]
- 11. Badeaux A. I., and Shi Y. (2013) Emerging roles for chromatin as a signal integration and storage platform. Nat. Rev. Mol. Cell Biol. 14, 211–224 [PubMed] [Google Scholar]
- 12. Berger S. L., Kouzarides T., Shiekhattar R., and Shilatifard A. (2009) An operational definition of epigenetics. Genes Develop. 23, 781–783 [DOI] [PMC free article] [PubMed] [Google Scholar]
- 13. Zaidi S., Choi M., Wakimoto H., Ma L., Jiang J., Overton J. D., Romano-Adesman A., Bjornson R. D., Breitbart R. E., Brown K. K., Carriero N. J., Cheung Y. H., Deanfield J., DePalma S., Fakhro K. A., Glessner J., Hakonarson H., Italia M. J., Kaltman J. R., Kaski J., Kim R., Kline J. K., Lee T., Leipzig J., Lopez A., Mane S. M., Mitchell L. E., Newburger J. W., Parfenov M., Pe'er I., Porter G., Roberts A. E., Sachidanandam R., Sanders S. J., Seiden H. S., State M. W., Subramanian S., Tikhonova I. R., Wang W., Warburton D., White P. S., Williams I. A., Zhao H., Seidman J. G., Brueckner M., Chung W. K., Gelb B. D., Goldmuntz E., Seidman C. E., and Lifton R. P. (2013) De novo mutations in histone-modifying genes in congenital heart disease. Nature 498, 220–223 [DOI] [PMC free article] [PubMed] [Google Scholar]
- 14. Suvà M. L., Riggi N., and Bernstein B. E. (2013) Epigenetic reprogramming in cancer. Science 339, 1567–1570 [DOI] [PMC free article] [PubMed] [Google Scholar]
- 15. Behjati S., Tarpey P. S., Presneau N., Scheipl S., Pillay N., Van Loo P., Wedge D. C., Cooke S. L., Gundem G., Davies H., Nik-Zainal S., Martin S., McLaren S., Goodie V., Robinson B., Butler A., Teague J. W., Halai D., Khatri B., Myklebost O., Baumhoer D., Jundt G., Hamoudi R., Tirabosco R., Amary M. F., Futreal P. A., Stratton M. R., Campbell P. J., and Flanagan A. M. (2013) Distinct H3F3A and H3F3B driver mutations define chondroblastoma and giant cell tumor of bone. Nat. Genet. 45, 1479–1482 [DOI] [PMC free article] [PubMed] [Google Scholar]
- 16. Herz H. M., Morgan M., Gao X., Jackson J., Rickels R., Swanson S. K., Florens L., Washburn M. P., Eissenberg J. C., and Shilatifard A. (2014) Histone H3 lysine-to-methionine mutants as a paradigm to study chromatin signaling. Science 345, 1065–1070 [DOI] [PMC free article] [PubMed] [Google Scholar]
- 17. Peach S. E., Rudomin E. L., Udeshi N. D., Carr S. A., and Jaffe J. D. (2012) Quantitative assessment of chromatin immunoprecipitation grade antibodies directed against histone modifications reveals patterns of co-occurring marks on histone protein molecules. Mol. Cell. Proteomics 11, 128–137 [DOI] [PMC free article] [PubMed] [Google Scholar]
- 18. Fuchs S. M., Krajewski K., Baker R. W., Miller V. L., and Strahl B. D. (2011) Influence of combinatorial histone modifications on antibody and effector protein recognition. Curr. Biol. 21, 53–58 [DOI] [PMC free article] [PubMed] [Google Scholar]
- 19. Hsiao K. Y., and Mizzen C. A. (2013) Histone H4 deacetylation facilitates 53BP1 DNA damage signaling and double-strand break repair. J. Mol. Cell Biol. 5, 157–165 [DOI] [PubMed] [Google Scholar]
- 20. Yuan Z. F., Arnaudo A. M., and Garcia B. A. (2014) Mass spectrometric analysis of histone proteoforms. Annu. Rev. Anal. Chem. 7, 113–128 [DOI] [PMC free article] [PubMed] [Google Scholar]
- 21. Oyer J. A., Huang X., Zheng Y., Shim J., Ezponda T., Carpenter Z., Allegretta M., Okot-Kotber C. I., Patel J. P., Melnick A., Levine R. L., Ferrando A., Mackerell A. D. Jr., Kelleher N. L., Licht J. D., and Popovic R. (2014) Point mutation E1099K in MMSET/NSD2 enhances its methyltranferase activity and leads to altered global chromatin methylation in lymphoid malignancies. Leukemia 28, 198–201 [DOI] [PMC free article] [PubMed] [Google Scholar]
- 22. Jenuwein T., and Allis C. D. (2001) Translating the histone code. Science 293, 1074–1080 [DOI] [PubMed] [Google Scholar]
- 23. Ernst J., Kheradpour P., Mikkelsen T. S., Shoresh N., Ward L. D., Epstein C. B., Zhang X., Wang L., Issner R., Coyne M., Ku M., Durham T., Kellis M., and Bernstein B. E. (2011) Mapping and analysis of chromatin state dynamics in nine human cell types. Nature 473, 43–49 [DOI] [PMC free article] [PubMed] [Google Scholar]
- 24. Wagner E. J., and Carpenter P. B. (2012) Understanding the language of Lys36 methylation at histone H3. Nat. Rev. Mol. Cell Biol. 13, 115–126 [DOI] [PMC free article] [PubMed] [Google Scholar]
- 25. Li Y., Trojer P., Xu C. F., Cheung P., Kuo A., Drury W. J. 3rd, Qiao Q., Neubert T. A., Xu R. M., Gozani O., and Reinberg D. (2009) The target of the NSD family of histone lysine methyltransferases depends on the nature of the substrate. J. Biol. Chem. 284, 34283–34295 [DOI] [PMC free article] [PubMed] [Google Scholar]
- 26. Keats J. J., Reiman T., Belch A. R., and Pilarski L. M. (2006) Ten years and counting: so what do we know about t(4;14)(p16;q32) multiple myeloma. Leuk. Lymphoma 47, 2289–2300 [DOI] [PubMed] [Google Scholar]
- 27. Stec I., Wright T. J., van Ommen G. J., de Boer P. A., van Haeringen A., Moorman A. F., Altherr M. R., and den Dunnen J. T. (1998) WHSC1, a 90 kb SET domain-containing gene, expressed in early development and homologous to a Drosophila dysmorphy gene maps in the Wolf-Hirschhorn syndrome critical region and is fused to IgH in t(4;14) multiple myeloma. Human Mol. Genet. 7, 1071–1082 [DOI] [PubMed] [Google Scholar]
- 28. Lauring J., Abukhdeir A. M., Konishi H., Garay J. P., Gustin J. P., Wang Q., Arceci R. J., Matsui W., and Park B. H. (2008) The multiple myeloma associated MMSET gene contributes to cellular adhesion, clonogenic growth, and tumorigenicity. Blood 111, 856–864 [DOI] [PMC free article] [PubMed] [Google Scholar]
- 29. Zheng Y., Sweet S. M., Popovic R., Martinez-Garcia E., Tipton J. D., Thomas P. M., Licht J. D., and Kelleher N. L. (2012) Total kinetic analysis reveals how combinatorial methylation patterns are established on lysines 27 and 36 of histone H3. Proc. Natl. Acad. Sci. U.S.A. 109, 13549–13554 [DOI] [PMC free article] [PubMed] [Google Scholar]
- 30. Popovic R., Martinez-Garcia E., Giannopoulou E. G., Zhang Q., Ezponda T., Shah M. Y., Zheng Y., Will C. M., Small E. C., Hua Y., Bulic M., Jiang Y., Carrara M., Calogero R. A., Kath W. L., Kelleher N. L., Wang J. P., Elemento O., and Licht J. D. (2014) Histone methyltransferase MMSET/NSD2 alters EZH2 binding and reprograms the myeloma epigenome through global and focal changes in H3K36 and H3K27 methylation. PLoS Genet. 10, e1004566. [DOI] [PMC free article] [PubMed] [Google Scholar]
- 31. Kuo A. J., Cheung P., Chen K., Zee B. M., Kioi M., Lauring J., Xi Y., Park B. H., Shi X., Garcia B. A., Li W., and Gozani O. (2011) NSD2 links dimethylation of histone H3 at lysine 36 to oncogenic programming. Mol. Cell 44, 609–620 [DOI] [PMC free article] [PubMed] [Google Scholar]
- 32. Filipescu D., Muller S., and Almouzni G. (2014) Histone H3 variants and their chaperones during development and disease: contributing to epigenetic control. Ann. Rev. Cell Develop. Biol. 30, 615–646 [DOI] [PubMed] [Google Scholar]
- 33. Pesavento J. J., Mizzen C. A., and Kelleher N. L. (2006) Quantitative analysis of modified proteins and their positional isomers by tandem mass spectrometry: human histone H4. Anal. Chem. 78, 4271–4280 [DOI] [PubMed] [Google Scholar]
- 34. Boyne M. T. 2nd, Pesavento J. J., Mizzen C. A., and Kelleher N. L. (2006) Precise characterization of human histones in the H2A gene family by top down mass spectrometry. J. Proteome Res. 5, 248–253 [DOI] [PubMed] [Google Scholar]
- 35. Siuti N., Roth M. J., Mizzen C. A., Kelleher N. L., and Pesavento J. J. (2006) Gene-specific characterization of human histone H2B by electron capture dissociation. J. Proteome Res. 5, 233–239 [DOI] [PubMed] [Google Scholar]
- 36. Thomas C. E., Kelleher N. L., and Mizzen C. A. (2006) Mass spectrometric characterization of human histone H3: a bird's eye view. J. Proteome Res. 5, 240–247 [DOI] [PubMed] [Google Scholar]
- 37. Zheng Y., John S., Pesavento J. J., Schultz-Norton J. R., Schiltz R. L., Baek S., Nardulli A. M., Hager G. L., Kelleher N. L., and Mizzen C. A. (2010) Histone H1 phosphorylation is associated with transcription by RNA polymerases I and II. J. Cell Biol. 189, 407–415 [DOI] [PMC free article] [PubMed] [Google Scholar]
- 38. Garcia B. A., Pesavento J. J., Mizzen C. A., and Kelleher N. L. (2007) Pervasive combinatorial modification of histone H3 in human cells. Nat. Methods 4, 487–489 [DOI] [PubMed] [Google Scholar]
- 39. Phanstiel D., Brumbaugh J., Berggren W. T., Conard K., Feng X., Levenstein M. E., McAlister G. C., Thomson J. A., and Coon J. J. (2008) Mass spectrometry identifies and quantifies 74 unique histone H4 isoforms in differentiating human embryonic stem cells. Proc. Natl. Acad. Sci. U.S.A. 105, 4093–4098 [DOI] [PMC free article] [PubMed] [Google Scholar]
- 40. Tian Z., Tolic N., Zhao R., Moore R. J., Hengel S. M., Robinson E. W., Stenoien D. L., Wu S., Smith R. D., and Pasa-Tolic L. (2012) Enhanced top-down characterization of histone post-translational modifications. Genome Biol. 13, R86. [DOI] [PMC free article] [PubMed] [Google Scholar]
- 41. Moradian A., Kalli A., Sweredoski M. J., and Hess S. (2014) The top-down, middle-down, and bottom-up mass spectrometry approaches for characterization of histone variants and their post-translational modifications. Proteomics 14, 489–497 [DOI] [PubMed] [Google Scholar]
- 42. Sidoli S., Lin S., Karch K. R., and Garcia B. A. (2015) Bottom-up and middle-down proteomics have comparable accuracies in defining histone post-translational modification relative abundance and stoichiometry. Anal. Chem. 87, 3129–3133 [DOI] [PMC free article] [PubMed] [Google Scholar]
- 43. Harshman S. W., Hoover M. E., Huang C., Branson O. E., Chaney S. B., Cheney C. M., Rosol T. J., Shapiro C. L., Wysocki V. H., Huebner K., and Freitas M. A. (2014) Histone H1 phosphorylation in breast cancer. J.Proteome Res. 13, 2453–2467 [DOI] [PMC free article] [PubMed] [Google Scholar]
- 44. Young N. L., DiMaggio P. A., Plazas-Mayorca M. D., Baliban R. C., Floudas C. A., and Garcia B. A. (2009) High throughput characterization of combinatorial histone codes. Mol. Cell. Proteomics 8, 2266–2284 [DOI] [PMC free article] [PubMed] [Google Scholar]
- 45. Smith L. M., and Kelleher N. L. (2013) Proteoform: a single term describing protein complexity. Nat. Methods 10, 186–187 [DOI] [PMC free article] [PubMed] [Google Scholar]
- 46. Dang X., Scotcher J., Wu S., Chu R. K., Tolic N., Ntai I., Thomas P. M., Fellers R. T., Early B. P., Zheng Y., Durbin K. R., Leduc R. D., Wolff J. J., Thompson C. J., Pan J., Han J., Shaw J. B., Salisbury J. P., Easterling M., Borchers C. H., Brodbelt J. S., Agar J. N., Pasa-Tolic L., Kelleher N. L., and Young N. L. (2014) The first pilot project of the consortium for top-down proteomics: a status report. Proteomics 14, 1130–1140 [DOI] [PMC free article] [PubMed] [Google Scholar]
- 47. Syka J. E., Coon J. J., Schroeder M. J., Shabanowitz J., and Hunt D. F. (2004) Peptide and protein sequence analysis by electron transfer dissociation mass spectrometry. Proc. Natl. Acad. Sci. U.S.A. 101, 9528–9533 [DOI] [PMC free article] [PubMed] [Google Scholar]
- 48. Olsen J. V., Macek B., Lange O., Makarov A., Horning S., and Mann M. (2007) Higher-energy C-trap dissociation for peptide modification analysis. Nat. Methods 4, 709–712 [DOI] [PubMed] [Google Scholar]
- 49. Frese C. K., Altelaar A. F., van den Toorn H., Nolting D., Griep-Raming J., Heck A. J., and Mohammed S. (2012) Toward full peptide sequence coverage by dual fragmentation combining electron-transfer and higher-energy collision dissociation tandem mass spectrometry. Anal. Chem. 84, 9668–9673 [DOI] [PubMed] [Google Scholar]
- 50. Brunner A. M., Lossl P., Liu F., Huguet R., Mullen C., Yamashita M., Zabrouskov V., Makarov A., Altelaar A. F., and Heck A. J. (2015) Benchmarking multiple fragmentation methods on an orbitrap fusion for top-down phospho-proteoform characterization. Anal. Chem. 87, 4152–4158 [DOI] [PubMed] [Google Scholar]
- 51. Zheng Y., Tipton J. D., Thomas P. M., Kelleher N. L., and Sweet S. M. (2014) Site-specific human histone H3 methylation stability: fast K4me3 turnover. Proteomics 14, 2190–2199 [DOI] [PMC free article] [PubMed] [Google Scholar]
- 52. Earley L., Anderson L. C., Bai D. L., Mullen C., Syka J. E., English A. M., Dunyach J. J., Stafford G. C. Jr., Shabanowitz J., Hunt D. F., and Compton P. D. (2013) Front-end electron transfer dissociation: a new ionization source. Anal. Chem. 85, 8385–8390 [DOI] [PMC free article] [PubMed] [Google Scholar]
- 53. Horn D. M., Ge Y., and McLafferty F. W. (2000) Activated ion electron capture dissociation for mass spectral sequencing of larger (42 kDa) proteins. Anal. Chem. 72, 4778–4784 [DOI] [PubMed] [Google Scholar]
- 54. Durbin K. R., Skinner O. S., Fellers R. T., and Kelleher N. L. (2015) Analyzing internal fragmentation of electrosprayed ubiquitin ions during beam-type collisional dissociation. J. Am. Soc. Mass Spectrom. 26, 782–787 [DOI] [PMC free article] [PubMed] [Google Scholar]
- 55. Fellers R. T., Greer J. B., Early B. P., Yu X., LeDuc R. D., Kelleher N. L., and Thomas P. M. (2015) ProSight Lite: graphical software to analyze top-down mass spectrometry data. Proteomics 15, 1235–1238 [DOI] [PMC free article] [PubMed] [Google Scholar]
- 56. Zheng Y., Thomas P. M., and Kelleher N. L. (2013) Measurement of acetylation turnover at distinct lysines in human histones identifies long-lived acetylation sites. Nat. Communications 4, 2203. [DOI] [PMC free article] [PubMed] [Google Scholar]
- 57. Evertts A. G., Zee B. M., Dimaggio P. A., Gonzales-Cope M., Coller H. A., and Garcia B. A. (2013) Quantitative dynamics of the link between cellular metabolism and histone acetylation. J. Biol. Chem. 288, 12142–12151 [DOI] [PMC free article] [PubMed] [Google Scholar]
- 58. Zee B. M., Levin R. S., Xu B., LeRoy G., Wingreen N. S., and Garcia B. A. (2010) In vivo residue-specific histone methylation dynamics. J. Biol. Chem. 285, 3341–3350 [DOI] [PMC free article] [PubMed] [Google Scholar]
- 59. Tang H., Fang H., Yin E., Brasier A. R., Sowers L. C., and Zhang K. (2014) Multiplexed parallel reaction monitoring targeting histone modifications on the QExactive mass spectrometer. Anal. Chem. 86, 5526–5534 [DOI] [PubMed] [Google Scholar]
- 60. Lin S., Wein S., Gonzales-Cope M., Otte G. L., Yuan Z. F., Afjehi-Sadat L., Maile T., Berger S. L., Rush J., Lill J. R., Arnott D., and Garcia B. A. (2014) Stable-isotope-labeled histone peptide library for histone post-translational modification and variant quantification by mass spectrometry. Mol. Cell. Proteomics 13, 2450–2466 [DOI] [PMC free article] [PubMed] [Google Scholar]
- 61. Wang Z., Zang C., Cui K., Schones D. E., Barski A., Peng W., and Zhao K. (2009) Genome-wide mapping of HATs and HDACs reveals distinct functions in active and inactive genes. Cell 138, 1019–1031 [DOI] [PMC free article] [PubMed] [Google Scholar]
- 62. Xi Q., Wang Z., Zaromytidou A. I., Zhang X. H., Chow-Tsang L. F., Liu J. X., Kim H., Barlas A., Manova-Todorova K., Kaartinen V., Studer L., Mark W., Patel D. J., and Massague J. (2011) A poised chromatin platform for TGF-beta access to master regulators. Cell 147, 1511–1524 [DOI] [PMC free article] [PubMed] [Google Scholar]
- 63. Jin C., Zang C., Wei G., Cui K., Peng W., Zhao K., and Felsenfeld G. (2009) H3.3/H2A.Z double variant-containing nucleosomes mark ‘nucleosome-free regions’ of active promoters and other regulatory regions. Nat. Genet. 41, 941–945 [DOI] [PMC free article] [PubMed] [Google Scholar]
- 64. Feller C., Forne I., Imhof A., and Becker P. B. (2015) Global and specific responses of the histone acetylome to systematic perturbation. Mol. Cell 57, 559–571 [DOI] [PubMed] [Google Scholar]
- 65. Pesavento J. J., Bullock C. R., LeDuc R. D., Mizzen C. A., and Kelleher N. L. (2008) Combinatorial modification of human histone H4 quantitated by two-dimensional liquid chromatography coupled with top down mass spectrometry. J. Biol. Chem. 283, 14927–14937 [DOI] [PMC free article] [PubMed] [Google Scholar]
- 66. Garcia B. A., Mollah S., Ueberheide B. M., Busby S. A., Muratore T. L., Shabanowitz J., and Hunt D. F. (2007) Chemical derivatization of histones for facilitated analysis by mass spectrometry. Nat. Protocols 2, 933–938 [DOI] [PMC free article] [PubMed] [Google Scholar]
Associated Data
This section collects any data citations, data availability statements, or supplementary materials included in this article.