

Abstract
Epithelial to mesenchymal transition (EMT)1 occurs naturally during embryogenesis, tissue repair, cancer progression, and metastasis. EMT induces cellular and microenvironmental changes resulting in loss of epithelial and acquisition of mesenchymal phenotypes, which promotes cellular invasive and migratory capabilities. EMT can be triggered by extracellular factors, including TGF-β, HGF, and EGF. Overexpression of transcription factors, such as SNAIL, SLUG, ZEB1/2, and TWIST1, also induces EMT and is correlated to cancer aggressiveness. Here, the breast adenocarcinoma cell line MCF7 was transduced with SNAIL to identify specific mechanisms controlled by this transcription factor during EMT. Overexpression of SNAIL led to EMT, which was thoroughly validated by molecular, morphological, and functional experiments. Subcellular proteome enrichment followed by GEL-LC-MS/MS was performed to provide extensive protein fractionation and in-depth proteomic analysis. Quantitative analysis relied on a SILAC strategy, using the invasive breast cancer cell line MDA-MB-231 as a reference for quantitation. Subsets of proteins enriched in each subcellular compartment led to a complementary list of 4289 proteins identified with high confidence. A subset of differentially expressed proteins was validated by Western blot, including regulation in specific cellular compartments, potentially caused by protein translocation. Protein network analysis highlighted complexes involved in cell cycle control and epigenetic regulation. Flow cytometry analysis indicated that SNAIL overexpression led to cell cycle arrest in G0/G1 phases. Furthermore, down-regulation of HDAC1 was observed, supporting the involvement of epigenetic processes in SNAIL-induced EMT. When HDAC1 activity was inhibited, MCF7 not only apparently initiated EMT but also up-regulated SNAIL, indicating the cross-talk between these two proteins. Both HDAC1 inhibition and SNAIL overexpression activated the AKT pathway. These molecular mechanisms appear to be essential to EMT and therefore for cancer metastasis. Specific control of such epigenetic processes might then represent effective approaches for clinical management of metastatic cancer.
Epithelial to mesenchymal transition (EMT) is a process by which epithelial cells acquire a mesenchymal phenotype through complex cellular and microenvironmental changes, such as the decrease in epithelial markers, re-expression of mesenchymal molecules, cytoskeleton reorganization, and basement membrane degradation, resulting in loss of cell-cell contact and promotion of invasive and migratory capabilities to these cells (1–3). During EMT, down-regulation of E-cadherin (CDH1) expression and overexpression of mesenchymal molecules, including vimentin and N-cadherin, occurs, allowing these molecules to be used as molecular markers of EMT (1).
EMT occurs naturally during embryogenesis and tissue repair and has also been implicated in cancer progression and metastasis (2, 4). The loss of intercellular adhesion and invasive and migratory capabilities acquired by cancer cells allow them to separate from the primary tumor and invade adjacent tissues or enter circulation, establishing secondary tumors in distant organs. The reverse process (mesenchymal to epithelial transition) is required to turn the migratory cell into an epithelial phenotype again (3, 5). Several molecular processes are involved in EMT induction and regulation, including interconnected and independent pathways and signaling molecules (2, 3, 5, 6). As a result, several extracellular matrix components and growth factors, including transforming growth factor-β (TGF-β), epidermal growth factor (EGF), and hepatocyte growth factor (HGF), or intracellular signals such as NFκB and WNT signaling, trigger the EMT process (1). Overexpression of some transcription factors such as SNAIL (SNAI1), SLUG (SNAI2), ZEB1, ZEB2, TWIST1, GSC, FOXC1, and FOXC2 can also induce EMT in vitro (2, 3, 5).
SNAIL is a member of the Snail family of transcription factors and one of the master EMT regulators (1). SNAIL overexpression is sufficient to induce the molecular events that lead to EMT in vitro (7, 8) and in primary tumors and is sufficient to promote tumor recurrence in vivo (9). In fact, SNAIL is overexpressed in various types of tumors and correlates with aggressiveness, metastasis, recurrence, and poor prognosis (10, 11). This effect is partially due to its ability to directly inhibit the transcription of cell adhesion-related genes (2). By binding E2-box DNA sequences (CAGGT(G/C)ACCTG) to their carboxyl-terminal zinc finger domains, Snail factors can repress expression of epithelial genes, such as E-cadherin (5, 8). SNAIL has also been implicated in cancer cell survival, cell cycle regulation, apoptosis evasion, cell adhesion, neuro-endocrine differentiation, and chemoresistance and is found to be overexpressed in the invasive region of tumors (12–14).
In addition to the networks of signaling pathways triggered by SNAIL and other stimuli that induce and regulate EMT, epigenetic mechanisms are also involved and influence the process. Epigenetic regulatory mechanisms, such as DNA methylation, microRNAs, and chromatin modifications, account for the reversibility of EMT and plasticity of cancer cells (15, 16). Of note, modifications in chromatin-associated histones and thereafter the control of chromatin configuration play essential roles in mediating the activity of several EMT transcriptional regulators, enabling the widespread changes in gene expression that occur during EMT (16, 17). The role of SNAIL in the epigenetic mechanism governing EMT is poorly understood (18).
To increase the understanding of the complex molecular mechanisms of EMT at the protein level, we analyzed proteomic alterations during EMT induction by SNAIL overexpression in the breast adenocarcinoma cell line MCF7. We found an involvement of epigenetic processes in SNAIL-induced EMT, highlighted by a cross-talk between SNAIL and the histone deacetylase HDAC1, and activation of the AKT pathway. Specific control of epigenetic process might provide opportunities for effective clinical management of metastatic cancer.
EXPERIMENTAL PROCEDURES
Cell Culture
Cell lines were acquired from the ATCC. MCF7 cells (19) were cultured in Dulbecco's modified Eagle's medium (DMEM, Life Technologies, Inc.) supplemented with 10% fetal bovine serum (FBS, Thermo Scientific, Marietta, OH), 100 units/ml penicillin, and 100 μg/ml streptomycin (Life Technologies, Inc.). MDA-MB-231 cells (20) were cultured in Dulbecco's modified Eagle's medium/Nutrient Mixture F-12 (DMEM/F-12, Life Technologies, Inc.) supplemented with 10% FBS, 100 units/ml penicillin, and 100 μg/ml streptomycin.
SILAC Labeling
MDA-MB-231 cells were cultured in SILAC DMEM/F-12 (SILACTM advanced DMEM/F12-Flex, Life Technologies, Inc.) containing heavy lysine (13C6-l-lysine) (0.1 mg/ml) and supplemented with 10% dialyzed FBS, 2 mm l-glutamine, 4.5 mg/ml d-glucose, 0.01% (w/v) penicillin/streptomycin. To incorporate isotopically labeled amino acids, cells were incubated for more than four passages. To check for proper incorporation of heavy isotopes of lysine in MDA-MB-231 proteins, we used Multiple Reaction Monitoring (MRM) method to quantify the rate of incorporation of 13C6-l-lysine into actin-β (ACTB) protein. This analysis is presented in supplemental Fig. 1.
Lentiviral Production
The plasmid DNA vector pLVX-IRES-ZsGreen (Clontech) carrying the SNAIL gene or the empty vector (2 μg) was transfected into 80% confluent 293FT cells together with the packaging construct pDR 8.91 (1.5 μg) and the pseudotyping construct pMD2-VSV-G (0.5 μg) in a triple cotransfection using Lipofectamine® 2000 (Life Technologies, Inc.), according to the manufacturer's instructions. Six hours after transfection, media were replaced by fresh media, and 48 h later the culture supernatants were collected and used for transduction of target cells.
Lentiviral Infection and EMT Induction
For ectopic expression of SNAIL, MCF7 cells were seeded at 1 × 10⁵ cells on a 6-well plate. 1–2 ml of culture supernatants containing viruses were added to the cells in the presence of 6 μg/ml Polybrene (Sigma-Aldrich). Six hours after transduction, the virus-containing media was replaced by DMEM supplemented with 10% FBS, and the plate was incubated overnight. Two cycles of transduction were performed. To determine transduction efficiency, ZsGreen fluorescence was measured by FACS analysis using a FACSCalibur flow cytometer (BD Biosciences, Heidelberg, Germany). Percentages of ZsGreen-positive cells were determined by analyzing at least 10,000 cells per sample. Following transductions, cells were maintained in culture for 5 days to induce EMT.
Wound Healing
MCF7 cells overexpressing SNAIL and control cells were grown to 100% confluence in a 6-well plate, and a scratch wound was made using a 1-ml pipette tip. The cells were washed three times with PBS and fed with complete media. Pictures were taken at 0, 24, and 48 h to monitor the recovery of the scratch wound.
Subcellular Fractionation
Nuclear, cytoplasmic, and membrane fractions were obtained by using a successive detergent extraction method as described by Adam et al. (21) with modifications. MCF7 and MDA-MB-231 (1 × 10⁷) cells were washed twice with PBS and lysed with 100 μl of hypotonic buffer M (50 mm HEPES, pH 7.4, 10 mm NaCl, 5 mm MgCl2, 0.1 mm EDTA, 1 mm Na3VO4, 1 mm NaF, and 1 mm Na4P2O7·10H2O) containing 5% v/v protease inhibitor mixture (product number P8340; Sigma-Aldrich). Samples were vortexed for 20 s, passed through a 25-gauge needle (20 times), and homogenized (D-130 tissue homogenizer, Biosystems, São José dos Pinhais, PR, Brazil) for 1 min. At this point, equal amounts of protein from MCF7 cells induced to EMT/non-transduced and MDA-MB-231 cells cultured in SILAC containing heavy lysine (13C6-l-lysine) were mixed. The nuclear pellet was obtained by centrifugation at 500 × g for 20 min at 4 °C. Supernatant was centrifuged at 16,000 × g for 15 min at 4 °C, collected, and designated as the cytoplasmic fraction. The pellet was treated with buffer A (25 mm MES, 150 mm NaCl, pH 6.5) and combined with an equal volume of buffer A containing 2% Triton X-100 (v/v) with protease and phosphatase inhibitors. After 60 min of incubation, samples were centrifuged at 16,000 × g for 20 min at 4 °C. The supernatant was collected and designated the membrane fraction. Protein extraction of the nuclear pellet was performed with lysis solution containing 8 m urea, 2% CHAPS, and protease inhibitor mixture. Three sonication cycles were carried out for 5 min each in an ultrasonic bath (Unique, São Paulo, SP, Brazil) with cooled water. Samples were centrifuged at 20,000 × g for 30 min at 4 °C, and supernatant was collected and stored at −80 °C. Western blot analysis was performed to determine the enrichment efficiency. The full experimental workflow is presented in supplemental Fig. 2.
In-gel Digestion and LC-MS/MS Analysis
50 μg of the cytoplasmic and nuclear fractions and 30 μg of the membrane fraction were dissolved in 30 μl of Laemmli sample buffer (22) containing dithiothreitol (1 mg/mg of total protein), boiled for 5 min to reduce disulfide bonds, and alkylated with iodoacetamide (5 mg/mg of total protein). Samples were then separated using a 10% SDS-PAGE (Bio-Rad). Gel lanes corresponding to each fraction were cut into 6 pieces of ∼1 cm each, washed, and digested with trypsin as described elsewhere (23). Tryptic peptides were successively extracted with 0.1% formic acid, 50% acetonitrile, and then 70% acetonitrile and dried by SpeedVac (Thermo Scientific, Marietta, OH). Peptide mixtures were dissolved in 10 μl of 5% acetonitrile, 0.1% formic acid and desalted using ZipTip columns (Supelco, Sigma-Aldrich) according to the manufacturer's instructions. Samples were eluted in 52.5% acetonitrile/water in 0.1% formic acid, dried again, and resuspended in 15 μl of 5% acetonitrile, 0.1% formic acid for LC-MS analysis. Samples were analyzed by LC-MS/MS using an LTQ-Orbitrap Elite mass spectrometer coupled with an UltiMate 3000 RSLCnano system (ThermoScientific). Chromatography was performed using an in-house packed 75-μm inner diameter (New Objective) × 25-cm-long C18 column packed with Magic C18 resin, at 600 nl/min, with 90-min linear gradients from 5 to 40% acetonitrile in 0.1% formic acid. MS/MS scans of the 10 most abundant doubly or triply charged ions in the FT-MS scan were selected for data-dependent analysis in the linear ion trap. Peptides and proteins were identified with the Computational Proteomics Analysis Systems (CPAS) (24), using the X!Tandem search engine (2013.2.01 release) (25) and Peptide Prophet (26) and Protein Prophet (27) algorithms for statistical validation of data and protein grouping. MS data were searched against a human proteome database (Uniprot, April 2014, 68,561 entries). Search parameters for tryptic peptides included up to two missed cleavages, mass tolerance of 0.5 Da for fragment ions, fixed cysteine modification with carbamidomethylation (+57.02146), variable methionine oxidation (+15.99491), and variable lysine modification (+6.020129) to account for both heavy and light SILAC labels. Only peptides with a Peptide Prophet score above 0.90 and precursor ions with δ mass less than 20 ppm were considered for protein quantification. The list of proteins was generated with a Protein Prophet cutoff value of 0.90, representing an overall protein false discovery rate of ∼1% based on the Protein Prophet estimate. Proteins were quantitated as described previously, using the Q3 algorithm (1.22a release) to measure SILAC peak intensities (28, 29). The mass spectrometry proteomics data have been deposited to the ProteomeXchange Consortium via the PRIDE partner repository (30) with the dataset identifier PXD002449.
Western Blotting
MCF7 or MDA-MB-231 cells were washed in cold PBS and lysed with 8 m urea, 0.1 m Tris buffer containing the protease inhibitor mixture (Sigma-Aldrich). Three sonication cycles were carried out for 5 min each in an ultrasonic bath (Unique, São Paulo, SP, Brazil) with cooled water. Lysates were centrifuged at 20,000 × g for 30 min at 4 °C, and the supernatants were designated as total cell lysates. The protein concentration was determined by the Bradford assay (Bio-Rad). Proteins were separated by SDS-PAGE and transferred to polyvinylidene fluoride membranes (GE Healthcare). Membranes were blocked with 5% non-fat dry milk in 0.05% Tween/TBS and incubated with the specific antibodies. Rabbit anti-β-actin (catalog no. 4970), rabbit anti-GAPDH (catalog no. 2118), rabbit anti-HDAC1 (catalog no. 2062), rabbit anti-MARCKS (catalog no. 5607), rabbit anti-Smad 2/3 (catalog no. 8685), rabbit anti-phospho-Smad2 (Ser-465/467)/Smad3 (Ser-423/425) (catalog no. 8828), rabbit anti-Snail (catalog no. 3879), rabbit anti-phospho-Akt (Ser- 473) (catalog no. 4060), rabbit anti-Akt (catalog no. 9272), rabbit anti-ZO-1(TJP1) (catalog no. 8193), rabbit anti-LGALS1 (catalog no. 12936), rabbit anti-SOD2 (catalog no. 13194), rabbit anti-β-tubulin (catalog no. 2128), rabbit anti-integrin β1 (catalog no. 9699), mouse anti-Cdc2 (catalog no. 9116), rabbit anti-Lyn (catalog no. 2796), rabbit anti-acetyl-histone H2B (Lys20) (catalog no. 2571), and horseradish peroxidase-conjugated secondary antibody goat anti-rabbit IgG and anti-mouse IgG were purchased from Cell Signaling (Beverly, MA). Rabbit anti-caveolin-1 (C3237) was purchased from Sigma-Aldrich, and goat anti-annexin A2 (AF3928) was purchased from R&D Systems. Donkey anti-goat IgG-HRP (sc-2033) was purchased from Santa Cruz Biotechnology (Santa Cruz, CA). The protein-antibody complex was detected using the ECL Western blotting detection reagents (GE Healthcare), and signals were detected using a CCD camera (Image Quant LAS 4000 mini, Uppsala, Sweden).
Quantitative Real-time PCR
Total mRNA extraction was performed with the TRIzol® reagent (Invitrogen) and reverse transcription reaction was done using the High Capacity cDNA Reverse Transcription kit (Life Technologies, Inc.), according to the manufacturers' instructions. Gene expression analysis was performed by quantitative PCR using with TaqMan® GeneExpression Assays (Invitrogen). PCR amplification was performed with ABI 7500 Sequence Detection (Life Technologies, Inc.) for the following genes: SNAIL, SLUG, TWIST1, ZEB1, TGFB1, FN1, VIM, ACTA2, COL1A1, FSP1, CDH2, and CDH1. GAPDH was used to normalize the mRNA amount for each sample. The 2−ΔΔCT method was chosen to calculate the relative gene expression levels (31).
HDAC Inhibition
MCF7 cells were incubated with 0.5–10 μg of suberoylanilide hydroxamic acid (SAHA, Vorinostat, Sigma-Aldrich), replenishing drug and media every 24 h. The final concentration of DMSO did not exceed 1:10,000 in culture medium.
Cell Cycle and Proliferation Rate
Cell proliferation rate was measured by monitoring the incorporation of bromodeoxyuridine (BrdU) detected by flow cytometry using the APC BrdU flow kit (Pharmingen) according to the manufacturer's instructions.
RESULTS
Molecular, Morphological, and Functional Evaluation of EMT Induction in MCF7 Cells by SNAIL
To ensure that the proteomic analysis is supported by detectable changes in MCF7 breast cancer cells related to EMT, we performed a detailed evaluation of the induction process using morphological, molecular, and functional tools. First, quantitative RT-PCR demonstrated expression changes in several genes involved in EMT. Fig. 1A shows that the transduction of SNAIL in MCF7 cells resulted in more than a 2000-fold increase in SNAIL endogenous expression levels. Concomitantly, levels of FN1, COL1A1, and CDH2 expression also increased by several orders of magnitude. Increased expression levels of VIM and FSP1, genes associated with mesenchymal cell morphology and motility, were also observed. Three other transcription factors (SLUG, TWIST1, and ZEB1), all closely related to EMT, were also stimulated by SNAIL overexpression. More importantly, TFGB1, the most important activator of the EMT program, presented gene expression up-regulation and TGFB1 protein detected on conditioned media for cells overexpressing SNAIL (supplemental Fig. 3). Conversely, only slight reduction in expression of CDH1 was observed. Overall, molecular changes observed by quantitative RT-PCR support the newly acquired mesenchymal characteristics by overexpressing SNAIL in MCF7 cells.
Fig. 1.
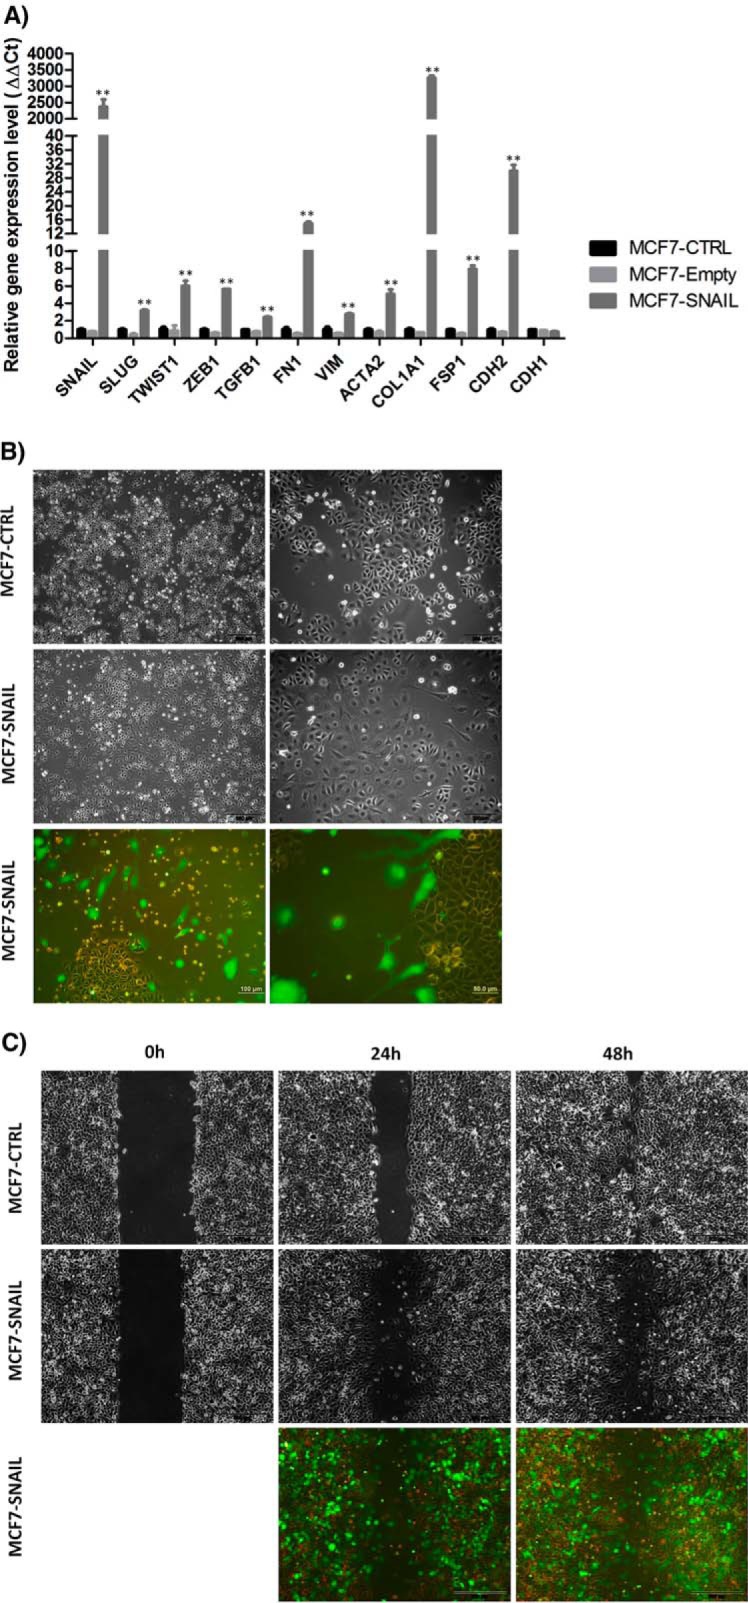
EMT induction in MCF7 cells by SNAIL overexpression. A, SNAIL overexpression induced increased expression levels of other EMT-related transcription factors (SLUG, TWIST1, and ZEB1), as well as TGFB1 growth factor and mesenchymal related genes (FN1, VIM, ACTA2, COL1A1, FSP1, and CDH2), as detected by quantitative real time PCR after 5 days of transduction. Bars indicate the mean ± S.D. Statistical significance was assessed by one-way analysis of variance. **, p < 0.01. B, morphological changes in MCF7 cells induced by SNAIL overexpression. Contrast phase and fluorescence microscopy. C, wound healing assay shows that SNAIL overexpression also increased cell migration in MCF7 cells compared with non-transduced cells. Pictures were taken at 0, 24, and 48 h, contrast phase and fluorescence microscopy. MCF7-CTRL, non-transduced; MCF7-Empty, transduced with empty vector; MCF7-SNAIL, transduced with vector expressing SNAIL.
Second, morphological changes observed by phase-contrast microscopy show alterations in cellular shape and size and loss of intercellular contact (Fig. 1B) after SNAIL overexpression in MCF7 cells. For several cells, a fusiform fibroblast-like shape is clearly observed (Fig. 1B). All these differences were more apparent when cells were visualized by fluorescence microscopy, and ZsGreen-positive cells overexpressing SNAIL were clearly isolated, free of cell-cell contacts and with enhanced migratory capacity (Fig. 1B). Third, the migratory characteristic of cells induced to EMT was also evaluated by a wound-healing assay. Fig. 1C illustrates that SNAIL-overexpressing MCF7 cells migrated and occupied the scratch space, whereas control cells just expanded the cell frontier. Fluorescence microscopy also highlights that ZsGreen-positive (SNAIL-overexpressing cells) takes the open space in the assay (Fig. 1C).
Proteomic Analysis of EMT Induction in MCF7 Cells by SNAIL
Because MCF7 cells induced to EMT cannot be significantly expanded after transduction with SNAIL, a conventional SILAC strategy, containing dialyzed fetal bovine serum, was not suitable for quantitative analysis. Therefore, a strategy of mixing cells induced to EMT (as well as a corresponding control) grown in regular media containing natural (“light”) lysine, with a reference cell line grown in heavy SILAC media (13C6 lysine), was adopted. As a reference cell line for the quantitative proteomic analysis, we chose the epithelial breast cancer cell line MDA-MB-231, which represents an advanced/metastatic tumor stage. Using strategies of subcellular fractionation combined with intact protein fractionation, we performed two proteomic studies mixing equal amounts (300 μg) of control or EMT-induced MCF7 cells with MDA-MB-231 heavy labeled cells. After mixing, cells were fractionated by differential centrifugation to obtain subcellular fractions enriched in cytoplasmic, nuclear, or membrane proteins. Quality of subcellular fractionation was confirmed by Western blotting, using antibodies specific to each subcellular compartment (Fig. 2A). Each subcellular fraction was further fractionated by SDS-PAGE, and gel lanes were cut into six bands, generating a total of 36 fractions. A schematic description of our experimental workflow is presented in supplemental Fig. 2. After in-gel trypsin digestion, fractions were individually analyzed by LC-MS/MS, and around 600,000 MS/MS scans were collected, providing confident protein identification for 4298 proteins (represented by unique gene names) with less than 1% false discovery rate (supplemental Table 1). Using Gene Ontology classification of the sets of proteins identified in each subcellular fraction (Fig. 2B), we observed different distributions of annotations, suggesting some complementarity among fractions. Of note, proteins from the mitochondrion were enriched in the nuclear fraction, whereas proteins from the endoplasmic reticulum, nuclear membrane, and membrane-bound vesicles were enriched in the membrane fraction. Other subcellular compartment annotations, such as cytoskeleton or chromosome, were enriched in the expected fractions, cytoplasm and nucleus, respectively.
Fig. 2.

Subcellular fractionation enriches cellular compartments and increases protein identification by mass spectrometry. A, Western blot validation of the subcellular fractionation method with antibodies specific to each subcellular compartment: nucleus, cytoplasm, and membrane. B, Gene Ontology classification of proteins enriched in each subcellular compartment. Subcellular compartment annotations were enriched in expected fractions and proteins representing specific cellular components were uncovered.
Our quantitative analysis used stringent criteria to select 348 differentially expressed proteins (supplemental Table 2). Only proteins that were observed with at least two peptides with associated quantitative information in both experiments and that showed changes greater than 2-fold in at a least one subproteome were considered. Control experiments were performed to support the validity of our quantitative approach and are presented in supplemental Fig. 4. Additionally, to prioritize proteins for further validation, we compared proteins differentially expressed in MCF7 induced to EMT by SNAIL overexpression with proteins equally differentially expressed in the comparison MDA-MB-231 versus control MCF7 (not induced to EMT).
Prioritized proteins were clustered according their pattern of expression. As shown in Fig. 3A, clusters 1 and 2 represent proteins that were down- or up-regulated in all three fractions, respectively; clusters 3 and 4 contain proteins that were down- or up-regulated in the nuclear and cytoplasmic fractions, respectively; clusters 5 and 6 represent proteins down- or up-regulated in the nuclear and membrane fractions, respectively. Conversely, some proteins were differentially expressed among the different subproteomes (clusters 7 and 8). Of note, ITGB1 (integrin β1) was up-regulated in nuclear and membrane fractions and down-regulated in the cytoplasm. Protein abundance distribution based on spectral counts was also associated with differentially expressed proteins. As also shown in Fig. 3A, subcellular fractionation shows a clear difference in protein abundance among different subcellular compartments.
Fig. 3.

Proteins differentially expressed in SNAIL-overexpressing MCF7 cells. A, from a total of 348 differentially expressed proteins, 65 were also differentially expressed in MCF7-SNAIL cells and in MDA-MB-231 cells. These proteins are potentially more related to the aggressive/migratory and metastatic phenotype. The clusters (left panel) indicate SNAIL up- or down-regulated proteins in two or more different subproteomes (C1–C6) and differentially expressed in different subproteomes (C7 and C8). Protein abundance distribution between different subproteomes was estimated based on spectral counts. Immunohistochemical data of breast cancer and normal tissues obtained from The Human Protein Atlas database (right panel) was used as an external indicator of relevance of protein expression regulation identified in our study. The 0–100% scale refers to the percentage of immunohistochemically stained breast cancer samples, and the color gradient represents the staining intensity: high (dark blue), medium (blue), low (light blue), not detected (white) or not available, according to Human Protein Atlas Database. B, Western blot validation (total cell extract) of proteins concordantly altered in the subproteomes in SNAIL-overexpressing MCF7 cells. C, Western blot validation of a subset of proteins differentially expressed in the subproteomes in SNAIL-overexpressing MCF7 cells. Each gel lane was loaded with 5 μg of total protein based on Bradford's quantification assay. MCF7-CTRL, non-transduced; MCF7-Empty, transduced with empty vector; MCF7-SNAIL, transduced with vector expressing SNAIL; Ns, nucleus MCF7-SNAIL; Nm, nucleus MDA-MB-231; Cs, cytoplasm MCF7-SNAIL; Cm, cytoplasm MDA-MB-231; Ms, membrane MCF7-SNAIL; Mm, membrane MDA-MB-231; Adp, adipocytes; Grn, glandular cells; Myo, myoepithelial cells; HI, high; MID, medium; LO, low; NO, not detected; N/A, not available.
Validation of Proteomic Findings Using Antibody-based Assays
Recent advances in the Protein Atlas (32) provided a resource for external evaluation (using an orthogonal method of immunohistochemistry) of whether the differentially expressed proteins selected from our proteomic data have been shown to be expressed in normal breast and/or breast cancer tissue. As observed in Fig. 3A, several proteins down-regulated by SNAIL, such as HDAC1, are highly expressed in normal breast tissues. These proteins could potentially represent metastasis suppressors. However, proteins with intense immunostaining in breast cancer tissue were irregularly distributed among up- or down-regulated proteins during SNAIL overexpression. In our selection of proteins for validation, and potentially correlated with EMT and metastasis, Protein Atlas information was considered highly relevant, because both up- and down-regulation of proteins might represent important processes for cancer progression.
Besides external Protein Atlas data, we also performed Western blotting for a subset of differentially expressed proteins for which high quality antibodies were commercially available. Levels of proteins differentially expressed in the compartments were measured in total cell extracts. As shown in Fig. 3B, Western blotting results were concordant with quantitative proteomics results (Fig 3A). Furthermore, we selected a subset of proteins for Western blotting validation in enriched subproteomes (Fig. 3C). ITGB1, CDK1 (cyclin-dependent kinase 1), SOD2 (superoxide dismutase mitochondrial), and HDAC1 (histone deacetylase 1) show antibody staining concordant with regulation as well as estimated protein amount based on spectral counts indicated in Fig. 3A.
Protein Networks
Using STRING (33), we performed a protein network analysis to identify major interactions and sets of coordinated cellular processes among proteins differentially expressed during EMT induced by SNAIL. Three distinct major cellular processes were significantly enriched (p value <10−5) as follows: 1) energy metabolism (oxidative phosphorylation); 2) cell cycle; and 3) chromatin binding and chromatin remodeling (networks not shown). The first cellular process is well described during events such as EMT, because deficiency in the glycolytic pathway and oxidative stress turn on ATP production and detoxification of oxygen-reactive species in the electron transfer chain/oxidative phosphorylation pathways (34). Cell cycle control, as well as chromatin remodeling, are especially relevant during EMT, and the proteins involved in both processes were selected and used to generate a simplified network (Fig. 4A). The network indicates two major hubs, CDK1 and HDAC1. CDK1 was down-regulated in the cytoplasm fraction as discovered by proteomic data and confirmed by Western blotting (Fig. 3C). A lower level of CDK1 was also observed in the nuclear fraction, although Western blotting does not support its nuclear up-regulation detected in the proteomic data. HDAC1, also detected mainly in the nuclear fraction, was down-regulated in both the cytoplasmic and nuclear fractions. As suggested by these protein networks, we then tested whether SNAIL overexpression had measurable impact over cell cycling using flow cytometry. Fig. 4B shows significant cell arrest in G0 + G1 phase, confirming SNAIL control over the cell cycle.
Fig. 4.

Network analysis of proteins differentially expressed in SNAIL-overexpressing MCF7 cells. A, STRING-DB analysis indicates that proteins differentially expressed are involved in the process of cell cycle and chromatin remodeling (p < 10−5). The network indicates two major hubs, CDK1 and HDAC1. B, cell cycle analyses by APC-BrdU/7-AAD (7-amino-actinomycin D) of MCF7 cells. SNAIL induced an increase in G0+G1 population. MCF7-CTRL, non-transduced; MCF7-Empty, transduced with empty vector; MCF7-SNAIL, transduced with vector expressing SNAIL.
Inhibition of HDAC Induces SNAIL Up-regulation
To determine whether HDAC1 has detectable effects on regular MCF7 cells, we used the specific chemical inhibitor SAHA to inhibit histone deacetylation activity. Fig. 5A shows changes in cellular morphology comparable with the changes observed in SNAIL-overexpressing MCF7 cells. Some reduction in cell proliferation was also observed upon HDAC inhibition, although there was no evidence of increased cellular migration in a wound healing assay (data not shown). To test whether these changes have any effect on SNAIL regulation, we performed a titration curve with SAHA and measured SNAIL levels by Western blot. As demonstrated in Fig 5B, SNAIL levels were proportional to SAHA concentration, indicating an inverse correlation between HDAC1 activity and levels of SNAIL. Interestingly, besides SNAIL overexpression, inhibition of HDAC1 by SAHA also increased the abundance of ITGB1, specifically in the membrane fraction (Fig 5C).
Fig. 5.

HDAC inhibition induces morphological changes and protein regulation via SNAIL up-regulation. A, MCF7 cells treated with 10 μm HDAC inhibitor SAHA for 24 h showed morphological changes comparable with those observed in SNAIL-overexpressing MCF7 cells. B, MCF7 cells were treated with different concentrations of SAHA (0.5–10 μm) for 24 h. SNAIL up-regulation was proportional to SAHA concentration. HDAC inhibition by higher doses of SAHA has some effect on levels of phosphorylated AKT (Ser-473) during 24 h of treatment. AKT activation was stronger in SNAIL-overexpressing MCF7 cells, whereas MDA-MB-231 has no effect on AKT activation. C, Western blot validation of ITGB1 and SNAIL in MCF7 subproteomes after treatment with 10 μM SAHA for 24h. Each gel lane was loaded with 5 μg of total protein based on Bradford's quantification assay. D, MCF7 cells were treated with 10 μM SAHA for 2 and 24 h. SAHA had greater AKT activation effects during early stages of treatment (2 h). MCF7-CTRL, non-treated; MCF7-SAHA, treated with HDAC inhibitor SAHA; MCF7-SNAIL, transduced with vector expressing SNAIL.
AKT Pathways Are Activated by SNAIL-induced EMT
As shown above, the induction of EMT by SNAIL overexpression and, to a minor extent, the inhibition of HDAC1 activity by SAHA, promotes changes associated with EMT. To test whether major pathways that regulate cell cycle and control cell growth are also affected, we tested the extent of AKT activation. Fig. 5B indicates that HDAC1 inhibition by higher doses of SAHA has a low effect on levels of phosphorylated AKT (Ser-473) during 24 h of treatment. SAHA showed a greater effect on AKT activation during early stages of treatment (2 h, Fig. 5D). AKT activation was stronger in SNAIL-overexpressing MCF7 cells, although MDA-MB-231 showed no indication of AKT activation.
DISCUSSION
EMT induces complex cellular and microenvironmental changes that, in cancer, culminate in enhanced invasive and migratory capabilities of tumor cells. Some factors are considered master regulators of EMT, including SNAIL (1, 5, 7–9). Overexpression of this transcription factor is found in several tumor types, correlates with tumor aggressiveness (10, 11), and promotes tumor recurrence (9). Here, we sought to use proteomics to identify additional regulators of EMT, dependent on SNAIL overexpression in the breast adenocarcinoma cell line MCF7, because main protein contributors in SNAIL-related EMT potentially represent targets to reduce both metastasis and cancer progression.
After successful transduction of MCF7 cells with SNAIL, we carried out detailed characterization of the EMT process prior to proteomic analysis. Morphological and functional changes detected in MCF7 cells overexpressing SNAIL were concordant with mesenchymal phenotypes. Wound healing assays demonstrated increased migratory ability of SNAIL-overexpressing cells because they detached from each other and rapidly occupied the scratch space.
Transduced MCF7 cells showed a more than 2000-fold increase in their originally very low levels of SNAIL gene expression. Increased expression of mesenchyme-related genes FN1, COL1A1, CDH2, VIM, and FSP1 and also the transcription factors SLUG, TWIST1, and ZEB1 were also demonstrated. These genes are recognized as part of the molecular signature of EMT and therefore confirm the acquisition of a mesenchymal phenotype (35). More importantly, increased expression of the TGFB1 gene and detection of TGFB1 protein in conditioned media resulted from SNAIL overexpression. The transcription factors SNAIL and SLUG activate the transforming growth factor-β signaling pathway in breast cancer (36), whereas TGF-β cell production also stimulates increased expression of SNAIL, SLUG and ZEB1 (37). This particular positive feedback loop is important for sustained EMT, but as we demonstrate here, additional cross-talk pathways are also becoming evident in EMT (5, 38).
To reveal detailed and quantitative proteome alterations during EMT induced by SNAIL overexpression, we applied an intact protein fractionation approach based on a combination of subproteome enrichment and GEL-LC-MS/MS (23, 39). Quantitative analysis based on standard SILAC proteomic analysis strategy was not compatible with SNAIL-overexpressing cells, because a significant decrease in cell proliferation occurred. To allow detailed and accurate quantitative analysis, we relied on a reference cell extract from the MDA-MB-231 cell line labeled with heavy lysine, added into both control MCF7 and SNAIL-overexpressing MCF7 cells prior to protein fractionation. The method is an adaptation of the super-SILAC approach (40), and the rationale for its application is the desire to compare the aggressive and migratory MDA-MB-213 cells, representative of an advanced stage of breast cancer, with MCF7 cells, representative of earlier stages of tumor progression that are acquiring aggressive characteristics through EMT. Therefore, proteins with similar regulation in comparison with MCF7-SNAIL/MCF7-Control and MDA-MB-231/MCF7-Control were initially prioritized and potentially related to the aggressive, migratory, and metastatic phenotype of EMT-induced cells.
The proteomic strategy also allowed differential quantitation of proteins in each enriched subproteome. Several examples show the significant enrichment of proteins in a single fraction, supporting the importance of subcellular fractionation for clear demonstration of protein regulation. In terms of potential cellular processes governing differential protein abundance in different cellular compartments, we highlight nuclear-cytoplasmic, membrane-cytoplasm translocations, or other cellular events of protein transport. As well described in literature, protein localization is highly dynamic and ensures proper cellular physiology, because proteins can have different functions and interactions in different cellular locations (41). This process also has great importance during EMT, and SNAIL is one such example, because post-translational modifications that are initiated by signaling pathways control its localization and degradation and consequently its activity (42).
Many differentially expressed proteins observed in our proteomics data and further verified by Western blot have already been described as related to EMT and tumor progression. Among these, several proteins have been measured in clinical samples of breast cancer and normal breast tissue by immunohistochemistry in the Protein Atlas database. Of note, some of these proteins are very abundant in normal breast tissue, such as MATR3 (Matrin-3), CPSF7 (Cleavage and Polyadenylation Specificity Factor Subunit 7), DX39B (Spliceosome RNA Helicase DDX39B), and HDAC1 (Histone Deacetylase 1), and all were down-regulated during EMT and also in the aggressive phenotype of MDA-MB-231. MATR3 plays a role in transcription, may interact with other nuclear matrix proteins, and binds to mRNA (43). CPFS7 is a component of the cleavage factor Im complex that plays a key role in pre-mRNA 3′-processing, binds to cleavage and polyadenylation RNA substrates, and is a target of miR-26b, which is a potent regulator of cancer behavior in estrogen receptor-positive cancers (44). DX39B (BAT1) is part of the TREX complex that is involved in nuclear export of spliced and unspliced mRNA and has been correlated to breast cancer aggressiveness (45, 46). HDAC1 has been extensively associated with epigenetic regulation of several processes, especially in cancer (47). Indeed, HDAC1 has been recently described as a metastasis repressor (48). Altogether, these data suggest that important nucleic acid processes are under regulation of SNAIL overexpression and could act as EMT or even tumor repressors.
As we showed in Fig. 4A, chromatin binding/remodeling and cell cycle control were the main protein networks altered in our dataset. Correlation between these two important cellular processes is suggested in our data by the link between HDAC1 and CDK1. There is evidence that CDK1 is the kinase responsible for phosphorylation of some HDAC1 binding partners (49), but additional information is scarce in the literature. Therefore, we evaluated the effect of SNAIL on cell cycle and epigenetic control independently.
SNAIL is responsible to some extent for decreased cell proliferation. We observed a reduced capacity of cell proliferation after overexpression of SNAIL, which was then further verified by a wound-healing assay. Additional results were obtained from the BrdU incorporation assay, demonstrating cellular arrest at G0/G1 phases. It has been demonstrated that despite the fact that SNAIL reduces tumor growth, it also promotes invasiveness and resistance to cell death (50). SNAIL impairs the transition from early to late G1 by maintaining low levels of cyclin D and can block the G1/S transition by maintaining high levels of p21. SNAIL also promotes resistance to lethal effects of cell cycle arrest by activating PI3K/AKT pathways. The conversion to the mesenchymal phenotype implies that a profound reorganization of the cytoskeleton may be incompatible with a highly proliferative state (51). Interestingly, lymphocyte migration and hepatoma cell invasion occur only in the G1 phase (51). Consequently, cell proliferation is not essential for tumor malignancy, even though an increase in cell division is essential for tumor formation and progression.
In our data, we observed that both SNAIL overexpression and HDAC inhibition in MCF7 cells induced phosphorylation of AKT. Treatment with SAHA also presented a dose-dependent effect on SNAIL levels. Besides promoting the resistance to cell death, AKT activity is also involved in several other cellular processes, such as regulation of oxidative stress (52). Indeed, one of the major cellular processes regulated in our proteomic analysis is oxidative phosphorylation (data not shown), which can also explain and/or reinforce the high levels of AKT phosphorylation in SNAIL-overexpressing MCF7 cells, even after 5 days in culture. In the same way, AKT activation in SAHA-treated cells can be related to oxidative stress. Several reports have demonstrated that HDAC inhibitors can stimulate reactive oxygen species generation, which in turn can activate AKT by inhibiting the phosphatase and tensin homologue (PTEN) (52).
The effects of SNAIL on epigenetic alterations during EMT and cancer are still unclear. Although SNAIL is able to induce long-lasting effects on its transcriptional targets, it was demonstrated that it binds to target promoters in a transient fashion. This may be caused by recruitment of additional cofactors that release SNAIL from its binding site or it can be released by the chromatin modifications themselves (53). Evidence shows that SNAIL interacts with repressor complexes and can cause bivalent histone modifications, allowing affected genes to be susceptible for reactivation (15). Of note, SNAIL can recruit the Sin3A-HDAC1-HDAC2 complex to the E-cadherin promoter, promoting its repression (54). It was demonstrated that HDAC inactivation can also induce EMT via SNAIL up-regulation, promoting its acetylation and thereby inhibiting its ubiquitination (55). Besides inducing SNAIL up-regulation by post-transcriptional regulation, HDAC1 inhibition can also promote SNAIL transcriptional expression and nuclear translocation (55). Here, we show the opposite process. SNAIL overexpression down-regulates HDAC1 during EMT induction. Notably, not only was the cross-talk between HDAC1 and SNAIL observed, but both HDAC1 and SNAIL also up-regulated important cancer progression effectors, such as ITGB1 (Figs. 3C and 5C). In fact, ITGB1 activity and up-regulation has been correlated to cancer malignancy and aggressiveness in different cancer types (56, 57). Despite all the information about epigenetic mechanisms in EMT regulation, it is still unknown how the chromatin modifiers and histone marks regulate this process (17).
In conclusion, our proteomic study of EMT induction by overexpressing the SNAIL transcription factor in MCF7 breast cancer cells showed important alterations in oxidative phosphorylation, cell cycle control, and chromatin modifications. Together, these findings reflect the complex network of processes that occur during EMT, reinforcing the idea of cooperative and co-regulated processes, as evidenced here for the cross-talk between inverse regulation of SNAIL versus HDAC1. Detailed knowledge of such a process can help in designing new strategies for cancer metastasis inhibition, potentially increasing patient life span and quality of life.
Supplementary Material
Acknowledgments
We thank Dr. Robert A. Weinberg, Leonardo Rodrigues, and Tathiane Maistro Malta, Whitehead Institute for Biomedical Research, Cambridge, MA, for providing the lentiviral vector used for SNAIL overexpression.
Footnotes
Author contributions: C.S.P., M.T.P., F.U.M., S.K., D.T.C., and V.M.F. designed the research; C.S.P., M.L.G., C.H.T., G.A.F., D.A., S.J.P., and V.M.F. performed the research; C.S.P., M.L.G., C.H.T., G.A.F., M.T.P., F.U.M., S.K., D.T.C., S.J.P., and V.M.F. contributed new reagents or analytic tools; C.S.P., M.L.G., C.H.T., G.A.F., D.A., M.T.P., F.U.M., S.J.P., and V.M.F. analyzed the data; C.S.P., M.L.G., C.H.T., G.A.F., S.J.P., and V.M.F. wrote the paper.
* This work was supported in part by FAPESP Young Scientist Grant 2011/09740-1, CNPq, Center for Cell-based Therapy-CTC-CEPID, FAPESP Grant 2013/08135-2, and CISBi-NAP.
 This article contains supplemental Figs. S1 to S4 and Tables S1 to S2.
1 The abbreviations used are:
- EMT
- epithelial to mesenchymal transition
- SAHA
- suberoylanilide hydroxamic acid
- HDAC
- histone deacetylase.
REFERENCES
- 1. Zheng H., and Kang Y. (2014) Multilayer control of the EMT master regulators. Oncogene 33, 1755–1763 [DOI] [PubMed] [Google Scholar]
- 2. Thiery J. P., Acloque H., Huang R. Y., and Nieto M. A. (2009) Epithelial-mesenchymal transitions in development and disease. Cell 139, 871–890 [DOI] [PubMed] [Google Scholar]
- 3. Kalluri R., and Weinberg R. A. (2009) The basics of epithelial-mesenchymal transition. J. Clin. Invest. 119, 1420–1428 [DOI] [PMC free article] [PubMed] [Google Scholar]
- 4. Brabletz T. (2012) To differentiate or not–routes toward metastasis. Nat. Rev. Cancer 12, 425–436 [DOI] [PubMed] [Google Scholar]
- 5. Lamouille S., Xu J., and Derynck R. (2014) Molecular mechanisms of epithelial-mesenchymal transition. Nat. Rev. Mol. Cell Biol. 15, 178–196 [DOI] [PMC free article] [PubMed] [Google Scholar]
- 6. Thiery J. P., and Sleeman J. P. (2006) Complex networks orchestrate epithelial-mesenchymal transitions. Nat. Rev. Mol. Cell Biol. 7, 131–142 [DOI] [PubMed] [Google Scholar]
- 7. Vetter G., Le Béchec A., Muller J., Muller A., Moes M., Yatskou M., Al Tanoury Z., Poch O., Vallar L., and Friederich E. (2009) Time-resolved analysis of transcriptional events during SNAI1-triggered epithelial to mesenchymal transition. Biochem. Biophys. Res. Commun. 385, 485–491 [DOI] [PubMed] [Google Scholar]
- 8. Naber H. P., Drabsch Y., Snaar-Jagalska B. E., ten Dijke P., and van Laar T. (2013) Snail and Slug, key regulators of TGF-β-induced EMT, are sufficient for the induction of single-cell invasion. Biochem. Biophys. Res. Commun. 435, 58–63 [DOI] [PubMed] [Google Scholar]
- 9. Moody S. E., Perez D., Pan T. C., Sarkisian C. J., Portocarrero C. P., Sterner C. J., Notorfrancesco K. L., Cardiff R. D., and Chodosh L. A. (2005) The transcriptional repressor Snail promotes mammary tumor recurrence. Cancer Cell 8, 197–209 [DOI] [PubMed] [Google Scholar]
- 10. Blanco M. J., Moreno-Bueno G., Sarrio D., Locascio A., Cano A., Palacios J., and Nieto M. A. (2002) Correlation of Snail expression with histological grade and lymph node status in breast carcinomas. Oncogene 21, 3241–3246 [DOI] [PubMed] [Google Scholar]
- 11. Peinado H., Olmeda D., and Cano A. (2007) Snail, Zeb and bHLH factors in tumour progression: an alliance against the epithelial phenotype? Nat. Rev. Cancer 7, 415–428 [DOI] [PubMed] [Google Scholar]
- 12. Cano A., Pérez-Moreno M. A., Rodrigo I., Locascio A., Blanco M. J., del Barrio M. G., Portillo F., and Nieto M. A. (2000) The transcription factor snail controls epithelial-mesenchymal transitions by repressing E-cadherin expression. Nat. Cell Biol. 2, 76–83 [DOI] [PubMed] [Google Scholar]
- 13. Sugimachi K., Tanaka S., Kameyama T., Taguchi K., Aishima S., Shimada M., Sugimachi K., and Tsuneyoshi M. (2003) Transcriptional repressor snail and progression of human hepatocellular carcinoma. Clin Cancer Res. 9, 2657–2664 [PubMed] [Google Scholar]
- 14. Francí C., Takkunen M., Dave N., Alameda F., Gómez S., Rodríguez R., Escrivà M., Montserrat-Sentís B., Baró T., Garrido M., Bonilla F., Virtanen I., and García de Herreros A. (2006) Expression of Snail protein in tumor-stroma interface. Oncogene 25, 5134–5144 [DOI] [PubMed] [Google Scholar]
- 15. Kiesslich T., Pichler M., and Neureiter D. (2013) Epigenetic control of epithelial-mesenchymal-transition in human cancer. Mol. Clin. Oncol. 1, 3–11 [DOI] [PMC free article] [PubMed] [Google Scholar]
- 16. Tam W. L., and Weinberg R. A. (2013) The epigenetics of epithelial-mesenchymal plasticity in cancer. Nat. Med. 19, 1438–1449 [DOI] [PMC free article] [PubMed] [Google Scholar]
- 17. Wu C. Y., Tsai Y. P., Wu M. Z., Teng S. C., and Wu K. J. (2012) Epigenetic reprogramming and post-transcriptional regulation during the epithelial-mesenchymal transition. Trends Genet. 28, 454–463 [DOI] [PubMed] [Google Scholar]
- 18. Chen J., Xu H., Zou X., Wang J., Zhu Y., Chen H., Shen B., Deng X., Zhou A., Chin Y. E., Rauscher F. J. 3rd., Peng C., and Hou Z. (2014) Snail recruits Ring1B to mediate transcriptional repression and cell migration in pancreatic cancer cells. Cancer Res. 74, 4353–4363 [DOI] [PMC free article] [PubMed] [Google Scholar]
- 19. Soule H. D., Vazguez J., Long A., Albert S., and Brennan M. (1973) A human cell line from a pleural effusion derived from a breast carcinoma. J. Natl. Cancer Inst. 51, 1409–1416 [DOI] [PubMed] [Google Scholar]
- 20. Cailleau R., Young R., Olivé M., and Reeves W. J. (1974) Breast tumor cell lines from pleural effusions. J. Natl. Cancer Inst. 53, 661–674 [DOI] [PMC free article] [PubMed] [Google Scholar]
- 21. Adam R. M., Yang W., Di Vizio D., Mukhopadhyay N. K., and Steen H. (2008) Rapid preparation of nuclei-depleted detergent-resistant membrane fractions suitable for proteomics analysis. BMC Cell Biol. 9, 30. [DOI] [PMC free article] [PubMed] [Google Scholar]
- 22. Laemmli U. K. (1970) Cleavage of structural proteins during the assembly of the head of bacteriophage T4. Nature 227, 680–685 [DOI] [PubMed] [Google Scholar]
- 23. Thomé C. H., dos Santos G. A., Ferreira G. A., Scheucher P. S., Izumi C., Leopoldino A. M., Simão A. M., Ciancaglini P., de Oliveira K. T., Chin A., Hanash S. M., Falcão R. P., Rego E. M., Greene L. J., and Faça V. M. (2012) Linker for activation of T-cell family member2 (LAT2) a lipid raft adaptor protein for AKT signaling, is an early mediator of alkylphospholipid anti-leukemic activity. Mol. Cell. Proteomics 11, 1898–1912 [DOI] [PMC free article] [PubMed] [Google Scholar]
- 24. Rauch A., Bellew M., Eng J., Fitzgibbon M., Holzman T., Hussey P., Igra M., Maclean B., Lin C. W., Detter A., Fang R., Faca V., Gafken P., Zhang H., Whiteaker J., Whitaker J., States D., Hanash S., Paulovich A., and McIntosh M. W. (2006) Computational Proteomics Analysis System (CPAS): an extensible, open-source analytic system for evaluating and publishing proteomic data and high throughput biological experiments. J. Proteome Res. 5, 112–121 [DOI] [PubMed] [Google Scholar]
- 25. MacLean B., Eng J. K., Beavis R. C., and McIntosh M. (2006) General framework for developing and evaluating database scoring algorithms using the TANDEM search engine. Bioinformatics 22, 2830–2832 [DOI] [PubMed] [Google Scholar]
- 26. Nesvizhskii A. I., Keller A., Kolker E., and Aebersold R. (2003) A statistical model for identifying proteins by tandem mass spectrometry. Anal. Chem. 75, 4646–4658 [DOI] [PubMed] [Google Scholar]
- 27. Keller A., Nesvizhskii A. I., Kolker E., and Aebersold R. (2002) Empirical statistical model to estimate the accuracy of peptide identifications made by MS/MS and database search. Anal. Chem. 74, 5383–5392 [DOI] [PubMed] [Google Scholar]
- 28. Faca V., Coram M., Phanstiel D., Glukhova V., Zhang Q., Fitzgibbon M., McIntosh M., and Hanash S. (2006) Quantitative analysis of acrylamide labeled serum proteins by LC-MS/MS. J. Proteome Res. 5, 2009–2018 [DOI] [PubMed] [Google Scholar]
- 29. Faca V. M., Song K. S., Wang H., Zhang Q., Krasnoselsky A. L., Newcomb L. F., Plentz R. R., Gurumurthy S., Redston M. S., Pitteri S. J., Pereira-Faca S. R., Ireton R. C., Katayama H., Glukhova V., Phanstiel D., Brenner D. E., Anderson M. A., Misek D., Scholler N., Urban N. D., Barnett M. J., Edelstein C., Goodman G. E., Thornquist M. D., McIntosh M. W., DePinho R. A., Bardeesy N., and Hanash S. M. (2008) A mouse to human search for plasma proteome changes associated with pancreatic tumor development. PLoS Med. 5, e123. [DOI] [PMC free article] [PubMed] [Google Scholar]
- 30. Vizcaíno J. A., Deutsch E. W., Wang R., Csordas A., Reisinger F., Ríos D., Dianes J. A., Sun Z., Farrah T., Bandeira N., Binz P. A., Xenarios I., Eisenacher M., Mayer G., Gatto L., Campos A., Chalkley R. J., Kraus H. J., Albar J. P., Martinez-Bartolomé S., Apweiler R., Omenn G. S., Martens L., Jones A. R., and Hermjakob H. (2014) ProteomeXchange provides globally coordinated proteomics data submission and dissemination. Nat. Biotechnol. 32, 223–226 [DOI] [PMC free article] [PubMed] [Google Scholar]
- 31. Pfaffl M. W. (2001) A new mathematical model for relative quantification in real-time RT-PCR. Nucleic Acids Res. 29, e45. [DOI] [PMC free article] [PubMed] [Google Scholar]
- 32. Uhlén M., Björling E., Agaton C., Szigyarto C. A., Amini B., Andersen E., Andersson A. C., Angelidou P., Asplund A., Asplund C., Berglund L., Bergström K., Brumer H., Cerjan D., Ekström M., Elobeid A., Eriksson C., Fagerberg L., Falk R., Fall J., Forsberg M., Björklund M. G., Gumbel K., Halimi A., Hallin I., Hamsten C., Hansson M., Hedhammar M., Hercules G., Kampf C., Larsson K., Lindskog M., Lodewyckx W., Lund J., Lundeberg J., Magnusson K., Malm E., Nilsson P., Odling J., Oksvold P., Olsson I., Oster E., Ottosson J., Paavilainen L., Persson A., Rimini R., Rockberg J., Runeson M., Sivertsson A., Sköllermo A., Steen J., Stenvall M., Sterky F., Strömberg S., Sundberg M., Tegel H., Tourle S., Wahlund E., Waldén A., Wan J., Wernérus H., Westberg J., Wester K., Wrethagen U., Xu L. L., Hober S., and Pontén F. (2005) A human protein atlas for normal and cancer tissues based on antibody proteomics. Mol. Cell. Proteomics 4, 1920–1932 [DOI] [PubMed] [Google Scholar]
- 33. Szklarczyk D., Franceschini A., Wyder S., Forslund K., Heller D., Huerta-Cepas J., Simonovic M., Roth A., Santos A., Tsafou K. P., Kuhn M., Bork P., Jensen L. J., and von Mering C. (2015) STRING v10: protein-protein interaction networks, integrated over the tree of life. Nucleic Acids Res. 43, D447–D452 [DOI] [PMC free article] [PubMed] [Google Scholar]
- 34. Wang Z., Li Y., and Sarkar F. H. (2010) Signaling mechanism(s) of reactive oxygen species in epithelial-mesenchymal transition reminiscent of cancer stem cells in tumor progression. Curr. Stem Cell Res. Ther. 5, 74–80 [DOI] [PMC free article] [PubMed] [Google Scholar]
- 35. Blick T., Widodo E., Hugo H., Waltham M., Lenburg M. E., Neve R. M., and Thompson E. W. (2008) Epithelial mesenchymal transition traits in human breast cancer cell lines. Clin. Exp. Metastasis 25, 629–642 [DOI] [PubMed] [Google Scholar]
- 36. Dhasarathy A., Phadke D., Mav D., Shah R. R., and Wade P. A. (2011) The transcription factors Snail and Slug activate the transforming growth factor-β signaling pathway in breast cancer. PLoS ONE 6, e26514. [DOI] [PMC free article] [PubMed] [Google Scholar]
- 37. Gupta P., and Srivastava S. K. (2014) HER2 mediated de novo production of TGFβ leads to SNAIL driven epithelial-to-mesenchymal transition and metastasis of breast cancer. Mol. Oncol. 8, 1532–1547 [DOI] [PMC free article] [PubMed] [Google Scholar]
- 38. Lindsey S., and Langhans S. A. (2014) Crosstalk of oncogenic signaling pathways during epithelial-mesenchymal transition. Front. Oncol. 4, 358. [DOI] [PMC free article] [PubMed] [Google Scholar]
- 39. Dreger M. (2003) Proteome analysis at the level of subcellular structures. Eur. J. Biochem. 270, 589–599 [DOI] [PubMed] [Google Scholar]
- 40. Geiger T., Cox J., Ostasiewicz P., Wisniewski J. R., and Mann M. (2010) Super-SILAC mix for quantitative proteomics of human tumor tissue. Nat. Methods 7, 383–385 [DOI] [PubMed] [Google Scholar]
- 41. Wang S. C., and Hung M. C. (2005) Cytoplasmic/nuclear shuttling and tumor progression. Ann. N.Y. Acad. Sci. 1059, 11–15 [DOI] [PubMed] [Google Scholar]
- 42. Zhou B. P., Deng J., Xia W., Xu J., Li Y. M., Gunduz M., and Hung M. C. (2004) Dual regulation of Snail by GSK-3β-mediated phosphorylation in control of epithelial-mesenchymal transition. Nat. Cell Biol. 6, 931–940 [DOI] [PubMed] [Google Scholar]
- 43. Salton M., Elkon R., Borodina T., Davydov A., Yaspo M. L., Halperin E., and Shiloh Y. (2011) Matrin 3 binds and stabilizes mRNA. PLoS ONE 6, e23882. [DOI] [PMC free article] [PubMed] [Google Scholar]
- 44. Verghese E. T., Drury R., Green C. A., Holliday D. L., Lu X., Nash C., Speirs V., Thorne J. L., Thygesen H. H., Zougman A., Hull M. A., Hanby A. M., and Hughes T. A. (2013) MiR-26b is down-regulated in carcinoma-associated fibroblasts from ER-positive breast cancers leading to enhanced cell migration and invasion. J. Pathol. 231, 388–399 [DOI] [PMC free article] [PubMed] [Google Scholar]
- 45. Guo S., Hakimi M. A., Baillat D., Chen X., Farber M. J., Klein-Szanto A. J., Cooch N. S., Godwin A. K., and Shiekhattar R. (2005) Linking transcriptional elongation and messenger RNA export to metastatic breast cancers. Cancer Res. 65, 3011–3016 [DOI] [PubMed] [Google Scholar]
- 46. Masuda S., Das R., Cheng H., Hurt E., Dorman N., and Reed R. (2005) Recruitment of the human TREX complex to mRNA during splicing. Genes Dev. 19, 1512–1517 [DOI] [PMC free article] [PubMed] [Google Scholar]
- 47. Lakshmaiah K. C., Jacob L. A., Aparna S., Lokanatha D., and Saldanha S. C. (2014) Epigenetic therapy of cancer with histone deacetylase inhibitors. J. Cancer Res. Ther. 10, 469–478 [DOI] [PubMed] [Google Scholar]
- 48. Gong C., Qu S., Lv X. B., Liu B., Tan W., Nie Y., Su F., Liu Q., Yao H., and Song E. (2014) BRMS1L suppresses breast cancer metastasis by inducing epigenetic silence of FZD10. Nat. Commun. 5, 5406. [DOI] [PubMed] [Google Scholar]
- 49. Guo H., and Friedman A. D. (2011) Phosphorylation of RUNX1 by cyclin-dependent kinase reduces direct interaction with HDAC1 and HDAC3. J. Biol. Chem. 286, 208–215 [DOI] [PMC free article] [PubMed] [Google Scholar]
- 50. Barrallo-Gimeno A., and Nieto M. A. (2005) The Snail genes as inducers of cell movement and survival: implications in development and cancer. Development 132, 3151–3161 [DOI] [PubMed] [Google Scholar]
- 51. Vega S., Morales A. V., Ocaña O. H., Valdés F., Fabregat I., and Nieto M. A. (2004) Snail blocks the cell cycle and confers resistance to cell death. Genes Dev. 18, 1131–1143 [DOI] [PMC free article] [PubMed] [Google Scholar]
- 52. Azad M. B., Chen Y., and Gibson S. B. (2009) Regulation of autophagy by reactive oxygen species (ROS): implications for cancer progression and treatment. Antioxid. Redox Signal. 11, 777–790 [DOI] [PubMed] [Google Scholar]
- 53. Javaid S., Zhang J., Anderssen E., Black J. C., Wittner B. S., Tajima K., Ting D. T., Smolen G. A., Zubrowski M., Desai R., Maheswaran S., Ramaswamy S., Whetstine J. R., and Haber D. A. (2013) Dynamic chromatin modification sustains epithelial-mesenchymal transition following inducible expression of Snail-1. Cell Rep. 5, 1679–1689 [DOI] [PMC free article] [PubMed] [Google Scholar]
- 54. Peinado H., Ballestar E., Esteller M., and Cano A. (2004) Snail mediates E-cadherin repression by the recruitment of the Sin3A/histone deacetylase 1 (HDAC1)/HDAC2 complex. Mol. Cell. Biol. 24, 306–319 [DOI] [PMC free article] [PubMed] [Google Scholar]
- 55. Jiang G. M., Wang H. S., Zhang F., Zhang K. S., Liu Z. C., Fang R., Wang H., Cai S. H., and Du J. (2013) Histone deacetylase inhibitor induction of epithelial-mesenchymal transitions via up-regulation of Snail facilitates cancer progression. Biochim. Biophys. Acta 1833, 663–671 [DOI] [PubMed] [Google Scholar]
- 56. Zhang L., and Zou W. (2015) Inhibition of integrin β1 decreases the malignancy of ovarian cancer cells and potentiates anticancer therapy via the FAK/STAT1 signaling pathway. Mol. Med. Rep. 12, 7869–7876 [DOI] [PMC free article] [PubMed] [Google Scholar]
- 57. Kurozumi A., Goto Y., Matsushita R., Fukumoto I., Kato M., Nishikawa R., Sakamoto S., Enokida H., Nakagawa M., Ichikawa T., and Seki N. (2016) Tumor-suppressive microRNA-223 inhibits cancer cell migration and invasion by targeting ITGA3/ITGB1 signaling in prostate cancer. Cancer Sci. 1, 84–94 [DOI] [PMC free article] [PubMed] [Google Scholar]
Associated Data
This section collects any data citations, data availability statements, or supplementary materials included in this article.