

Abstract
The simultaneous detection of all the post-transcriptional modifications (PTMs) that decorate cellular RNA can provide comprehensive information on the effects of changing environmental conditions on the entire epitranscriptome. To capture this type of information, we performed the analysis of ribonucleotide mixtures produced by hydrolysis of total RNA extracts from S. cerevisiae that was grown under hyperosmotic and heat shock conditions. Their global PTM profiles clearly indicated that the cellular responses to these types of stresses involved profound changes in the production of specific PTMs. The observed changes involved not only up-/down-regulation of typical PTMs, but also the outright induction of new ones that were absent under normal conditions, or the elimination of others that were normally present. Pointing toward the broad involvement of different classes of RNAs, many of the newly observed PTMs differed from those engaged in the known tRNA-based mechanism of translational recoding, which is induced by oxidative stress. Some of the expression effects were stress-specific, whereas others were not, thus suggesting that RNA PTMs may perform multifaceted activities in stress response, which are subjected to distinctive regulatory pathways. To explore their signaling networks, we implemented a strategy based on the systematic deletion of genes that connect established response genes with PTM biogenetic enzymes in a putative interactomic map. The results clearly identified PTMs that were under direct HOG control, a well-known protein kinase pathway involved in stress response in eukaryotes. Activation of this signaling pathway has been shown to result in the stabilization of numerous mRNAs and the induction of selected lncRNAs involved in chromatin remodeling. The fact that PTMs are capable of altering the activity of the parent RNAs suggest their possible participation in feedback mechanisms aimed at modulating the regulatory functions of such RNAs. This tantalizing hypothesis will be the object of future studies.
The viability of a cellular system is largely predicated on its ability to recognize and respond to a variety of environmental conditions (1, 2). External stimuli elicit counteracting compensatory responses intended to maintain growth and ensure survival. Cell adaptation in response to stressors, such as sudden variations of temperature, osmotic conditions, and availability of nutrients, produces significant variations of enzyme activity and metabolism, which are orchestrated by well calibrated regulatory controls (3). Owing to its multifaceted activities in protein synthesis and newly discovered functions in gene regulation, RNA is uniquely positioned among cellular components to act as a communication node between metabolic and regulatory mechanisms of stress response (4, 5). This principle is realized in the activity of mitogen-activated protein kinase (MAPK)1 pathways induced in many eukaryotic systems by heat and osmotic stress (6, 7). In S. cerevisiae, activation of the hyperosmolarity glycerol (HOG) MAPK pathway produces conspicuous variations of the activity of ion channels, glycerol export, general protein machinery, and cell cycle progression (8–11). The transcriptional response to osmostress includes the induction and stabilization of hundreds of mRNAs (12–14) and the up-regulation of specific families of long noncoding RNAs (lncRNAs) (15), as well as a general down-regulation of gene expression (15–18). Significantly, the latter class of RNA has been shown to induce chromatin remodeling and variations of nucleosome occupancy that have lasting effects on cellular memory and epigenetic makeup (21–23).
In recent years, covalent modification and nucleotide editing have increasingly been recognized as effective mechanisms for modulating the functions of RNA (24). Natural RNA contains over 100 variants of the four canonical bases, which are cataloged in the RNA Modification (25, 26) and MODOMICS (27, 28) databases. These post-transcriptional modifications (PTMs) are generated by specific biogenetic enzymes and possess the ability to stabilize single base pairs and alternative hydrogen bonding patterns, which contribute to the astonishing diversity of RNA structure (29, 30). At the same time, the observation that unmodified tRNAs were not loaded efficiently with the respective aminoacyl groups, whereas specific modifications prevented incorrect loading altogether (31), revealed that PTMs play essential roles in protein–RNA recognition. Analogous effects were observed in RNA–RNA recognition for hypermodified nucleotides in the tRNA anticodon loop, which were shown to induce translational recoding by affecting the accuracy of codon–anticodon interactions (24). The detection of an increased incidence of anticodon loop modification upon treatment with hydrogen peroxide has led to the assertion that translational recoding is an essential mechanism of response to oxidative stress (32, 33). Owing to the almost exclusive emphasis on tRNA and rRNA as abundant sources of PTMs, little else is known about their biological functions and distribution in other classes of RNAs. However, their enzymatic biogenesis supports the tantalizing hypothesis that PTMs may constitute key elements of common feedback mechanisms for modulating the activity of regulatory RNAs.
To support the investigation of entire epitranscriptomes, we have developed a novel approach for the analysis of all the PTMs contained in a target cell (34). This approach relies on the extraction of total RNA from the sample, followed by digestion into individual mononucleotides and analysis by direct infusion electrospray ionization (ESI) (35). The selected workflow eschews high-resolution chromatography to minimize possible separation bias, reduce losses during sample transfer/manipulation, and expedite the analysis by reducing the number of necessary operations. Alternative combinations of high-resolution and multistep tandem mass spectrometry (MSn) (36, 37), or ion mobility spectrometry-mass spectrometry (IMS-MS) (38–40) and gas-phase fragmentation techniques can be independently employed to complete the characterization of the mononucleotide mixtures with excellent sensitivity (34, 41). Either combination can afford both identity and abundance of any PTM present in the total RNA extract, thus providing comprehensive and unbiased profiles at the entire transcriptome level. This approach has been shown capable of revealing not only significant differences, but also subtle variations of PTM expression between samples grown in different media, or obtained altogether from different organisms (34).
In this report, we employed our global profiling approach to investigate the possible existence of a broad, general link between PTM expression and stress response, which goes beyond the known mechanism of tRNA-based translational recoding. Preliminary experiments were aimed at evaluating whether different types of stresses, such as heat shock and hyperosmotic stress, produced distinctive PTM profiles that could be ascribed to different response mechanisms. We subsequently focused on the HOG pathway because of the wealth of available information on its role in the hyperosmotic stress response (9, 10), including the well-characterized induction and stabilization of mRNAs and lncRNAs (12–15). A key component of this pathway is the highly conserved MAPK protein Hog1, a stress-activated protein kinase homologous to mammalian p38 and c-Jun N-terminal kinase, which is involved in multiple phases of the cell cycle and has the ability to reprogram gene expression in the presence of stress (42). For this reason, we first compared PTM profiles obtained from wildtype S. cerevisiae (i.e. WT) in the absence and presence of osmostress to identify possible PTM variations that correlated with the known induction of stress-response coding and noncoding genes (43). Then, we performed the profiling of a mutant strain in which the HOG1 gene was deleted (i.e. hog1Δ) to discriminate hog1-dependent PTMs from those that were induced by osmostress without falling under direct control of HOG1. Finally, we implemented an interactome-walk strategy in which the genes connecting HOG1 with PTM biogenetic enzymes in putative interactomics maps were sequentially deleted to retrace the signaling cascade and show a direct relationship between PTM expression and this stress response pathway. For the purpose of obtaining proof-of-principle and evaluating the significance of this approach, we explored the putative pathway leading from HOG1 to RIT1, the enzyme responsible for one of the most prominent stress-induced modifications observed in the study. The results clearly showed the merits of monitoring the broader impact of individual gene deletions on PTM biogenesis at the entire transcriptome level.
MATERIALS AND METHODS
Preparation of Cellular Extracts
Saccharomyces cerevisiae strain BY4741 (defined here as wildtype, WT), as well as hog1Δ::kanMX, ssb1Δ::kanMXi, rit1Δ::kanMX, and hog1Δ::kanMX derivatives obtained according to established procedures (44, 45), were purchased directly from Open Biosystems (Huntsville, AL). Yeast strains were grown in yeast extract, peptone, dextrose (YPD) medium. Each strain was streaked onto YPD agar and incubated at 30 °C. For all studies, an individual colony was selected from a plate and placed into an individual tube containing 20 ml of YPD. The culture was incubated at either 30 or 37 °C with 200 rpm gyration. Optical density at 600 nm (OD600) was monitored on a ThermoFisher Scientific (Waltham, MA) Nanodrop 2000c spectrophotometer until a value greater than 0.3 units was achieved. Liquid cultures left untreated were diluted to a final 0.3 OD600 and centrifuged at 6000 × g for 5 min to obtain pellets that contained approximately the same number of cells. Each sample was grown in parallel in at least five separate cultures (biological replicates) and the material obtained from each of them was submitted to five independent analyses (technical replicates). To assess the possible effects of osmostress on RNA modification profiles, S. cerevisiae was grown to mid-log phase and induced with 0.4 m NaCl. Liquid cultures were then incubated for an additional 15 min, as these conditions have been found to specifically overexpress ∼343 coding genes and ∼173 lncRNAs (43). In all cases, the reported results were the average of at least five biological replicates, each of which submitted to five technical repeats.
Sample Preparation and Mass Spectrometric Analysis
Each pellet was disrupted by using Denaturation Solution (Life Technologies, Grand Island, NY). Total RNA was extracted by using the ToTALLY RNA Extraction Kit (Life Technologies), which is based on a typical phenol/chloroform procedure. The RNA was precipitated by using cold isopropanol and then treated with DNase 1 (New England Biolabs, Ipswich, MA) in 1X DNase buffer to remove any remaining DNA. The recovered RNA was subsequently desalted by ethanol precipitation overnight and reconstituted in 50 μl of RNase-free water (Sigma-Aldrich, St. Louis, MO). The concentration of intact total RNA from each sample was measured by UV absorbance at 260 nm. Nuclease P1 and phosphodiesterase 1 from snake venom (Sigma-Aldrich) were employed to complete the digestion of RNA into individual mononucleotides, as previously described (46). Immediately before analysis, final samples were diluted 1:10 in 150 mm ammonium acetate and 10% isopropanol.
Mass spectrometric analyses were carried out by direct infusion ESI on either a Waters (Milford, MA) Synapt G2 HDMS IMS mass spectrometer, or a ThermoFisher Scientific LTQ-Orbitrap Velos mass spectrometer. All analyses were performed in nanoflow ESI mode by using quartz emitters produced in house. Up to 5 μl samples were typically loaded into each emitter by using a gel-loader pipette tip. A stainless steel wire was inserted in the back-end of the emitter to supply an ionizing voltage that ranged between 0.9 and 1.2 kV. Source temperature and desolvation conditions were adjusted by closely monitoring the incidence of ammonium adducts and water clusters (47).
Analyses performed on the IMS-MS instrument provided heat maps that offered comprehensive representations of the entire complement of PTMs present in the sample. For these experiments, the instrument was calibrated by using a 2 mg/ml solution of cesium iodide in 50:50 water/methanol. This external calibration provided typical ∼9 ppm accuracy (34, 41). For comprehensive mixture analysis, the Tri-WAVE region was held at a pressure of ∼4.40 mbar (uncalibrated gauge reading) by a 90 ml/min flow of N2 and 180 ml/min of He. It was operated with an ∼650 m/s IMS wave velocity, a 40 V wave height, a 109 m/s transfer wave velocity, and a 2.0 V transfer wave height. Time aligned parallel (TAP) dissociation and mass-selected time-aligned (MaSTeR) fragmentation of isobaric/isomeric species were performed as previously described (34, 41). Briefly, TAP experiments involved transmitting all ions produced by the nanospray source through the quadrupole (Q) element of the instrument, and then injecting them into the Tri-WAVE region to enable their discrimination according to their arrival time (tD). Activation was performed in parallel for all ions that reached the transfer region of the instrument located immediately after the Tri-WAVE element. The fragments were readily detected in the time-of-flight (TOF) analyzer, thus preserving the relationship between each set of fragments and the tD of the respective precursor(s) (41). In contrast, MaSTeR experiments involved transmitting only a specific population of ions sharing the same m/z value through the mass-selective Q. The mass-selected precursors, which could comprise multiple isobaric/isomeric species, were then allowed to disperse on the time domain in the Tri-WAVE element and then activated in the transfer region (34). Therefore, the difference between these techniques is that the former can provide fragmentation data simultaneously for all possible ions contained in the sample, whereas the latter mimics a true tandem MS experiment in which precursor ions are sequentially selected according to both m/z and tD characteristics in the Q and Tri-WAVE regions, respectively.
Analyses performed on the LTQ-Orbitrap provided accurate mass and fragmentation data that were used to confirm the initial assignments afforded by the IMS-MS experiments. For high resolution/accuracy determinations, the instrument was calibrated by using an anion mixture that contained sodium dodecyl-sulfate, sodium taurocholate, and Ultramark. We have previously shown that this external calibration can afford typical ∼200 ppb accuracy (34, 41). For analytes the size of ribonucleotides, this level of accuracy reduces considerably the number of possible elemental compositions that may fit the observed masses, thus increasing the level of confidence in the data interpretation. Tandem mass spectrometry (MS/MS) (48), multistep activation experiments (MSn) (36, 37), and consecutive reaction monitoring (CRM) (49) were performed as previously described (34, 41). MSn and CRM were specifically employed to corroborate the identity of isobaric/isomeric species, which was initially obtained from IMS-MS determinations.
Data Treatment
The experimental masses obtained from either the IMS-MS or LTQ-Orbitrap instrument were transformed into a readable file format by using MSConvert (50), and then employed to search the RNA Modifications (51), MODOMICS (52), or a home-built database (34). The initial database “hits” were subsequently confirmed by TAP and MaSTeR determinations on the IMS-MS instrument. In the case of isomeric/isobaric species, the results were further corroborated by MSn and CRM analyses on the LTQ-Orbitrap. At the same time, the initial heat map data provided by IMS-MS determinations were also subjected to data reduction, alignment, and scaling to enable point-by-point data subtraction. The results were visualized in heat map format by using OriginPro 9.1 (Origin Lab, North Hampton, MA) to readily highlight subtle variations of PTM expression between samples.
The abundance of detected species was expressed in relative, rather than absolute terms, to enable an immediate appreciation of over-/under-expression under the selected experimental conditions. As discussed in detail in reference 34, the abundance of each species was expressed as percentage of the cumulative abundances of the canonical ribonucleotides detected in the same sample, defined as abundance versus proxy (AvP):
 |
in which aix is the signal intensity of the analyte x, whereas cri is the intensity of each of the four canonical ribonucleotides. Based on the observation that the canonical ribonucleotides are under genetic rather than metabolic control, their overall abundance is only minimally affected by the presence of modifications. For this reason, the canonical ribonucleotides can be pooled together to serve as a proxy internal standard for obtaining relative abundances expressed in percentage terms. In previous work, the standard addition method was employed to determine the absolute amounts of selected PTMs in yeast, which allowed the calculation of the corresponding AvP values to confirm the validity of this approach (34).
All AvP values included in this report were the average of the results acquired from a minimum of five different samples grown separately under the same experimental conditions (biological replicates). The data obtained from each strain/condition were compared with those afforded by the wildtype BY4741 strain grown in YPD at 30 °C, as described above, which represented the baseline for these determinations. A paired two-tailed Student's t test was employed to assess the statistical significance of the comparison, which was accomplished at the 95% confidence level (i.e. corresponding to a p value of 0.05). The test was applied to each species detected in both the sample of interest and wildtype control. In this way, any variation with a p value smaller than 0.05 was considered significant and was marked with different shades of color in the tables according to whether the variation represented over- or underexpression in comparison to the wildtype.
RESULTS and DISCUSSION
Global Epitranscriptomics Analysis
The cellular response staged by an organism under stress involves the concurrent and coordinated activation of numerous metabolic pathways. Therefore, investigating the fate of an individual PTM can provide only a limited view of its role in the overall response mechanism. In contrast, the ability to monitor multiple PTMs at the same time can provide valuable insights into their synergistic activities and coordination at the system level. This type of information can be obtained through analytical strategies capable of multiplexing PTM detection and accurately assessing their mutual expression levels. In this direction, we have recently developed a strategy for obtaining complete PTM profiles, which involves the analysis of total RNA extracts obtained from cell lysates (34). The material is subsequently digested by selected exonucleases to produce mononucleotide mixtures that are analyzed without front-end separation procedures (see Materials and Methods). The complexity of these types of mixtures can be readily resolved by high-resolution MS analysis, followed by tandem MS for structure verification (34). Alternatively, IMS-MS analysis can accomplish the task by discriminating analytes according to both mass and ion mobility behavior. The latter is determined by the probability of ions to interact with background gas while traveling in a moderate electric field, which is a function of size and conformation (38–40). The interactions affect the time of arrival (tD) of each ion, which is plotted against the corresponding mass-to-charge ratio (m/z) to obtain comprehensive 3D-plots or heat maps. Fig. 1 shows representative heat maps in which the relative intensity of detected ions—corresponding to the third dimension of a 3D-plot—is represented by a color gradient. In this way, heat maps can provide comprehensive visual representations of all species in the samples, which enabled immediate comparisons between strains grown under different environmental conditions (e.g. Fig. 1A and 1B), or between wildtype and mutant strains (e.g. Fig. 1A and 1C, vide infra).
Fig. 1.

Representative heat maps obtained by anionic IMS-MS analysis of S. cerevisiae grown in YPD medium at either A, 30 °C (WT, control) or B, 37 °C (WT37, heat shock); and C, rit1Δ strain grown at 30 °C (rit1Δ). Panel D, shows the expanded regions containing the Ar(p) modification, which enable one to readily compare its expression levels in the respective samples. The intensity axis of the heat maps were scaled to the same level to enable direct comparisons by using the color gradient provided on the right. The expanded region in panel A shows the separation achieved on the time domain for the U/Ψ isobars.
The data depicted in Fig. 1A were obtained from S. cerevisiae strain BY4741, which was grown under normal conditions in YPD medium at 30 °C (WT control, see Materials and Methods). The mass information provided on the y axis was readily employed to search a nonredundant database compiled in house from the entries available in the RNA Modifications (51) and MODOMICS (52) databases. The initial database “hits” included numerous isomeric/isobaric species that shared the same elemental composition and, thus, could not be readily discriminated on the basis of mass alone. However, as shown earlier for the uridine/pseudouridine couple (41) and a series of methyl-guanine products (34), the different structures associated with the isomeric species translated into distinctive ion mobility behaviors that were readily differentiated on the tD dimension (see for example Fig. 1A inset). Efforts to appropriately calibrate the tD axis in different hardware platforms are currently underway to enable the use of characteristic tD values as unique identifiers for individual PTMs. In the meantime, we capitalized on the ability to disperse isomeric/isobaric species on the time domain to enable their separate gas-phase activation and fragmentation. In what has been defined as mass-selected time-resolved (MaSTeR) dissociation determinations (34), each target precursor can be isolated in the mass-selective quadrupole of the instrument, allowed to disperse temporally in the ion mobility element, and then activated in the transfer region, before detection of the ensuing fragments in the time-of-flight analyzer (see Materials and Methods).
This type of analysis can be exemplified here for the species detected at m/z 365.024 in Fig. 1A, which was provisionally assigned to the isomeric/isobaric couple ac4C/f5Cm by the initial database search. The arrival time distribution (ATD) obtained by isolating the precursor ion in the mass-selective quadrupole is shown in Fig. 2A. Analyzed with the aid of an appropriate deconvolution algorithm (see Materials and Methods), the recorded signal revealed the presence of two discrete components that were discriminated on the tD dimension despite their widely different abundances. The identities of these components were confirmed by examining pertinent reconstructed ion chromatograms (RICs) obtained by extracting the masses of unique isomer-specific fragments from the recorded fragmentation dataset. Indeed, the tD of the signal present on the RIC of m/z 154 (Fig. 2B) matched that of the more abundant species in the overall ATD (Fig. 2A), thus identifying this component as the ac4C isobar. In contrast, the signal on the RIC of m/z 136 (Fig. 2C) matched the less abundant species, which confirmed its identity as the f5Cm isobar. As corroborated separately by regular tandem MS, these isobar-specific fragments were produced by the loss of the corresponding nucleobase moieties that bore the covalent modifications (see supplemental Fig. S4). A manuscript in preparation will provide the unique precursor → fragment transitions necessary to confirm the identity of all PTMs observed in these yeast samples. This type of analysis was carried out for all initial database “hits” to complete their positive identification (see Supporting Material for additional representative data). The PTMs corroborated by fragmentation data were listed in Table IA.
Fig. 2.

A, IMS-MS arrival time distribution (ATD) obtained after isolation of the precursor ion observed with m/z 365 in Fig. 1A. The dotted line corresponds to the original data, whereas solid lines are the Gaussian-fitted signals (see Materials and Methods). Reconstructed ion chromatograms (RIC) obtained by extracting from the product ion's dataset the fragments with m/z 154, B, and m/z 136, C, which are respectively characteristic of ac4C and f5Cm (see Supporting Material). Dots mark the centroids of the respective signals.
Table I. Quantitative determination of ribonucleotides present in total RNA extract of S. cerevisiae grown at A) 30 °C (WT, control); B) 37 °C (WT37, heat shock); C) 30 °C after treatment with 0.4 m NaCl (WTS, osmostress); D) 37 °C after treatment with 0.4 m NaCl (WTS,37); hog1Δ grown at E) 30 °C (hog1Δ); F) 37 °C (hog1Δ37); G) 30 °C after treatment with 0.4 m NaCl (hog1ΔS); and H) 37 °C after treatment with 0.4 m NaCl (see Materials and Methods).
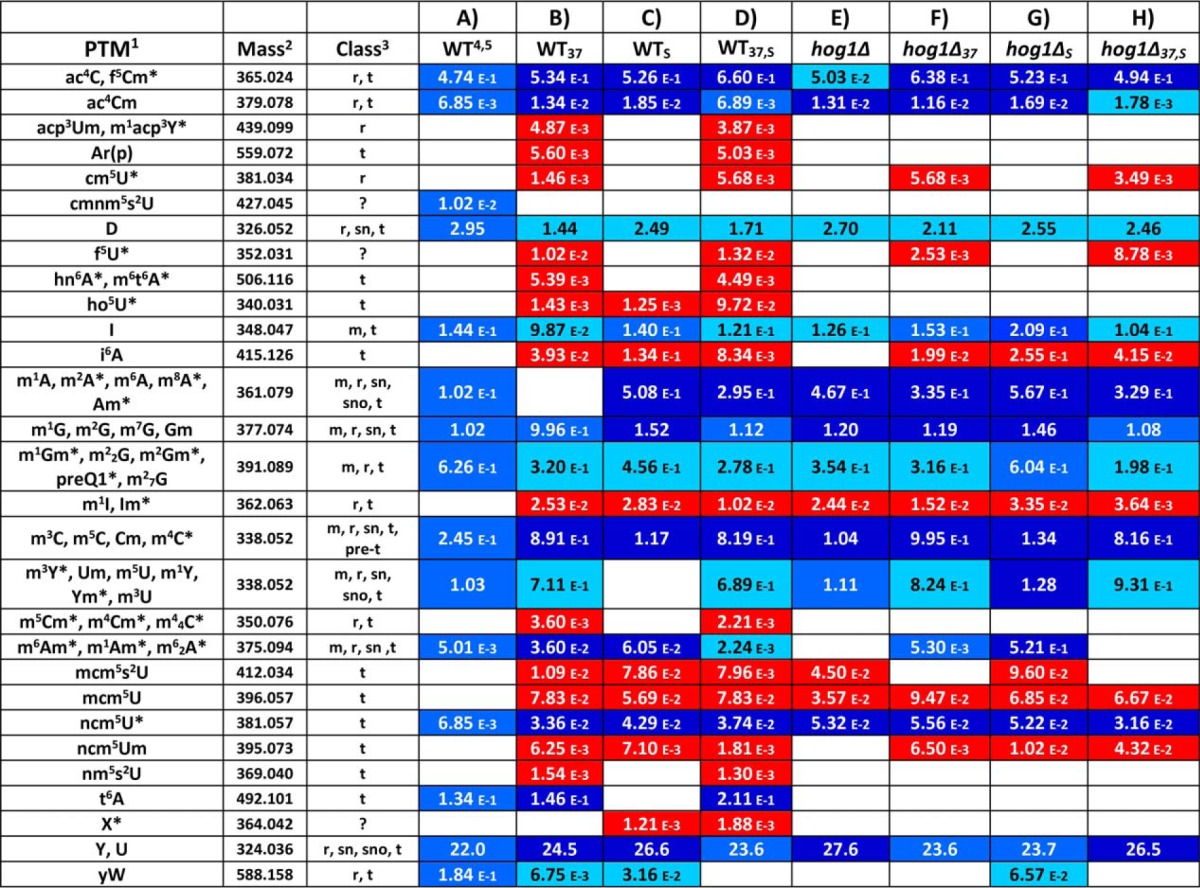
1Full names available at http://mods.rna.albany.edu/.
2Neutral experimental mass expressed in mass units (u).
3Putative classes of RNAs include: messenger RNA (m); ribosomal RNA (r); transfer RNA (t); pre-transfer RNA (pre-t); small nuclear RNA (sn); small nucleolar RNA (sno); unknown class (?).
4For each PTM, a value of abundance versus proxy (AvP) was calculated from the respective signal intensity as percentage of the sum of the intensities of the four canonic ribonucleotides (see Materials and Methods). This figure of merit represents a relative measure of the abundance of each PTM in the sample, which was introduced and validated in reference 34. Each reported value was the average of five replicate analyses.
5Red color marks newly expressed PTMs absent in the WT sample; blue marks PTMs with expression levels that did not deviate significantly from those observed in the WT control (i.e., p > 0.05); darker/lighter blue indicates PTMs with levels that deviated significantly from those of WT (i.e., p < 0.05): darker blue indicates over-expression, lighter blue under-expression (see Materials and Methods).
*Modifications previously unreported for this microorganism.
The quantitative determination of PTMs has traditionally suffered from the dearth of suitable standards for the >100 known ribonucleotide variants. We have shown that purified, exogenous tRNA samples could be effectively used as controlled sources of PTM standards in a modified version of the standard-additions method (34). According to this strategy, accurately known amounts of exogenous tRNA were added to the total RNA extract, so that subsequent exonuclease treatment could release directly in situ the desired PTM standards present in its molecule. An alternative strategy was proposed for applications aimed at determining mutual relative variations of expression levels, rather than absolute PTM concentrations. According to this, the entire complement of canonical bases contained in the cell, which is under genetic rather than metabolic control, was employed as a proxy internal standard to express the relative abundances of detected PTMs (see Materials and Methods) (34). The abundances versus proxy (AvPs) produced by this treatment were compared with corresponding values calculated from absolute concentrations obtained by the standard-addition method. The excellent match between these values provided the necessary validation for this quantification strategy (34). The IMS-MS data depicted in Fig. 1A were processed according to this treatment to assess the relative expression levels of all PTMs in the sample (Table IA), regardless of the availability of individual standards (see Materials and Methods).
Effects of Heat Shock and Osmostress on PTM Expression
The experimental strategies summarized above were employed to obtain the global profiles of samples that had been subjected to different types of stresses. For example, the heat map in Fig. 1B was obtained from a sample of wildtype S. cerevisiae BY4741 that was grown in YPD medium at 37 °C (WT37, see Materials and Methods), under conditions known to induce a typical heat shock response (53). Visual comparison between these data and those provided by WT control (Fig. 1A) revealed remarkable differences, which were confirmed by completing the identification of the PTMs in the sample (Table IB). The baseline represented by the profile of WT control consisted of a total of 41 distinct PTMs (Table IA). In contrast, the WT37 sample displayed 50 PTMs, out of which 32 were present also in WT control and the remaining 18 were newly expressed PTMs unique for this type of sample (marked in red in Table IB). The observed increase of PTM content was consistent with previously published reports that heat shock activation caused broad overexpression of RNA components within the cell (54, 55). Among the 32 PTMs in common between the two types of samples, four were detected with comparable relative abundances in both, whereas 14 and 14 were, respectively, under- and over-expressed in WT37 (marked respectively with darker and lighter shades of blue in Table IB). It must be emphasized that at least five biological replicates were analyzed for each type of sample to assess the uncertainty intrinsic in the quantitative determination (see Materials and Methods). Only PTMs with relative abundances that deviated from those of the WT control with a p value < 0.05 were deemed significant and marked as being under-/overexpressed. Smaller deviations with p > 0.05 matched the typical biological reproducibility obtained from yeast samples submitted to this type of analysis and, thus, were considered as normal experimental fluctuations (see Materials and Methods).
In analogous fashion, S. cerevisiae strain BY4741 was grown in YPD medium at 30 °C and then exposed for 15 min. to an environment containing 0.4 m NaCl (WTS, see Materials and Methods), which induces a characteristic osmostress response (15). Also in this case, the respective heat map (not shown) provided an outcome that was significantly different from that of WT control and, remarkably, from that of the WT37 sample, as well. The PTM profile revealed by completing positive identification (Table IC) showed that WTS contained a total of 38 PTMs, with eight newly expressed (red) and 30 in common with WT control (blue), out of which 7 and 22 were, respectively, under- and overexpressed (shades of blue). In addition, seven of the eight newly expressed PTMs (absent in WT control) were also present in WT37, whereas the remaining one was unique for this sample.
These experiments clearly indicated that the cellular responses to these different types of stresses involved profound changes in the production of specific RNA PTMs. The changes were not limited to variations of the expression levels of common PTMs, but comprised also the activation of new pathways that were previously dormant in the absence of stressors. According to the information included in the RNA Modification (51) and MODOMICS (52) databases, 11 of the 18 new PTMs activated by heat shock and three of eight associated with osmostress have been previously described in eukaryotic, but not necessarily yeast tRNA. Representative tandem MS data obtained for this set of PTMs is included in the Supporting Material section to corroborate their detection in this sample. In this regard, it is important to note that the information available on the distribution of PTMs in different organisms and classes of RNAs is still rather fragmentary. In most cases, the provenance of a certain PTM cited only the initial study that reported its first detection/characterization, rather than the results of comprehensive surveys. The vast majority of studies have traditionally focused on tRNA and rRNA, not only because of their abundant PTM content, but also for the availability of convenient isolation protocols. Further, it is not clear whether any distribution information present in the common databases was obtained from samples harvested under stress conditions. Therefore, the provenance information included in Table I should be considered with discretion. These considerations aside, it was very significant that none of the new PTMs detected under stress corresponded to those implicated in the mechanism of oxidative stress response involving tRNA-based translational recoding (32, 33). This observation suggested that a sizeable portion of the newly activated pathways were likely to rely on very different mechanisms.
A closer examination of the new PTMs expressed in WTS revealed that seven were in common with the WT37 sample, but 1 and 11 were unique for either the former or the latter, respectively, thus pointing to the existence of distinct response pathways involving PTM biogenesis. It is well established that thermal stress activates a response based on the prominent expression of heat shock proteins (HSP), which exert their protective effects by limiting protein denaturation (30, 56). However, it has been shown that the HOG pathway can be also activated at higher temperatures (57), thus raising the possibility that the respective signaling pathways may be closely intertwined. If proven correct, this hypothesis would provide an excellent explanation for the seven common PTMs that were induced by both heat shock and osmostress in our experiments.
In addition to the induction of new PTMs absent in WT control, stress conditions affected the expression levels of existing PTMs in different ways. Indeed, the relative abundance of 14 and 22 existing PTMs were significantly increased in the WT37 and WTS samples, respectively, over the WT control (i.e. displayed p < 0.05). In contrast, 14 and 7 existing PTMs were significantly decreased in the same samples, whereas four and one ceased to be detectable altogether under the standard analytical conditions. Also in this case, the various PTMs could be readily categorized in distinctive groups that were either stress-specific or not. Of the 20 down-regulated modifications in WT37, 14 displayed the same behavior in WTs. At the same time, of the 32 species up-regulated/unique in WT37, 20 displayed the same behavior in WTs. In some cases, however, the variation directions did not match in both samples, as shown for t6A that was up-regulated under osmostress as compared with the control, but disappeared under heat shock, or the methyl-A isomers that had the exact opposite fate (Table I). The disappearance of specific PTMs under stress conditions was particularly intriguing and suggested the possibility that they may not be essential to the cellular response and that their functions may be effectively taken over by other stress-specific PTMs. The picture emerging from these initial experiments clearly ruled out the notion that PTM biogenesis might be controlled by a single regulatory pathway, but suggested instead the presence of multiple individual controls.
Identification of HOG-Dependent Expression Pathways
To unambiguously identify the stress-induced PTMs that were under HOG control, we analyzed a hog1Δ strain, which lacks the stress-activated protein kinase Hog1, the master regulator of gene expression reprogramming in response to osmostress. The hog1Δ mutant was first grown at 30 °C to identify its baseline profile in the absence of stress, which comprised the induction of four new PTMs absent in WT control (Table IE). The mutant strain was subsequently grown at 37 °C (i.e. hog1Δ37) and treated with 0.4 m NaCl at both 30 °C (hog1ΔS) and 37 °C (i.e. hog1Δ37,S). The samples displayed complex profiles with up/down variations of the majority of the PTMs observed in WT under corresponding environmental conditions, as well as production of distinctive sets of new ones absent in WT (marked respectively with different shades of blue, or solid red in Table IF–IH).
The newly activated PTMs observed exclusively under stress conditions were examined according to a process of elimination to identify their putative regulatory relationships (summarized in Table II). In particular, the mutation-induced elimination of any of the newly expressed PTMs (i.e. absent in WT control) was interpreted as evidence of HOG control. The reasoning behind the elimination process could be illustrated here for the newly expressed ho5U modification. This species was absent in WT control, but present in both WT37, WTS, as well as the double-stressed WT37,S sample (see Materials and Methods), thus cementing its status as a stress-induced PTM. At the same time, this species was prominently absent in all of the hog1Δ samples regardless of conditions, which indicated beyond doubt that its expression was linked to the HOG pathway. In contrast, the i6A and ncm5Um modifications observed in both WT37 and WTS were not eliminated by the mutation, thus suggesting that their stress-induced biogenesis was independent from the HOG pathway.
Table II. Summary of new PTMs expressed in WT, or the ssb1Δ, or the rit1Δ mutant under either control or stress conditions. This table includes only the PTMs marked in red in both Table I and 1S (complete data for the additional mutant strains are provided in Supporting Material).
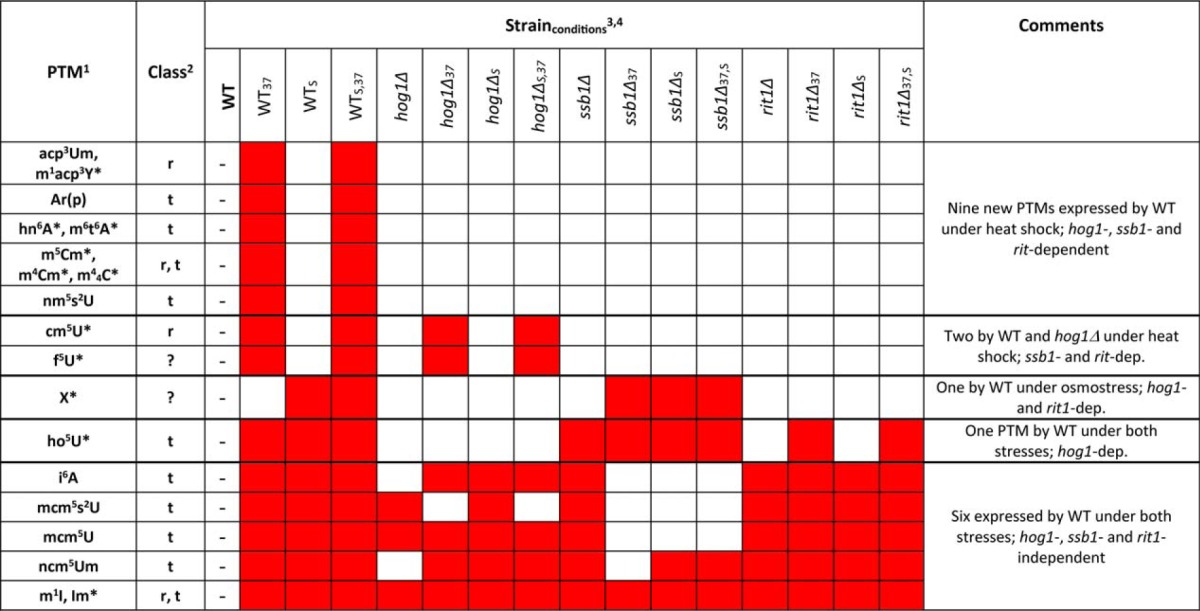
1Full names available at http://mods.rna.albany.edu/.
2Putative classes of RNAs include: ribosomal RNA (r); transfer RNA (t); unknown class (?).
3WT, hog1Δ, ssb1Δ, and rit1Δ strains were grown at 30 °C under normal conditions (no subscript); 37 °C (37 subscript); 30 °C after treatment with 0.4 m NaCl (S subscript); and 37 °C after treatment with 0.4 m NaCl (S,37 subscript) (see Materials and Methods).
4Red color marks newly expressed PTMs absent in the WT sample.
*Modifications previously unreported for this microorganism.
It is interesting to note that although the production of these PTMs was triggered by both heat shock and osmostress, others displayed prominent specificity for either type of stress. For example, X was detected only in the WTS sample (and, consistent with this finding, in the double-stressed WT37,S) to earn the status of osmostress-induced and hog1-dependent. Its reproducibility and abundance in the analyzed samples dissipated any doubt about its significance. At the same time, 10 putative PTMs were found to be heat shock-induced and hog1-dependent, but only one was heat shock-induced and hog1-independent (Table II). Finally, f5U was observed only when the hog1Δ mutant was subjected to higher temperature, thus suggesting the possible activation of an alternative mechanism of heat response, which may compensate for the elimination of the Hog1 kinase.
A Strategy for Integrating PTM Biogenesis within the Stress-Response Regulatory Network
The results provided by these experiments clearly showed that the effects of heat and osmotic stress on PTM biogenesis were not mediated by a single regulatory pathway, but resulted instead from the coordinated activities of a more complex regulatory network. In S. cerevisiae (budding yeast), extensive investigation of gene expression under stress has led to the identification of genes that are consistently up- or down-regulated in response to specific stimuli (58). These genes have been defined as specific environmental stress response genes (SESR, Scheme 1) (17). In S. pombe (fission yeast), instead, common sets of genes defined as core environmental stress response genes (CESR) are involved in nearly all types of stresses (17). In this case, a central hub integrates the stimuli provided by various stressors and coordinates a general cellular response. The detection of PTMs that were activated by both heat and osmotic stress suggests that a similar organization may be present in the stress-induced PTM biogenesis observed in S. cerevisiae.
Scheme 1.

Regulation of stress genes in fission and budding yeast. In the former, different stresses share a common core of environmental stress response genes (CESR), whereas stress-specific environmental response genes (SESR) predominate in the latter (17, 58).
To test this possibility, we devised a strategy that used gene deletion strains to retrace putative regulatory pathways. This strategy required the prerequisite formulation of valid hypotheses on the network's composition and architecture to guide the selection of the genes to be eliminated. For example, Scheme 2A depicts the organization of genes involved in the typical cellular response to heat shock and osmostress in S. cerevisiae, as deduced from a wealth of available information (20, 42, 59–63). In contrast, Scheme 2B was drawn by using the Cytoscape server to examine databases of genetic and protein–protein interactions, as well as transcriptional and post-transcriptional regulation networks (64–66). This specific subsection of the extensive stress-response interactome delineates a putative network connecting essential components of the established stress-response pathways, such as HOG and various heat shock genes, to the biogenetic enzymes responsible for the formation of target PTMs, which are listed in the MODOMICS database (52). It is interesting to note that, although the organization of the established response genes (Scheme 2A) fully conformed to the prevailing view of parallel, largely independent pathways for different stimuli, the downstream region covering the putative regulation of PTM expression (Scheme 2B and 2C) assumed a much more complex architecture characterized by numerous crossovers. The interactomic map clearly suggested that genes such as HOG1 and FUS3 could provide high-level integration between the heat shock and osmostress signaling pathways, whereas SSA1, SSB1, SSB2, SSE1, and HSP82 could provide additional low-level integration and fine tuning of PTM production. This set of genes codes for proteins with broad chaperone activities, which are known to prevent aggregation, promote folding of proteins to their native states, and solubilize and refold aggregated proteins (55, 67). Often, these heat shock chaperones work closely with cochaperones that are involved in signal transduction, cell cycle regulation, cellular differentiation, and cell death. Under stress, eukaryotic systems rely heavily upon Hsp70 chaperones such as Hsp82 to stabilize death-inducing mutations, such as those propagated by oncogenes (55, 67).
Scheme 2.

A, Established relationships between genes involved in response to hyperosmotic stress and heat shock. B, Putative interactomic network connecting established stress-response genes with PTM biogenetic enzymes. C, Known biogenetic enzymes (red boxes) for selected PTMs of interest (blue). Arrows indicate proven functional relationships. Vertical lines indicate possible functional links. Horizontal lines indicate possible co-expression. Light blue arrows and boxes identify the HOG1 → SSB1 → RIT1 pathway corroborated by gene deletion.
Based on this map, we have initiated the systematic investigation of selected gene deletion strains to substantiate the putative signaling pathways responsible for PTM regulation. The PTMs of most interest were the 11 induced in either heat shock or osmostress, which were found to be hog1-dependent (Table II). The results obtained from the ssb1Δ mutant showed that 11 of the 19 PTMs found uniquely in stressed states were ssb1-dependent, indicating that this pathway may indeed be acting as an integration hub responsible for the downstream initiation of multiple enzymatic processes involved in PTM biogenesis. The fact that the majority of these PTMs are controlled by genes located downstream in these established stress-response pathways appears to rule out their possible participation in sensing mechanisms, which are typically located upstream. Additionally, the two PTMs that appeared in WT, but not in any specific stress states, were also found to be ssb1-dependent (Table II). Further, a total of eight PTMs were found to be expressed even in the absence of SSB1 indicating that SSB1 cannot be the only hub responsible for signaling PTM biogenesis.
The next step in retracing the proposed map consisted of analyzing strains in which the specific biogenetic enzymes were deleted. The case of the RIT1 gene (Scheme 2C), which appears to be connected directly to SSB1 (Scheme 2B), could serve here to exemplify possible outcomes. The Rit1 enzyme is known to catalyze the formation of Ar(p) by the addition of a 2′-O-ribosyl phosphate group to adenine (52). A typical substrate is represented by adenine 64 of the initiator tRNAMet(i), which prevents its use during the elongation step of protein synthesis in yeast (68, 69). Our data indicated that this PTM was uniquely expressed in the WT strain during heat shock and was both hog1- and ssb1-dependent. When the rit1Δ mutant was examined (see for example the heat map obtained from rit1Δ under normal growth conditions, Fig. 1C), no Ar(p) could be detected with or without stress, thus confirming that RIT1 is indeed essential for the production of this PTM. Further, in the context offered by the mutants in the study, this outcome corroborated the putative HOG1 → SSB1 → RIT1 pathway as the signaling control for Ar(p) (marked in light blue in Scheme 2B and 2C). Surprisingly, close examination of rit1Δ's global profile revealed the absence of nine PTMs that were both hog1- and ssb1-dependent (Table II), which potentially places them under the same HOG1 → SSB1 → RIT1 regulatory pathway. In addition, three other PTMs that were not hog1- or ssb1-dependent were found to be rit1-dependent. These observations suggest that RIT1 may itself act as an additional hub in the control network. The fact that the majority of rit1-dependent PTMs do not involve adenine modification rules out the possibility that Ar(p) itself might serve as their direct biosynthetic precursor. An alternative hypothesis could be that activation of RIT1 may result in the co-expression of other biogenetic enzymes yet to be identified. In this direction, it must be noted that, of the 12 stress-induced PTMs that are rit1-dependent, Ar(p) is the only one with a known biogenetic enzyme. Considering the large number of genes without assigned function in the yeast genome, the functional link with RIT1 activation may provide the basis for further studies aimed at the identification of the missing biogenetic enzymes.
CONCLUSIONS
Monitoring the epitranscriptomic profile of S. cerevisiae as a function of different experimental variables has unambiguously shown that PTM biogenesis is profoundly influenced by environmental conditions. The fact that the production of numerous new PTMs was readily activated by increasing temperature or salt concentration provides very strong evidence for the broad implication of PTMs in stress response. This finding is consistent with the role of selected tRNA modifications that are known to participate in translational recoding triggered by oxidative stress (32, 33). However, the majority of the activated modifications observed in our study are not known to engage in these types of mechanisms. The direct comparison of PTM profiles has clearly revealed the presence of stress-specific modifications, as well as nonspecific ones, which could be part of a more general cellular response. These observations support the presence of alternative mechanisms involving PTM activity, which are likely to include the broad participation of diverse classes of RNAs.
With the goal of investigating the relationships between established stress-response signaling and PTM activation, we devised a strategy that involves evaluating the simultaneous effects of gene deletion on the expression of all PTMs in the cell. This system-biology approach was inspired by the wealth of genomic and functional data available for S. cerevisiae. In what could be described as an interactome-walk, genes connecting the putative biogenetic enzymes with known response genes were systematically eliminated to retrace a putative regulatory network inferred from available information. Preliminary results have allowed us to clearly differentiate PTMs that fall under HOG control from those that do not. The HOG pathway consists of a cascade of MAP kinases, which is preeminently responsible for the response to osmostress, but has also tenuous communication with parallel heat shock controls (20, 42, 59–63). Our results support the presence of numerous integration hubs between these stress-specific pathways, which coordinate the expression of selected PTMs. This type of regulatory architecture could help explain cross-tolerance effects, in which preconditioning to a specific type of stress can increase the tolerance to a different one (70). These observations should be considered also in the context of the effects of HOG1 on chromatin remodeling (71, 72) and activation of DNA-binding transcriptional activators (73–77). The facts that HOG1 increases the stability of a well-defined group of osmostress mRNAs (12, 13) and induces specific lncRNAs (15) under osmostress leave ample space for the possible existence of feedback mechanisms based on PTM activity. In this direction, we could speculate that chromatin remodeling by stress-induced lncRNAs may affect the expression of genes involved in the general cellular response, as well as PTM regulatory pathways. In turn, the latter could integrate signals from other (likely protein-based) pathways and modify lncRNAs to reduced/enhance their chromatin remodeling activity. Therefore, determining the distribution of PTMs in these classes of RNAs and monitoring their levels under stress will provide the basis for exploring these possible mechanisms.
After establishing a direct link between stress and selected PTMs, the next challenge will be the identification of the actual roles played by such PTMs in cellular response. This important task is severely hampered by the fragmentary knowledge of their distribution outside tRNA and rRNA, and the absence of annotation on the extensive genomic/transcriptomic data available to the public. Toward this goal, we are currently developing technologies capable of determining the class of RNA containing a specific PTM, the identity of the parent species, and the sequence position of the modification. This information will help interrogate the available transcriptomic data, which will lead to testable hypotheses by suggesting possible correlations with known functions associated with the parent RNA. This information will also guide the implementation of strategies based on the mutation of nucleotides susceptible to modification, or silencing of the RNA bearing the modification, aimed at testing their effects on the metabolic and epigenetic state of the phenotype. The results will provide valuable insights into the functions of PTMs in stress response and, more broadly, will be expected to drive a re-evaluation of their overall biological significance.
Supplementary Material
Footnotes
Author contributions: R.E.R., M.J.C., and D.F. designed research; R.E.R. and M.A.P. performed research; R.E.R. and D.F. analyzed data; R.E.R. and D.F. wrote the paper; M.J.C. provided mutant strains.
* This work was supported by The RNA Institute of the University at Albany and by the National Institutes of Health (GM064328–14). The content is solely the responsibility of the authors and does not necessarily represent the official views of the National Institutes of Health.
 This article contains supplemental Figs. S1 to S7 and Table S1
1 The abbreviations used are:
- MAPK
- mitogen-activated protein kinase
- PTM
- post-transcriptional modification
- ESI
- electrospray ionization
- IMS-MS
- ion mobility spectrometry-MS
- HOG
- hyperosmolarity glycerol
- TAP
- time aligned parallel
- RIC
- reconstructed ion chromatogram
- MaSTeR
- mass selected time resolved
- AvP
- abundance versus proxy.
REFERENCES
- 1. Mager W. H., and De Kruijff A. J. (1995) Stress-induced transcriptional activation. Microbiol. Rev. 59, 506–531 [DOI] [PMC free article] [PubMed] [Google Scholar]
- 2. Ruis H., and Schüller C. (1995) Stress signaling in yeast. BioEssays News Rev. Mol. Cell. Dev. Biol. 17, 959–965 [DOI] [PubMed] [Google Scholar]
- 3. De Nadal E., Ammerer G., and Posas F. (2011) Controlling gene expression in response to stress. Nat. Rev. Genet. 12, 833–845 [DOI] [PubMed] [Google Scholar]
- 4. Costa F. F. (2007) Noncoding RNAs: lost in translation? Gene 386, 1–10 [DOI] [PubMed] [Google Scholar]
- 5. Morris K. V., and Mattick J. S. (2014) The rise of regulatory RNA. Nat. Rev. Genet. 15, 423–437 [DOI] [PMC free article] [PubMed] [Google Scholar]
- 6. Feder M. E., and Hofmann G. E. (1999) Heat-shock proteins, molecular chaperones, and the stress response: evolutionary and ecological physiology. Annu. Rev. Physiol. 61, 243–282 [DOI] [PubMed] [Google Scholar]
- 7. Verghese J., Abrams J., Wang Y., and Morano K. A. (2012) Biology of the heat shock response and protein chaperones: budding yeast (Saccharomyces cerevisiae) as a model system. Microbiol. Mol. Biol. Rev. 76, 115–158 [DOI] [PMC free article] [PubMed] [Google Scholar]
- 8. O'Rourke S. M., Herskowitz I., and O'Shea E. K. (2002) Yeast go the whole HOG for the hyperosmotic response. Trends Genet. 18, 405–412 [DOI] [PubMed] [Google Scholar]
- 9. Hohmann S., Krantz M., and Nordlander B. (2007) Yeast osmoregulation. Methods Enzymol. 428, 29–45 [DOI] [PubMed] [Google Scholar]
- 10. Brewster J. L., de Valoir T., Dwyer N. D., Winter E., and Gustin M. C. (1993) An osmosensing signal transduction pathway in yeast. Science 259, 1760–1763 [DOI] [PubMed] [Google Scholar]
- 11. Clotet J., and Posas F. (2007) Control of cell cycle in response to osmostress: lessons from yeast. Methods Enzymol. 428, 63–76 [DOI] [PubMed] [Google Scholar]
- 12. Romero-Santacreu L., Moreno J., Pérez-Ortín J. E., and Alepuz P. (2009) Specific and global regulation of mRNA stability during osmotic stress in Saccharomyces cerevisiae. RNA 15, 1110–1120 [DOI] [PMC free article] [PubMed] [Google Scholar]
- 13. Molin C., Jauhiainen A., Warringer J., Nerman O., and Sunnerhagen P. (2009) mRNA stability changes precede changes in steady-state mRNA amounts during hyperosmotic stress. RNA 15, 600–614 [DOI] [PMC free article] [PubMed] [Google Scholar]
- 14. Rep M., Krantz M., Thevelein J. M., and Hohmann S. (2000) The Transcriptional Response of Saccharomyces cerevisiae to Osmotic Shock Hot1p AND Msn2p/Msn4p are required for the induction of subsets of high osmolarity glycerol pathway-dependent genes. J. Biol. Chem. 275, 8290–8300 [DOI] [PubMed] [Google Scholar]
- 15. Nadal-Ribelles M., Solé C., Xu Z., Steinmetz L. M., de Nadal E., and Posas F. (2014) Control of Cdc28 CDK1 by a stress-induced lncRNA. Mol. Cell 53, 549–561 [DOI] [PMC free article] [PubMed] [Google Scholar]
- 16. Posas F., Chambers J. R., Heyman J. A., Hoeffler J. P., de Nadal E., and Ariño J. (2000) The transcriptional response of yeast to saline stress. J. Biol. Chem. 275, 17249–17255 [DOI] [PubMed] [Google Scholar]
- 17. Gasch A. P., Spellman P. T., Kao C. M., Carmel-Harel O., Eisen M. B., Storz G., Botstein D., and Brown P. O. (2000) Genomic expression programs in the response of yeast cells to environmental changes. Mol. Biol. Cell 11, 4241–4257 [DOI] [PMC free article] [PubMed] [Google Scholar]
- 18. Causton H. C., Ren B., Koh S. S., Harbison C. T., Kanin E., Jennings E. G., Lee T. I., True H. L., Lander E. S., and Young R. A. (2001) Remodeling of yeast genome expression in response to environmental changes. Mol. Biol. Cell 12, 323–337 [DOI] [PMC free article] [PubMed] [Google Scholar]
- 19. Capaldi A. P., Kaplan T., Liu Y., Habib N., Regev A., Friedman N., and O'Shea E. K. (2008) Structure and function of a transcriptional network activated by the MAPK Hog1. Nat. Genet. 40, 1300–1306 [DOI] [PMC free article] [PubMed] [Google Scholar]
- 20. Vanacloig-Pedros E., Bets-Plasencia C., Pascual-Ahuir A., and Proft M. (2015) Coordinated gene regulation in the initial phase of salt stress adaptation. J. Biol. Chem. 290, 10163–10175 [DOI] [PMC free article] [PubMed] [Google Scholar]
- 21. Karapetyan A. R., Buiting C., Kuiper R. A., and Coolen M. W. (2013) Regulatory roles for long ncRNA and mRNA. Cancers 5, 462–490 [DOI] [PMC free article] [PubMed] [Google Scholar]
- 22. Kanduri C. (2016) Long noncoding RNAs: Lessons from genomic imprinting. Biochim. Biophys. Acta 1859, 102–111 [DOI] [PubMed] [Google Scholar]
- 23. Liu N., and Pan T. (2015) RNA epigenetics. Transl. Res. J. Lab. Clin. Med. 165, 28–35 [DOI] [PMC free article] [PubMed] [Google Scholar]
- 24. Namy O., Lecointe F., Grosjean H., and Rousset J.-P. (2005) in Fine-Tuning of RNA Functions by Modification and Editing, Topics in Current Genetics, ed Grosjean H., Springer, Berlin Heidelberg, pp 309–340 [Google Scholar]
- 25. Limbach P. A., Crain P. F., and McCloskey J. A. (1994) Summary: the modified nucleosides of RNA. Nucleic Acids Res. 22, 2183–2196 [DOI] [PMC free article] [PubMed] [Google Scholar]
- 26. Cantara W. A., Crain P. F., Rozenski J., McCloskey J. A., Harris K. A., Zhang X., Vendeix F. A. P., Fabris D., and Agris P. F. (2011) The RNA modification database: 2011 update. Nucleic Acids Res. 39, D195–D201 [DOI] [PMC free article] [PubMed] [Google Scholar]
- 27. Dunin-Horkawicz S., Czerwoniec A., Gajda M. J., Feder M., Grosjean H., and Bujnicki J. M. (2006) MODOMICS: a database of RNA modification pathways. Nucleic Acids Res. 34, D145–149 [DOI] [PMC free article] [PubMed] [Google Scholar]
- 28. Machnicka M. A., Milanowska K., Osman Oglou O., Purta E., Kurkowska M., Olchowik A., Januszewski W., Kalinowski S., Dunin-Horkawicz S., Rother K. M., Helm M., Bujnicki J. M., and Grosjean H. (2012) MODOMICS: a database of RNA modification pathways – 2013 update. Nucleic Acids Res. 41, D262–D267 [DOI] [PMC free article] [PubMed] [Google Scholar]
- 29. Kowalak J. A., Dalluge J. J., McCloskey J. A., and Stetter K. O. (1994) The role of post-transcriptional modification in stabilization of transfer RNA from hyperthermophiles. Biochemistry 33, 7869–7876 [DOI] [PubMed] [Google Scholar]
- 30. Helm M. (2006) Post-transcriptional nucleotide modification and alternative folding of RNA. Nucleic Acids Res. 34, 721–733 [DOI] [PMC free article] [PubMed] [Google Scholar]
- 31. Giegé R., Sissler M., and Florentz C. (1998) Universal rules and idiosyncratic features in tRNA identity. Nucleic Acids Res. 26, 5017–5035 [DOI] [PMC free article] [PubMed] [Google Scholar]
- 32. Chan C. T. Y., Dyavaiah M., DeMott M. S., Taghizadeh K., Dedon P. C., and Begley T. J. (2010) A quantitative systems approach reveals dynamic control of tRNA modifications during cellular stress. PLoS Genet. 6, e1001247. [DOI] [PMC free article] [PubMed] [Google Scholar]
- 33. Chan C. T. Y., Pang Y. L. J., Deng W., Babu I. R., Dyavaiah M., Begley T. J., and Dedon P. C. (2012) Reprogramming of tRNA modifications controls the oxidative stress response by codon-biased translation of proteins. Nat. Commun. 3, 937. [DOI] [PMC free article] [PubMed] [Google Scholar]
- 34. Rose R. E., Quinn R., Sayre J. L., and Fabris D. (2015) Profiling ribonucleotide modifications at full-transcriptome level by electrospray ionization mass spectrometry. RNA 21, 1361–1374 [DOI] [PMC free article] [PubMed] [Google Scholar]
- 35. Yamashita M., and Fenn J. B. (1984) Electrospray ion source. Another variation on the free-jet theme. J. Phys. Chem. 88, 4671–4675 [Google Scholar]
- 36. Solouki T., Pasa-Tolic L., Jackson G. S., Guan S., and Marshall A. G. (1996) High-resolution multistage MS, MS2, and MS3 matrix-assisted laser desorption/ionization FT-ICR mass spectra of peptides from a single laser shot. Anal. Chem. 68, 3718–3725 [DOI] [PubMed] [Google Scholar]
- 37. Collings B. A., Campbell J. M., Mao D., and Douglas D. J. (2001) A combined linear ion trap time-of-flight system with improved performance and MSn capabilities. Rapid Commun. Mass Spectrom. 15, 1777–1795 [DOI] [PubMed] [Google Scholar]
- 38. Hill H. H., Siems W. F., and St. Louis R. H. (1990) Ion mobility spectrometry. Anal. Chem. 62, 1201A–1209A [DOI] [PubMed] [Google Scholar]
- 39. Clemmer D. E., and Jarrold M. F. (1997) Ion mobility measurements and their applications to clusters and biomolecules. J. Mass Spectrom. 32, 577–592 [Google Scholar]
- 40. Verbeck G., Ruotolo B., Sawyer H., Gillig K., and Russell D. (2002) A fundamental introduction to ion mobility mass spectrometry applied to the analysis of biomolecules. J. Biomol. Tech. 13, 56–61 [PMC free article] [PubMed] [Google Scholar]
- 41. Quinn R., Basanta-Sanchez M., Rose R. E., and Fabris D. (2013) Direct infusion analysis of nucleotide mixtures of very similar or identical elemental composition. J. Mass Spectrom. 48, 703–712 [DOI] [PMC free article] [PubMed] [Google Scholar]
- 42. Saito H., and Posas F. (2012) Response to hyperosmotic stress. Genetics 192, 289–318 [DOI] [PMC free article] [PubMed] [Google Scholar]
- 43. Nadal-Ribelles M., Conde N., Flores O., González-Vallinas J., Eyras E., Orozco M., de Nadal E., and Posas F. (2012) Hog1 bypasses stress-mediated down-regulation of transcription by RNA polymerase II redistribution and chromatin remodeling. Genome Biol. 13, R106. [DOI] [PMC free article] [PubMed] [Google Scholar]
- 44. Winzeler E. A., Shoemaker D. D., Astromoff A., Liang H., Anderson K., Andre B., Bangham R., Benito R., Boeke J. D., Bussey H., Chu A. M., Connelly C., Davis K., Dietrich F., Dow S. W., El Bakkoury M., Foury F., Friend S. H., Gentalen E., Giaever G., Hegemann J. H., Jones T., Laub M., Liao H., Liebundguth N., Lockhart D. J., Lucau-Danila A., Lussier M., M'Rabet N., Menard P., Mittmann M., Pai C., Rebischung C., Revuelta J. L., Riles L., Roberts C. J., Ross-MacDonald P., Scherens B., Snyder M., Sookhai-Mahadeo S., Storms R. K., Véronneau S., Voet M., Volckaert G., Ward T. R., Wysocki R., Yen G. S., Yu K., Zimmermann K., Philippsen P., Johnston M., and Davis R. W. (1999) Functional characterization of the S. cerevisiae genome by gene deletion and parallel analysis. Science 285, 901–906 [DOI] [PubMed] [Google Scholar]
- 45. Giaever G., Chu A. M., Ni L., Connelly C., Riles L., Véronneau S., Dow S., Lucau-Danila A., Anderson K., André B., Arkin A. P., Astromoff A., El-Bakkoury M., Bangham R., Benito R., Brachat S., Campanaro S., Curtiss M., Davis K., Deutschbauer A., Entian K.-D., Flaherty P., Foury F., Garfinkel D. J., Gerstein M., Gotte D., Güldener U., Hegemann J. H., Hempel S., Herman Z., Jaramillo D. F., Kelly D. E., Kelly S. L., Kötter P., LaBonte D., Lamb D. C., Lan N., Liang H., Liao H., Liu L., Luo C., Lussier M., Mao R., Menard P., Ooi S. L., Revuelta J. L., Roberts C. J., Rose M., Ross-Macdonald P., Scherens B., Schimmack G., Shafer B., Shoemaker D. D., Sookhai-Mahadeo S., Storms R. K., Strathern J. N., Valle G., Voet M., Volckaert G., Wang C., Ward T. R., Wilhelmy J., Winzeler E. A., Yang Y., Yen G., Youngman E., Yu K., Bussey H., Boeke J. D., Snyder M., Philippsen P., Davis R. W., and Johnston M. (2002) Functional profiling of the Saccharomyces cerevisiae genome. Nature 418, 387–391 [DOI] [PubMed] [Google Scholar]
- 46. Crain P. F. (1990) Preparation and enzymatic hydrolysis of DNA and RNA for mass spectrometry. Methods Enzym. 193, 782–790 [DOI] [PubMed] [Google Scholar]
- 47. Fabris D., Turner K. B., and Hagan N. A. (2010) in Mass Spectrometry of Nucleosides and Nucleic Acids, Banoub J. and Limbach P. eds., CRC Press, Taylor and Francis Group, LLC, London, U.K., pp 303–327 [Google Scholar]
- 48. McLafferty F. W. (1981) Tandem mass spectrometry. Science 214, 280–287 [DOI] [PubMed] [Google Scholar]
- 49. Tomer K. B., Guenat C. R., and Deterding L. J. (1988) Consecutive reaction monitoring in a four-sector mass spectrometer: MS4 and one step beyond. Anal. Chem. 60, 2232–2236 [DOI] [PubMed] [Google Scholar]
- 50. Chambers M. C., Maclean B., Burke R., Amodei D., Ruderman D. L., Neumann S., Gatto L., Fischer B., Pratt B., Egertson J., Hoff K., Kessner D., Tasman N., Shulman N., Frewen B., Baker T. A., Brusniak M.-Y., Paulse C., Creasy D., Flashner L., Kani K., Moulding C., Seymour S. L., Nuwaysir L. M., Lefebvre B., Kuhlmann F., Roark J., Rainer P., Detlev S., Hemenway T., Huhmer A., Langridge J., Connolly B., Chadick T., Holly K., Eckels J., Deutsch E. W., Moritz R. L., Katz J. E., Agus D. B., MacCoss M., Tabb D. L., and Mallick P. (2012) A cross-platform toolkit for mass spectrometry and proteomics. Nat. Biotechnol. 30, 918–920 [DOI] [PMC free article] [PubMed] [Google Scholar]
- 51. http://mods.rna.albany.edu/
- 52. http://modomics.genesilico.pl/
- 53. Morano K. A., Grant C. M., and Moye-Rowley W. S. (2012) The response to heat shock and oxidative stress in Saccharomyces cerevisiae. Genetics 190, 1157–1195 [DOI] [PMC free article] [PubMed] [Google Scholar]
- 54. Lindquist S., and Craig E. A. (1988) The heat-shock proteins. Annu. Rev. Genet. 22, 631–677 [DOI] [PubMed] [Google Scholar]
- 55. Borkovich K. A., Farrelly F. W., Finkelstein D. B., Taulien J., and Lindquist S. (1989) hsp82 is an essential protein that is required in higher concentrations for growth of cells at higher temperatures. Mol. Cell. Biol. 9, 3919–3930 [DOI] [PMC free article] [PubMed] [Google Scholar]
- 56. Atkinson B., C., and Walden D. B. (1985) Changes in Eukaryotic Gene Expression in Response to Environmental Stress, Academic Press, Inc., Orlando, FL, Fifth ed. [Google Scholar]
- 57. Kamada Y., Jung U. S., Piotrowski J., and Levin D. E. (1995) The protein kinase C-activated MAP kinase pathway of Saccharomyces cerevisiae mediates a novel aspect of the heat shock response. Genes Dev. 9, 1559–1571 [DOI] [PubMed] [Google Scholar]
- 58. Chen D., Toone W. M., Mata J., Lyne R., Burns G., Kivinen K., Brazma A., Jones N., and Bähler J. (2003) Global transcriptional responses of fission yeast to environmental stress. Mol. Biol. Cell 14, 214–229 [DOI] [PMC free article] [PubMed] [Google Scholar]
- 59. Winkler A., Arkind C., Mattison C. P., Burkholder A., Knoche K., and Ota I. (2002) Heat stress activates the yeast high-osmolarity glycerol mitogen-activated protein kinase pathway, and protein tyrosine phosphatases are essential under heat stress. Eukaryot. Cell 1, 163–173 [DOI] [PMC free article] [PubMed] [Google Scholar]
- 60. Fassler J. S., and West A. H. (2010) Genetic and biochemical analysis of the SLN1 pathway in Saccharomyces cerevisiae. Methods Enzymol. 471, 291–317 [DOI] [PMC free article] [PubMed] [Google Scholar]
- 61. You T., Ingram P., Jacobsen M. D., Cook E., McDonagh A., Thorne T., Lenardon M. D., Moura A. P. de, Romano M. C., Thiel M., Stumpf M., Gow N. A., Haynes K., Grebogi C., Stark J., and Brown A. J. (2012) A systems biology analysis of long and short-term memories of osmotic stress adaptation in fungi. BMC Res. Notes 5, 258. [DOI] [PMC free article] [PubMed] [Google Scholar]
- 62. Fassler J. S., and West A. H. (2013) Histidine phosphotransfer proteins in fungal two-component signal transduction pathways. Eukaryot. Cell 12, 1052–1060 [DOI] [PMC free article] [PubMed] [Google Scholar]
- 63. Sharifian H., Lampert F., Stojanovski K., Regot S., Vaga S., Buser R., Lee S. S., Koeppl H., Posas F., Pelet S., and Peter M. (2015) Parallel feedback loops control the basal activity of the HOG MAPK signaling cascade. Integr. Biol. 7, 412–422 [DOI] [PubMed] [Google Scholar]
- 64. Shannon P., Markiel A., Ozier O., Baliga N. S., Wang J. T., Ramage D., Amin N., Schwikowski B., and Ideker T. (2003) Cytoscape: a software environment for integrated models of biomolecular interaction networks. Genome Res. 13, 2498–2504 [DOI] [PMC free article] [PubMed] [Google Scholar]
- 65. Cline M. S., Smoot M., Cerami E., Kuchinsky A., Landys N., Workman C., Christmas R., Avila-Campilo I., Creech M., Gross B., Hanspers K., Isserlin R., Kelley R., Killcoyne S., Lotia S., Maere S., Morris J., Ono K., Pavlovic V., Pico A. R., Vailaya A., Wang P.-L., Adler A., Conklin B. R., Hood L., Kuiper M., Sander C., Schmulevich I., Schwikowski B., Warner G. J., Ideker T., and Bader G. D. (2007) Integration of biological networks and gene expression data using Cytoscape. Nat. Protoc. 2, 2366–2382 [DOI] [PMC free article] [PubMed] [Google Scholar]
- 66. Smoot M. E., Ono K., Ruscheinski J., Wang P.-L., and Ideker T. (2011) Cytoscape 2.8: new features for data integration and network visualization. Bioinformatics 27, 431–432 [DOI] [PMC free article] [PubMed] [Google Scholar]
- 67. Mayer M. P., and Bukau B. (2005) Hsp70 chaperones: cellular functions and molecular mechanism. Cell. Mol. Life Sci. 62, 670–684 [DOI] [PMC free article] [PubMed] [Google Scholar]
- 68. Aström S. U., and Byström A. S. (1994) Rit1, a tRNA backbone-modifying enzyme that mediates initiator and elongator tRNA discrimination. Cell 79, 535–546 [DOI] [PubMed] [Google Scholar]
- 69. Aström S. U., Nordlund M. E., Erickson F. L., Hannig E. M., and Byström A. S. (1999) Genetic interactions between a null allele of the RIT1 gene encoding an initiator tRNA-specific modification enzyme and genes encoding translation factors in Saccharomyces cerevisiae. Mol. Gen. Genet. 261, 967–976 [DOI] [PubMed] [Google Scholar]
- 70. Kültz D. (2005) Molecular and evolutionary basis of the cellular stress response. Annu. Rev. Physiol. 67, 225–257 [DOI] [PubMed] [Google Scholar]
- 71. Klopf E., Paskova L., Solé C., Mas G., Petryshyn A., Posas F., Wintersberger U., Ammerer G., and Schüller C. (2009) Cooperation between the INO80 complex and histone chaperones determines adaptation of stress gene transcription in the yeast Saccharomyces cerevisiae. Mol. Cell. Biol. 29, 4994–5007 [DOI] [PMC free article] [PubMed] [Google Scholar]
- 72. Mas G., de Nadal E., Dechant R., Rodríguez de la Concepción M. L., Logie C., Jimeno-González S., Chávez S., Ammerer G., and Posas F. (2009) Recruitment of a chromatin remodeling complex by the Hog1 MAP kinase to stress genes. EMBO J. 28, 326–336 [DOI] [PMC free article] [PubMed] [Google Scholar]
- 73. Cook J. G., Bardwell L., and Thorner J. (1997) Inhibitory and activating functions for MAPK Kss1 in the S. cerevisiae filamentous-growth signaling pathway. Nature 390, 85–88 [DOI] [PubMed] [Google Scholar]
- 74. Madhani H. D., and Fink G. R. (1997) Combinatorial control required for the specificity of yeast MAPK signaling. Science 275, 1314–1317 [DOI] [PubMed] [Google Scholar]
- 75. Madhani H. D., Styles C. A., and Fink G. R. (1997) MAP kinases with distinct inhibitory functions impart signaling specificity during yeast differentiation. Cell 91, 673–684 [DOI] [PubMed] [Google Scholar]
- 76. Ferrigno P., Posas F., Koepp D., Saito H., and Silver P. A. (1998) Regulated nucleo/cytoplasmic exchange of HOG1 MAPK requires the importin beta homologs NMD5 and XPO1. EMBO J. 17, 5606–5614 [DOI] [PMC free article] [PubMed] [Google Scholar]
- 77. Reiser V., Ruis H., and Ammerer G. (1999) Kinase activity-dependent nuclear export opposes stress-induced nuclear accumulation and retention of Hog1 mitogen-activated protein kinase in the budding yeast Saccharomyces cerevisiae. Mol. Biol. Cell 10, 1147–1161 [DOI] [PMC free article] [PubMed] [Google Scholar]
Associated Data
This section collects any data citations, data availability statements, or supplementary materials included in this article.