Abstract
The dry roasting of peanuts is suggested to influence allergenic sensitization due to formation of advanced glycation end products (AGE) on peanut proteins. Identifying AGEs is technically challenging. The AGEs of a peanut allergen were probed with nanoLC-ESI-MS and MS/MS analyses. Amadori product ions matched to expected peptides and yielded fragments that included a loss of 3 waters and HCHO. Due to the paucity of b- and y-ions in the MS/MS spectrum, standard search algorithms do not perform well. Reactions with isotopically labeled sugars confirmed that the peptides contained Amadori products. An algorithm was developed based upon information content (Shannon entropy) and the loss of water and HCHO. Results with test data show that the algorithm finds the correct spectra with high precision, reducing the time needed to manually inspect data. Computational and technical improvements allowed better identification of the chemical differences between modified and unmodified proteins.
Keywords: Peanuts (Arachis hypogaea), Allergen, Advanced glycation end products, Amadori products, Maillard reactions, Shannon Entropy
Introduction
Allergies to peanuts are an increasing concern in public health. In the United States, 1-2% of the population, or nearly 3 million people, are allergic to peanuts.1 The molecular basis for peanut allergy has been the subject of extensive commentary and research.2 One hypothesis suggests the common method of processing peanuts in the U.S., i.e. dry roasting, increases the allergenic nature of peanuts and tree nuts.3, 4 During dry roasting the proteins can be extensively modified with advanced glycation end products (AGE) and the connection to allergy has been supported by several in vitro studies suggesting that AGE modified proteins skew the immune response towards allergy.5-7 Recently these findings were corroborated in a murine study where dry roasting enhanced peanut allergic sensitization across mucosal and cutaneous routes.8 Since the AGE modifications appear to influence sensitization, knowledge of their chemical structures will be important for understanding the mechanism of action.
Characterizing the AGE modifications on peanut allergens has proven challenging. Early studies utilized antibodies specific for certain types of AGEs.9 More recent studies have utilized mass spectrometry (MS) to specifically identify chemical modifications and the modified residues.10-12 This provided detailed atomic information, but several technical challenges make this a difficult process. First, the modifications on lysine and arginine residues prevent digestion of the allergens with commonly used trypsin-related proteases. Second, the proteins were difficult to extract and purify from roasted peanuts,13 and required extraction with urea,11 or multiple chromatography steps.12 Despite problems, some commonly modified peptides have been identified.10-12
AGEs are created in a non-enzymatic mechanism known as the Maillard reaction. This process is accelerated by higher temperatures and dry roasting, which leads to an increased number of AGE modifications compared with boiling.14 The first step in formation of an AGE occurs when sugars react primarily with free amines forming a Schiff-base.15 The modifications are most common on lysines and are less frequently observed on arginines, the N-terminus, and cysteines.16 The sugar modification then undergoes a further Amadori rearrangement to create a covalently modified protein. The ketone of the Amadori product, however, can initiate further decomposition resulting in a variety of different AGEs. The most common AGE created is a carboxymethyllysine, which is produced by additional adduct oxidation.
While manually examining MS/MS spectra of peanut extract for modifications, it was noticed that many spectra were observed that demonstrated significant neutral loss of water, but very little to no b-ion and y-ion formation from the peptide backbone.12 It was previously noted that peptides modified by the Amadori product produce a common fragmentation pattern in MS/MS experiments in which ions that correspond primarily to neutral loss of 3 and 4 waters as well as an ion that corresponds to neutral loss of 3 waters and HCHO are observed.17 Very few b-ions and y-ions are generated from the fragmentation of these peptides making it difficult to identify the peptide.17 These spectra are commonly scored poorly by standard software packages as little information on the peptide sequence is obtained and even when b-ions and y-ions are present, dominant fragment ions (the neutral loss of 3 and 4 waters and the neutral loss of 3 waters and HCHO) are unassigned. However, a careful manual examination can sometimes find b- and y-series ions at low signal to noise levels that can then be employed for assignment of the peptide sequence. In this paper, the correspondence between the low information spectra and the glycated peptides was confirmed with isotopic labeling of the precursor sugars and recombinant peanut protein, an idea suggested by other glycation studies.18, 19 To target these low information spectra for glycation analysis, a new computational algorithm was designed using a Shannon entropy-based method.
Materials and Methods
Glycation of recombinant Ara h 1
Purified recombinant Ara h 1 (0.5 mg/ml) (mature sequence - amino acid residues 85-626 of UniProtKB/Swiss-Prot accession P43238.1 ) 12 was solubilized in PBS and incubated at 55°C in the presence of 0.25 mol/L glucose, xylose, 1:1 12C glucose:13C glucose, or 1:1 12C xylose:13C xylose for 0 or 10 days. Trypsin was added at a 20:1 substrate to enzyme ratio and digestion was carried out at 37°C for 14 hrs. Reactions were stopped by freezing at - 80°C for use in subsequent mass spectrometry analysis.12
NanoLC-ESI-MS/MS
NanoLC-ESI-MS/MS analyses were performed using an Agilent 1100 nanoLC system on-line with an Agilent XCT Ultra ion trap mass spectrometer with the Chip Cube Interface. 20 μLs of the peptide digest were loaded onto an Agilent C18 chip (75 μm × 43 mm). Peptides were eluted by applying linear gradient from 5% acetonitrile, 0.1% formic acid to 50% acetonitrile, 0.1% formic acid to the column over 45 minutes. The mass spectrometer was used in the positive ion mode, standard enhanced mode and included settings of a mass range from 200 to 2200 m/z, an ionization potential of 2.1 kV, an ICC smart target of 200000 or 200 milliseconds of accumulation, and a 1.0 volt fragmentation amplitude. MS/MS data were acquired using a data dependent acquisition format with the 6 most abundant ions from each MS scan further interrogated by MS/MS. The automated switching for MS/MS required a threshold of 10000 counts.
Generation of Peak Lists and Traditional Database Searching
Peak lists were generated from the data obtained from the nanoLC-ESI-MS/MS analysis using the Data Extractor feature of the Spectrum Mill software from Agilent. The Data Extractor settings included limiting the data search to deconvoluted ions observed between 400 and 6000 Da and a retention time between 10 minutes and 50 minutes. Moreover, of the remaining MS/MS spectra, only spectra that contained sequence tag information greater than or equal to 1 residue were submitted for database searching. The resulting extracted data were then searched iteratively against the sequence of the recombinant Ara h 1 (gi:347447590) using the MS/MS Search function in the Spectrum Mill software. Search settings included a trypsin specificity with two missed cleavages allowed, a precursor ion mass tolerance of 2 Da, a product ion mass tolerance of 0.7 Da, variable methionine oxidation, and a minimum matched spectral intensity of 70%. Putative matches were manually validated and the remaining unmatched spectra were then searched again against the rAra h 1 sequence using similar settings but allowing for lysine modification by either carboxymethyl-, carboxyethyl, or Amadori products.
Test Data Set
An LC-ESI-MS/MS test data set was generated using the tryptic digest of a 10 day incubation of rAra h 1 with 12C xylose. The 2929 MS/MS spectra were manually evaluated for fragmentation in the MS/MS that was low information and also suggested neutral loss of water(s) being the primary fragment ion(s). The resulting spectra were then manually matched to peptides of rAra h 1 modified by Amadori products or AGEs. The resulting 12 spectra with confirmed Amadori products were then used for evaluation of the Shannon entropy-based algorithm.
NanoLC-ESI-MS/MS/MS
NanoLC-ESI-MS/MS/MS analyses were performed using an Agilent 1200 nanoLC system on-line with an Agilent 6340 ion trap mass spectrometer with the Chip Cube Interface using the same LC and MS/MS conditions described above. Ions that demonstrated a neutral loss of 27, 18, or 13.5 m/z, from the precursor in the MS/MS spectrum were further analyzed in an automated way by MS/MS/MS experiments.
Computational Algorithm
Shannon Entropy is a measure of the information content of a message or data set.
| Eq [1] |
H is the Shannon Entropy, so named because it resembles the Boltzman equation for thermodynamic entropy. P can be any data. In this case is the intensity at an m/z ratio of x. The equation sums the product of the P(x) times the log(P(x)) over all i points in the mass spectrum. The base of logarithm can be any number, in this case b=10. In data not shown, there was very little discriminatory gain to utilizing different bases. For each mass spectrum analyzed here, the ion peak lists were generated using the Data Extractor function of Spectrum Mill MS Proteomics Workbench (Agilent) and binned into vectors of length i, with a cumulative intensity in each bin. The intensities for each vector were normalized prior to calculating H.
After sorting the values of H for the spectra with the lowest values, the second step of the algorithm was to check for the ion pattern typical of the Amadori products, namely that the maximum abundance ion had a neutral loss of a water and a loss of HCHO. All of the ions in the top 10% of intensities were checked for two corresponding mass peaks at the 2+, 3+, or 4+ states for 3H2O and HCHO, with a mass tolerance of 2 Da. Both the Shannon entropy and ion pattern based filtering steps are evaluated below.
Results
Amadori products identified from 12C:13C glucose treated samples
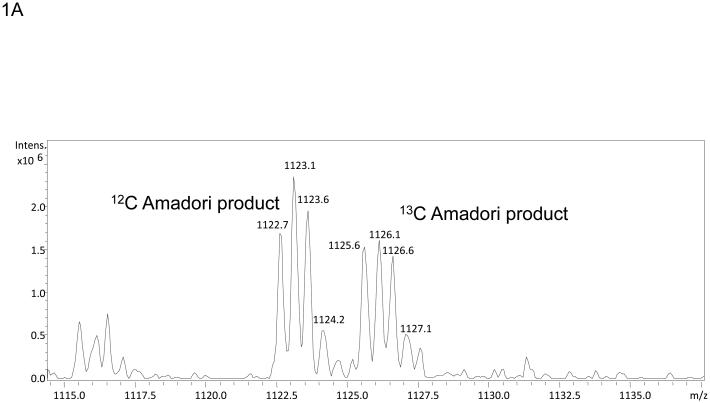
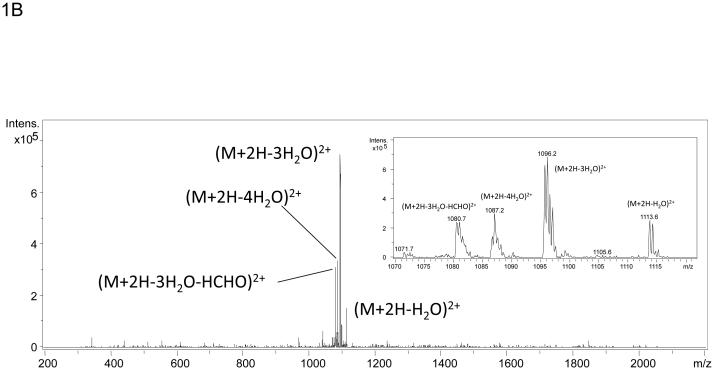
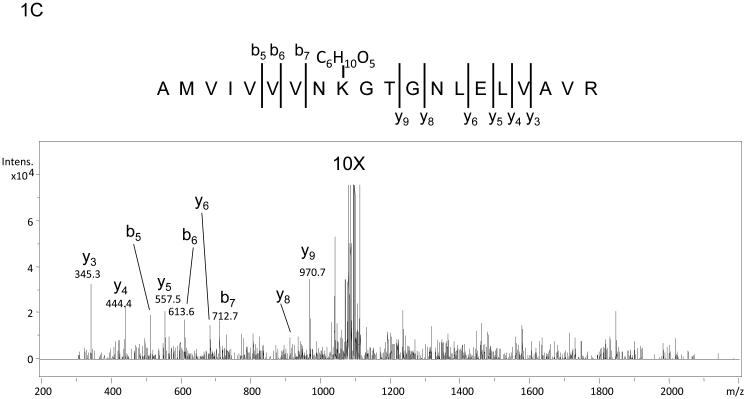
The use of stable isotopes has routinely been used in conjunction with mass spectrometry for quantitation of metabolites and more recently proteins. In fact, a stable isotope dilution strategy has recently been employed to quantitate Amadori compounds in foods.20 In addition to aiding with quantitation, mixtures of isotopes can also be used to create mass signatures so that post-translational or chemical modifications can be more readily detected as was done by Priego-Capote, et al. in efforts to identify AGEs.18 In efforts to identify previously uncharacterized Amadori products or AGE modifications, recombinant Ara h 1 was treated with a 1:1 mixture of 12C:13C glucose and subjected to digestion followed by nanoLC-MS and MS/MS. Modification by glucose and subsequent rearrangement to the Amadori product and/or decay to an AGE results in peptides that are readily observed as a dyad of ions with one ion arising from the 12C glucose and a sister ion arising from the 13C glucose. These dyads are easily recognized when manually interrogating individual MS spectra. The mass difference between the pair of ions should be 1 Da for each carbon incorporated as had been demonstrated by Stefanowicz et al and Priego-Capote, et al .18, 19 Figure 1A shows an MS spectrum of the dyad (m/z 1122.7 and m/z 1125.6) where a peptide is modified by a six-carbon product. The ion at m/z 1122.7 corresponds to the species that contains all 12C and the ion at m/z 1125.6 corresponds to the species that contains all 13C. Both species are doubly charged, hence the m/z difference of 3 for a six-carbon modification. In this example, the dyad corresponds to the tryptic peptide containing residues 452-471 of our construct) of Ara h 1 modified by an Amadori product at lysine 460. Figure 1B shows example data characteristic of a low information MS/MS spectrum similar to those previously observed in studies of in vitro glycated human serum and model peptides.17, 21, 22 A few characteristics to note are the scarcity of fragment ions with those few that are observed being of high abundance and corresponding to the neutral loss of waters and the neutral loss of 3 waters and HCHO from the precursor ion. This behavior matches well with pervious observations21 and the scheme suggested by Frovol et al. 22 However, looking on an intensity scale a factor of ten larger, Figure 1C demonstrates that the MS/MS spectrum does contain low abundance b- and y-ions that can be manually interpreted. This suggested that further targeted manual analyses of these characteristic spectra may be useful in identifying the modified peptides and the sites of Amadori product formation.
Figure 1.
Mass spectra of the tryptic peptide spanning amino acids 452-471from glycated recombinant Ara h 1. Panel A shows the mass spectrum of the dyad of ions at m/z 1122.7 and m/z 1125.6 that correspond to amino acid residues 452-471 with K460 modified by glycation that arises from the incubation of rAra h 1 with 1:1 12C glucose:13C glucose. Panel B is the low information MS/MS spectrum of ion m/z 1122.7 with an inset showing a zoom in from m/z 1070 to m/z 1120. The neutral losses of 3 waters and 3 waters plus HCHO are characteristic for Amadori product modified peptides. Panel C is the 10X zoom of the MS/MS of ion m/z 1122.7 which shows very low abundance b- and y- series ions.
Design of Shannon Entropy Algorithm
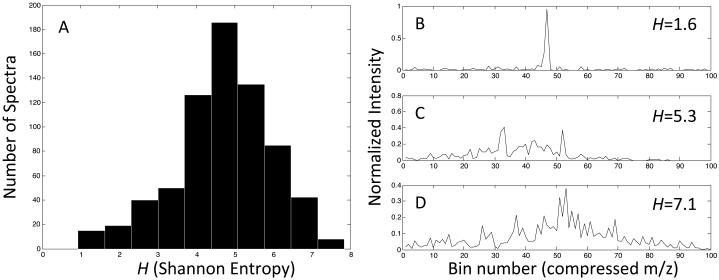
A single nanoLC-MS/MS analysis of in vitro glycated recombinant Ara h 1 yielded 2929 individual MS/MS spectra. These spectra were triaged using the Data Extractor routine from the Agilent Spectrum Mill MS Proteomics Workbench, resulting in 706 spectra meeting the criterion outlined in the methods section. Among this set of 706 MS/MS spectra, twelve spectra with data similar to that shown in figure 1A were manually confirmed as containing Amadori products. Figure 2 shows a histogram of the calculated Shannon entropy (H), for the test set, using a bin size of 100. Panels B, C, and D show three examples of the normalized and binned MS data for which the H values are 1.6, 5.3, and 7.1 respectively. Qualitatively, this confirmed that a low value of the Shannon entropy would be able to identify the type of spectra containing the typical Amadori product fragmentation pattern seen in figure 1A.
Figure 2.
Shannon Entropy of Binned MS Spectra. The Shannon entropy H was calculated for the test set of spectra according to equation 1. A) Histogram of H for the test spectra. B), C), and D) are examples of binned MS spectra (a compressed m/z scale) for visual comparison of calculated H values.
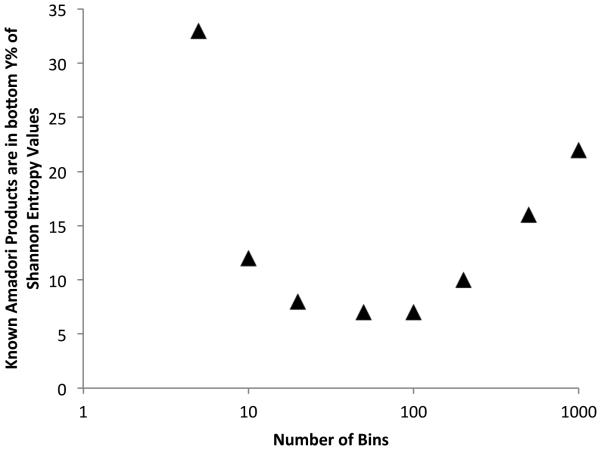
The goal of the search algorithm was to significantly reduce the number of MS/MS or MS3 spectra that needed to be manually interrogated in efforts to identify b- and y- ions that may lead to peptide identification and localization of the site of the Amadori product modification, but at the same time not miss any of these rare modifications. Hence, the parameters were optimized to include a high false positive rate. For example, the optimal size of the number of bins is a tradeoff between m/z resolution and increased noise. The Shannon entropy was calculated for different bin sizes, and the data were assessed for whether or not the known correct twelve spectra, landed in the bottom Y% of the H values. Figure 3 shows that at small binning values the resolution of the data is inadequate to use H to spot the twelve spectra, while at binning values >100 noise begins to dominate the calculation and H is again ineffective at identifying the correct spectra. A bin size of 50 or 100 were equivalent in maximally reducing the number of spectra that needed to be searched, by 93%. To be conservative in future studies, the top 90% of H values were eliminated from further examination using a bin size of 50.
Figure 3.
Optimizing search strategy. The number of bins (compressed m/z) is plotted against the bottom percent of H values that the known amadori product spectra occur. The optimum number of bins (between 50 and 100) puts the known spectra among the fewest other false positives, about 7%.
Next, the peak lists of the bottom 10% of H values (n=71) were examined for spectra that contained the characteristic fragmentation pattern in Figure 1A. These characteristics were: the maximum abundance ion had a neutral loss of 3 water molecules from a 2+, 3+, or 4+ precursor ion and a neutral loss of HCHO. Empirically the neutral loss of 3 waters was the most abundant fragment ion. This eliminated 34 more spectra from consideration, and retained 37 spectra that still contained the correct 12 spectra. Hence the false positive rate was 68%, but the combination of the two filtering procedures reduced the number of data sets that needed to be examined by 95%. As an aside if the Shannon entropy filter is not used, a filter based only on the loss of water and HCHO correctly retains the twelve spectra of interest but eliminates only 37% of the total spectra for manual interpretation.
Applying the Shannon Entropy and Ion Filter
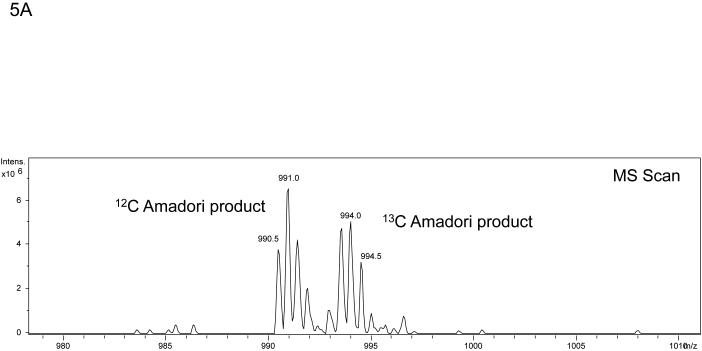
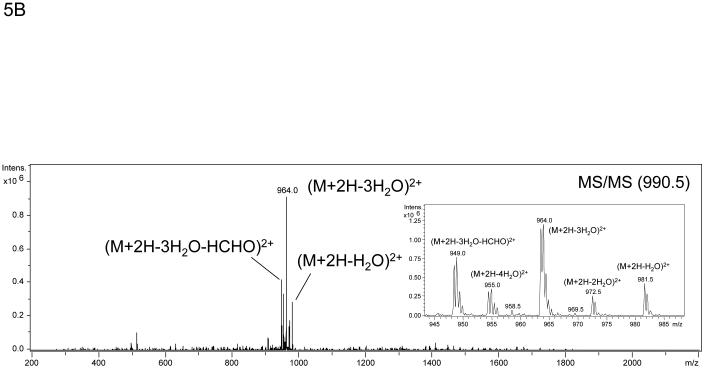
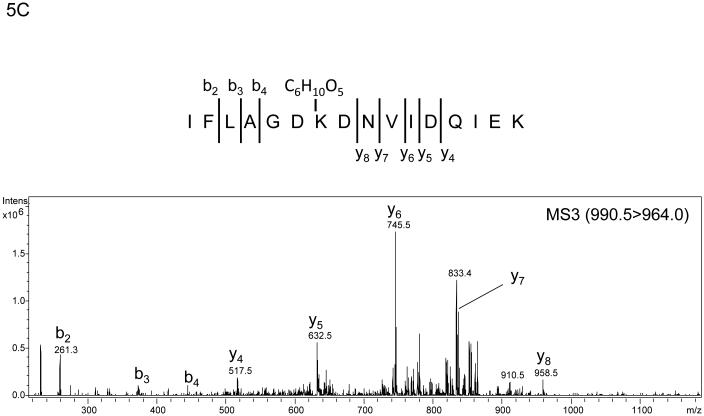
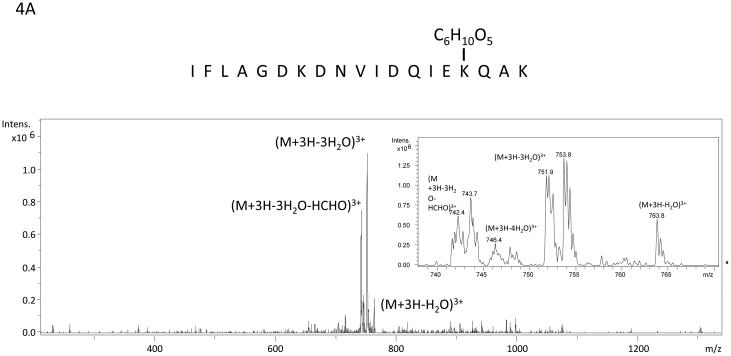
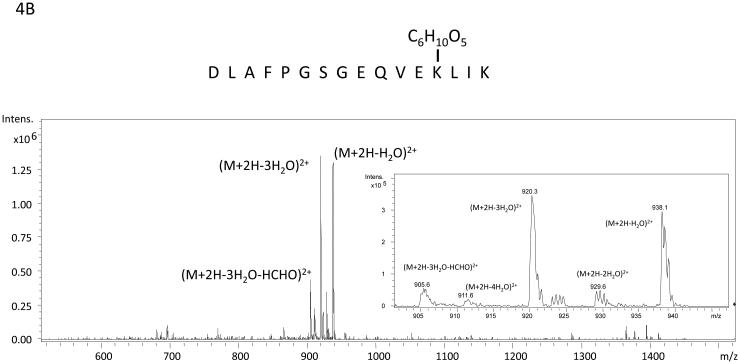
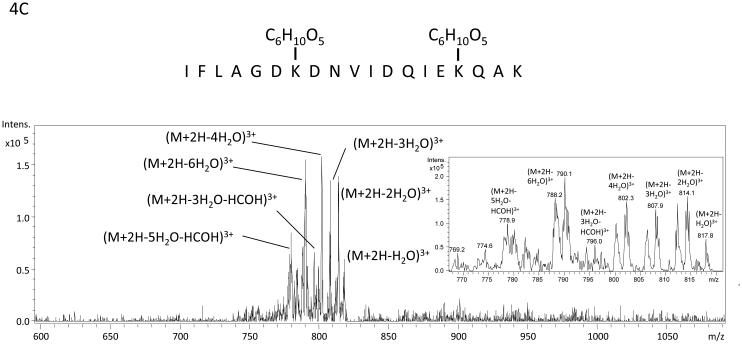
The algorithm described above was applied to two additional NanoLC-ESI-MS/MS experiments containing 2948 MS/MS spectra and 3029 MS/MS spectra and candidate spectra were identified. Figure (amino acids 541-559 K556-Amadori), 4B (amino acids 560-575 K572-Amadori), and 4C (amino acids 541-559 K547-Amadori and K556-Amadori) show example MS/MS data of several ions found to correspond to an Amadori product modification of recombinant, in vitro glycated peanut allergen, Ara h 1. These data further suggested that MS3 of ions that arose from neutral loss of water in the MS/MS would be useful for the unambiguous assignment of the candidate ions to tryptic peptides from Ara h 1. Hence we employed a strategy similar to the one employed by Zhang, et al. where neutral loss triggered MS3 was used.17 Figure 5 shows the MS, MS/MS, and MS3 data that result from such an experimental approach. The data in panel 5A showing a dyad of ions confirm that an isotopic mixture of the two sugars was used in creating the glycation. Panel 5B shows the characteristic low information MS/MS and ion fragmentation pattern observed when performing MS/MS on many glycated peptides. Finally, figure 5C shows the MS3 with the annotated b- and y- ions that were used to identify the modified peptide and glycation product. The sum of these data allowed us to unambiguously identify a tryptic peptide spanning the amino acid residues 541-556 with an Amadori product modification of K547. Table 1 lists the new Ara h 1 modifications that were identified using some or all of this combined procedure. Thirteen new modifications were identified that had not been previously characterized.
Figure 5.
Example of the MS, MS/MS, and MS3 data that result from a neutral loss triggered MS3 experiment performed on rAra h1. The data in panel A again shows a mass spectrum that demonstrates a dyad of ions corresponding to a tryptic peptide that is glycated as a result of the incubation of rAra h 1 with 1:1 12C glucose:13C glucose . Panel B is the MS/MS spectrum of ion m/z 990.5 showing the loss of multiple waters and HCHO with an inset showing a zoom in from m/z 945 to m/z 990. Panel C shows the MS3 of the ion m/z 990.5 > m/z 964.0 with the resulting b- and y- ions annotated that allow for the unambiguous assignment of the Amadori modified tryptic peptide covering amino acid residues 541-559 with K547 as the site of modification.
Table 1.
| Sequence Numbers |
Peptide Sequence | Predicted MW |
m/z | Charge State |
Observed MW |
Delta Mass |
Corresponding Modification† |
|---|---|---|---|---|---|---|---|
| 214-228 | IVQIEAK*PNTLVLPK | 1662 | 912.7 | 2 | 1823.4 | 161.4 | Amadori Product |
| 285-307 | VAK*ISMPVNTPGQFEDFFPASSR | 2524.2 | 896.4 | 3 | 2686.2 | 162 | Amadori Product |
| 386-401 | K*GSEEEGDITNPINLR | 1770.9 | 967.7 | 2 | 1933.4 | 162.5 | Amadori Product |
| 402-421 | EGEPDLSNNFGK*LFEVKPDK | 2262.1 | 808.4 | 3 | 2422.2 | 160.1 | Amadori Product |
| 414-421 | LFEVK*PDK | 974.5 | 569.5 | 2 | 1137 | 162.5 | Amadori Product |
| 452-471 | AMVIVVVNK*GTGNLELVAVR | 2081.2 | 748.6 | 3 | 2242.8 | 161.6 | Amadori Product |
| 461-477 | GTGNLELVAVRK*EQQQR | 1925 | 661.7 | 3 | 1982.1 | 57.1 | CML |
| 461-477 | GTGNLELVAVRK*EQQQR | 1925 | 666.5 | 3 | 1996.5 | 71.5 | CEL |
| 461-477 | GTGNLELVAVRK*EQQQR | 1925 | 696.2 | 3 | 2085.6 | 160.6 | Amadori Product |
| 541-556 | IFLAGDK*DNVIDQIEK | 1817 | 990 | 2 | 1978 | 161 | Amadori Product |
| 541-559 | IFLAGDKDNVIDQIEK*QAK | 2144.2 | 769.9 | 3 | 2306.7 | 162.5 | Amadori Product |
| 541-559 | IFLAGDK*DNVIDQIEK*QAK | 2144.2 | 823.4 | 3 | 2467.2 | 323 | 2 × Amadori Product |
| 557-575 | QAK*DLAFPGSGEQVEKLIK | 2057.1 | 706.2 | 3 | 2115.6 | 58.5 | CML |
| 560-575 | DLAFPGSGEQVEK*LIK | 1729.9 | 947 | 2 | 1892 | 162.1 | Amadori Product |
Site of peptide modification
CML: carboxy-methyl-lysine. CEL: Carboxy-ethyl-lysine. Amadori product: C6H10O5
Discussion
Using isotopic labeling, MS3, and computational strategies, we were able to formulate a workflow that enabled the rapid identification of Amadori product-modified peptides. In a test sample containing 2929 total MS/MS spectra, using only computational approaches, we were able to reduce the number of spectra down to 37 for manual interpretation. These 37 spectra contained all 12 spectra of the Amadori product-modified peptides. Two of the modified peptides were observed as both 2+ and 3+ ions, but there was no significant difference in the fragmentation patterns based upon which charge state was selected. It should be pointed out, however, that we cannot make any generalizations with regards to the charge state-dependence of the fragmentation of the Amadori products due to this extremely small sampling. Nevertheless, this combination of approaches facilitated the identification of 13 additional ions corresponding to peptides containing modifications on the peanut allergen, Ara h 1, that we previously had not been able to characterize.
The peptides in Table 1 show that some of the same peptides are modified with different AGEs. This is theoretically possible as AGEs can be heterogeneous. It is interesting to speculate that local protein structure and chemistry may have some influence on the type of AGE modifications, but not enough data is available to fully assess this. Some of the peptides in Table 1 were identified in other studies as AGE modified peptides. 10-12 Whether or not these are ‘hot spots’ for AGE modifications is unknown. Because the AGEs are still problematic to identify, it is difficult to conclude that other solvent accessible sites are not modified. It is important to not over-interpret the currently small data set of modifications.
It is important to note that if glycation is suspected before mass spectrometric analyses, additional techniques such as the neutral-loss directed MS3, multi-stage activation, and electron transfer dissociation would be warranted and could lead to more robust characterization of sites of glycation. The Shannon entropy algorithm detailed here occupies a niche where it is likely best applied as a rescue technique to reanalyze data-dependent-acquisition data sets that have already been collected. In other words, if no modified peptides were found with standard software packages the data can be parsed again with this algorithm to reduce the dataset to a manageable size (nearly a 99% reduction in our test case) for manual MS/MS spectra interpretation.
This computational technique is simple and easy to generalize. The utility of the isotopic labeling was only to confirm the initial suspicion that these low information spectra were indeed the spectra that contained the modified peptides. This is not necessary in future applications. Other applications may include the characterization of glycosylated peptides where the MS/MS collisional energy is primarily absorbed by the carbohydrate, which also reduces the number of b- and y- ions for peptide identification. Additional health applications include the identification of glycation markers in patient sera of type 2 diabetes, aging, and cardiovascular disease. 23, 24
In the future, the technique can be applied to peanut extract and other foods.25 In a preliminary examination of peanut extracts the method appears applicable, however the variety and mass degeneracy of AGEs is currently confounding further progress. Further purification of the protein of interest may be required. Nevertheless, knowledge of the common fragmentation patterns and exact masses may be useful for MS detection of trace amounts of peanut allergen in prepared food. This could improve the accuracy and safety of food labeling as recently proposed.11 Additionally, identifying the sites of modification and the chemical modifications may explain why dry roasting skews the immune response towards allergy. In a study directly applicable to Ara h 1 studied here, AGE-modified Ara h 1 was demonstrated to influence the proliferation of Caco-2 cells, which are a model for intestinal epithelia. This influence depended on the incubation time and temperature of Ara h 1 with the sugars, indicating the possibility that specific AGE modifications may be important for influencing the pro-inflammatory network.26 The technique developed here will be applicable in characterizing the modifications that lead to the differential effect.
Figure 4.
Example mass spectra of several Amadori product modified tryptic peptides from rAra h 1. Panel A is the MS/MS spectrum of the peptide containing amino acids 541-559 with K556 modified by an Amadori product. The inset is a zoom in from m/z 740 to m/z 770 with ions corresponding to the losses of 1 H2O, 3H20, 4H20 and 3 H2O and HCHO labeled. The sister ions at m/z 743.7, m/z 747.9, and m/z 753.8 correspond to the 13C labeled Amadori product (m/z 771.8) that co-isolated during the MS/MS of 12C-ion: m/z 769.9. Panel B is the MS/MS spectrum of the peptide spanning amino acids 560-575 with K572 modified by an Amadori product. The inset is a zoom in from m/z 900 to m/z 945 with ions corresponding to the losses of 1 H2O, 2H20, 3H20, 4H20 and 3 H2O and HCHO labeled. Panel C is the MS/MS spectrum of the peptide containing amino acids 541-559 with both K547 and K556 modified by Amadori products. The inset is a zoom in from m/z 775 to m/z 820 with ions corresponding to multiple water losses and water and HCHO losses labeled. This spectrum is extremely complicated because the fragmentation of two Amadori products and the fact that all the neutral losses exist as ion dyads due to the co-isolation of the 13C labeled Amadori product containing peptide with the natural abundance (99% 12C) Amadori product labeled peptide when performing MS/MS.
Acknowledgements
The authors thank Ms. Andrea Adams for technical assistance and Drs. Peter Thompson and Jeffrey Kuhn for a critical reading of the manuscript.
Funding Sources
This research was supported in part by Research Project Number Z01- ES102885-01 to REL, and Z01-ES102488-05 to JGW in the Intramural Research Program of the National Institute of Environmental Health Sciences, National Institutes of Health.
List of abbreviations
- AGE
Advance glycation end products
- CML
Carboxymethyllysine
- CEL
Carboxyethyllysine
- LC
Liquid chromatography
- ESI
Electrospray ionization
- MS
Mass Spectrometry
Footnotes
The authors affirm that no conflicts of interest exist.
References
- 1.Liu AH, Jaramillo R, Sicherer SH, Wood RA, Bock SA, Burks AW, Massing M, Cohn RD, Zeldin DC. National prevalence and risk factors for food allergy and relationship to asthma: results from the National Health and Nutrition Examination Survey 2005-2006. J Allergy Clin Immunol. 2010;126:798–806. doi: 10.1016/j.jaci.2010.07.026. e13. [DOI] [PMC free article] [PubMed] [Google Scholar]
- 2.Mueller GA, Maleki SJ, Pedersen LC. The Molecular Basis of Peanut Allergy. Curr Allergy Asthm R. 2014:14. doi: 10.1007/s11882-014-0429-5. [DOI] [PMC free article] [PubMed] [Google Scholar]
- 3.Beyer KB, Morrow E, Li XM, Bardina L, Bannon GA, Burks AW, Sampson HA. Effects of cooking methods on peanut allergenicity. J Allergy Clin Immun. 2001;107:1077–1081. doi: 10.1067/mai.2001.115480. [DOI] [PubMed] [Google Scholar]
- 4.Iwan M, Vissers YM, Fiedorowicz E, Kostyra H, Kostyra E, Savelkoul HFJ, Wichers HJ. Impact of Maillard Reaction on Immunoreactivity and Allergenicity of the Hazelnut Allergen Cor a 11. J Agr Food Chem. 2011;59:7163–7171. doi: 10.1021/jf2007375. [DOI] [PubMed] [Google Scholar]
- 5.Ilchmann A, Burgdorf S, Scheurer S, Waibler Z, Nagai R, Wellner A, Yamamoto Y, Yamamoto H, Henle T, Kurts C, Kalinke U, Vieths S, Toda M. Glycation of a food allergen by the Maillard reaction enhances its T-cell immunogenicity: role of macrophage scavenger receptor class A type I and II. J Allergy Clin Immunol. 2010;125:175–83. doi: 10.1016/j.jaci.2009.08.013. e1-11. [DOI] [PubMed] [Google Scholar]
- 6.Buttari B, Profumo E, Capozzi A, Facchiano F, Saso L, Sorice M, Rigano R. Advanced glycation end products of human beta(2) glycoprotein I modulate the maturation and function of DCs. Blood. 2011;117:6152–6161. doi: 10.1182/blood-2010-12-325514. [DOI] [PubMed] [Google Scholar]
- 7.Hilmenyuk T, Bellinghausen I, Heydenreich B, Ilchmann A, Toda M, Grabbe S, Saloga J. Effects of glycation of the model food allergen ovalbumin on antigen uptake and presentation by human dendritic cells. Immunology. 2010;129:437–45. doi: 10.1111/j.1365-2567.2009.03199.x. [DOI] [PMC free article] [PubMed] [Google Scholar]
- 8.Moghaddam AE, Hillson WR, Noti M, Gartlan KH, Johnson S, Thomas B, Artis D, Sattentau QJ. Dry roasting enhances peanut-induced allergic sensitization across mucosal and cutaneous routes in mice. J Allergy Clin Immun. 2014;134:1453–1456. doi: 10.1016/j.jaci.2014.07.032. [DOI] [PMC free article] [PubMed] [Google Scholar]
- 9.Chung SY, Champagne ET. Association of end-product adducts with increased IgE binding of roasted peanuts. J Agr Food Chem. 2001;49:3911–3916. doi: 10.1021/jf001186o. [DOI] [PubMed] [Google Scholar]
- 10.Chassaigne H, Norgaard JV, van Hengel AJ. Proteomics-based approach to detect and identify major allergens in processed peanuts by capillary LC-Q-TOF (MS/MS) J Agr Food Chem. 2007;55:4461–4473. doi: 10.1021/jf063630e. [DOI] [PubMed] [Google Scholar]
- 11.Hebling CM, McFarland MA, Callahan JH, Ross MM. Global Proteomic Screening of Protein Allergens and Advanced Glycation Endproducts in Thermally Processed Peanuts. J Agr Food Chem. 2012 doi: 10.1021/jf303554t. [DOI] [PubMed] [Google Scholar]
- 12.Mueller GA, Maleki SJ, Johnson K, Hurlburt BK, Cheng H, Ruan S, Nesbit JB, Pomes A, Edwards LL, Schorzman A, Deterding LJ, Park H, Tomer KB, London RE, Williams JG. Indentification of Maillard reaction products on panut allergens that influence binding to the receptor for advanced glycation end products. Allergy. 2013 doi: 10.1111/all.12261. [DOI] [PMC free article] [PubMed] [Google Scholar]
- 13.Schmitt DA, Nesbit JB, Hurlburt BK, Cheng HP, Maleki SJ. Processing Can Alter the Properties of Peanut Extract Preparations. J Agr Food Chem. 2010;58:1138–1143. doi: 10.1021/jf902694j. [DOI] [PubMed] [Google Scholar]
- 14.Uribarri J, Woodruff S, Goodman S, Cai WJ, Chen X, Pyzik R, Yong A, Striker GE, Vlassara H. Advanced Glycation End Products in Foods and a Practical Guide to Their Reduction in the Diet. J Am Diet Assoc. 2010;110:911–916. doi: 10.1016/j.jada.2010.03.018. [DOI] [PMC free article] [PubMed] [Google Scholar]
- 15.Hodge JE. The Amadori Rearrangement. Adv Carbohyd Chem. 1955;10:169–205. doi: 10.1016/s0096-5332(08)60392-6. [DOI] [PubMed] [Google Scholar]
- 16.Rabbani N, Thornalley PJ. Glycation research in amino acids: a place to call home. Amino Acids. 2012;42:1087–96. doi: 10.1007/s00726-010-0782-1. [DOI] [PubMed] [Google Scholar]
- 17.Zhang Q, Petyuk VA, Schepmoes AA, Orton DJ, Monroe ME, Yang F, Smith RD, Metz TO. Analysis of non-enzymatically glycated peptides: neutral-loss-triggered MS3 versus multi-stage activation tandem mass spectrometry. Rapid Commun Mass Sp. 2008;22:3027–3034. doi: 10.1002/rcm.3703. [DOI] [PMC free article] [PubMed] [Google Scholar]
- 18.Priego-Capote F, Scherl A, Muller M, Waridel P, Lisacek F, Sanchez JC. Glycation Isotopic Labeling with C-13-Reducing Sugars for Quantitative Analysis of Glycated Proteins in Human Plasma. Mol Cell Proteomics. 2010;9:579–592. doi: 10.1074/mcp.M900439-MCP200. [DOI] [PMC free article] [PubMed] [Google Scholar]
- 19.Stefanowicz P, Kijewska M, Kluczyk A, Szewczuk Z. Detection of glycation sites in proteins by high-resolution mass spectrometry combined with isotopic labeling. Anal Biochem. 2010;400:237–243. doi: 10.1016/j.ab.2010.02.011. [DOI] [PubMed] [Google Scholar]
- 20.Meitinger M, Hartmann S, Schieberle P. Development of Stable Isotope Dilution Assays for the Quantitation of Amadori Compounds in Foods. J Agr Food Chem. 2014;62:5020–5027. doi: 10.1021/jf501464g. [DOI] [PubMed] [Google Scholar]
- 21.Lapolla A, Fedele D, Reitano R, Arico NC, Seraglia R, Traldi P, Marotta E, Tonani R. Enzymatic digestion and mass spectrometry in the study of advanced glycation end products/peptides. J Am Soc Mass Spectr. 2004;15:496–509. doi: 10.1016/j.jasms.2003.11.014. [DOI] [PubMed] [Google Scholar]
- 22.Frolov A, Hoffmann P, Hoffmann R. Fragmentation behavior of glycated peptides derived from D-glucose, D-fructose and D-ribose in tandem mass spectrometry. J Mass Spectrom. 2006;41:1459–1469. doi: 10.1002/jms.1117. [DOI] [PubMed] [Google Scholar]
- 23.Beisswenger PJ. Methylglyoxal in diabetes: link to treatment, glycaemic control and biomarkers of complications. Biochemical Society Transactions. 2014;42:450–456. doi: 10.1042/BST20130275. [DOI] [PubMed] [Google Scholar]
- 24.Simm A. Protein glycation during aging and in cardiovascular disease. J Proteomics. 2013;92:248–259. doi: 10.1016/j.jprot.2013.05.012. [DOI] [PubMed] [Google Scholar]
- 25.Yu TY, Morton JD, Clerens S, Dyer JM. Proteomic Investigation of Protein Profile Changes and Amino Acid Residue Level Modification in Cooked Lamb Meat: The Effect of Boiling. J Agr Food Chem. 2015;63:9112–9123. doi: 10.1021/acs.jafc.5b03324. [DOI] [PubMed] [Google Scholar]
- 26.Teodorowicz M, Fiedorowicz E, Kostyra H, Wichers H, Kostyra E. Effect of Maillard reaction on biochemical properties of peanut 7S globulin (Ara h 1) and its interaction with a human colon cancer cell line (Caco-2) Eur J Nutr. 2013 doi: 10.1007/s00394-013-0494-x. [DOI] [PMC free article] [PubMed] [Google Scholar]


