There is an error in the last sentence of the Results subsection of the Abstract. The correct sentence should read: HTLV-1 PVLs were lower in cases with rapid disease progression than in those with slow progression in sporadic cases.
A sentence is missing in the subsection “Clinical and laboratory findings in patients with rapid disease progression” of the Results section. The missing sentence should be added as the third to last sentence of that section and should read as: HTLV-1 PVLs of rapid progression were also lower than those of slow progression in familial cases (395 vs 984 copies), but it was not significant because of small number of subjects (3 rapid cases vs 29 slow cases).
There is an error in the subsection “Clinical characteristics of f-HAM/TSP” within the Results section. The ratio is flipped in the second sentence, which should correctly read: The sex ratio was 7 males: 33 females.
In Table 1, the values are incorrect for the “Female ratio (%)” row. Please see the corrected Table 1 here.
Table 1. Clinical features of f-HAM/TSP cases or sporadic cases of HAM/TSP.
| f-HAM/TSP cases (40 cases) | Sporadic cases (124 cases) | p value | p value† | |
|---|---|---|---|---|
| Female ratio (%) | 82.5% (7 males: 33 females) | 75.0% (31 males: 93 females) | NS | |
| Age | 55.6 ± 13.0 (23–79) | 61.8 ± 12.5 (15–83) | 0.008 | |
| Age of onset | 41.3 ± 13.9 (14–65) | 51.6 ± 15.9 (13–78) | <0.001 | 0.017 |
| Duration of illness (years) | 14.3 ± 11.4 (1–49) | 10.2 ± 9.6 (0–45) | 0.026 | 0.017 |
| Initial symptoms | ||||
| Gait disturbance | 50.0% | 52.4% | NS | |
| Urinary disturbance | 32.5% | 26.6% | NS | |
| Sensory disturbance | 12.5% | 14.5% | NS | |
| Others | 5% | 6.5% | NS | |
| Rapid disease progression | 4 cases (10.0%) | 35 cases (28.2%) | 0.019 | 0.069 |
| Motor disability score | 4.0 ± 2.0 (0–7) | 4.9 ± 1.5 (0–8) | 0.043 | 0.036 |
| Score more than 6 | 12 cases (30.0%) | 38 cases (30.7%) | NS | |
| Time elapsed between onset and wheelchair use in daily life (years) | 18.3 ±12.4 (7–50) | 10.0 ± 10.4 (1–45) | 0.025 | 0.020 |
Data are presented as mean values ± s.d., (range)
† Adjusted for age and sex
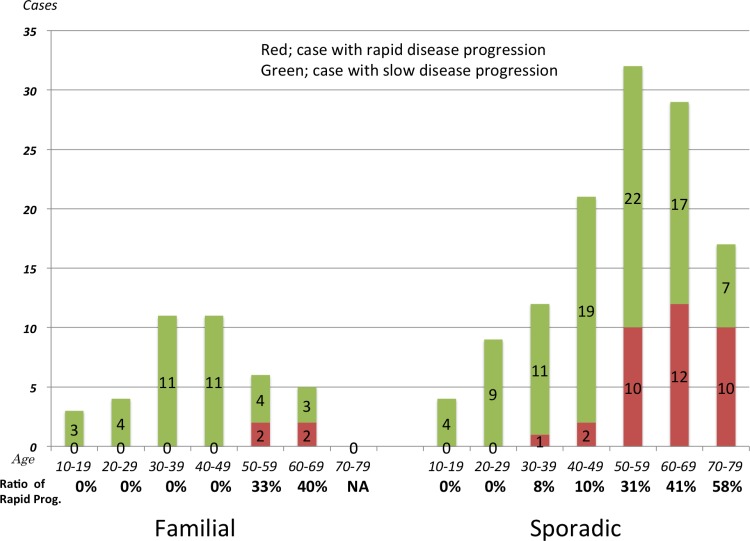
The values are incorrectly reported in Fig 2. Please see the complete, correct Fig 2 here.
Fig 2. Age-specific proportions of rapid disease progression.
The proportion of cases with rapid disease progression tended to increase with the older age of onset.
Reference
- 1.Nozuma S, Matsuura E, Matsuzaki T, Watanabe O, Kubota R, Izumo S, et al. (2014) Familial Clusters of HTLV-1-Associated Myelopathy/Tropical Spastic Paraparesis. PLoS ONE 9(5): e86144 doi: 10.1371/journal.pone.0086144 [DOI] [PMC free article] [PubMed] [Google Scholar]


