Abstract
Chronic opiate use induces opiate dependence, which is characterized by extremely unpleasant physical and emotional feelings after drug use is terminated. Both rewarding effects of drug and the desire to avoid withdrawal symptoms motivate continued drug use1-3, and the nucleus accumbens (NAc) is important for orchestrating both processes4,5. While multiple inputs to the NAc regulate reward6-9, little is known about the NAc circuitry underlying withdrawal. Here we identify the paraventricular nucleus of the thalamus (PVT) as a prominent input to the NAc mediating the expression of opiate withdrawal induced physical signs and aversive memory. Activity in the PVT to NAc pathway is necessary and sufficient to mediate behavioral aversion. Selectively silencing this pathway abolishes aversive symptoms in two different mouse models of opiate withdrawal. Chronic morphine exposure selectively potentiates excitatory transmission between the PVT and D2-receptor-expressing medium spiny neurons (D2-MSNs) via synaptic insertion of GluA2-lacking AMPA receptors. Notably, in vivo optogenetic depotentiation restores normal transmission at PVT→D2-MSNs synapses and robustly suppresses morphine withdrawal symptoms. These results link morphine-evoked pathway- and cell type-specific plasticity in the PVT→NAc circuit to opiate dependence, and suggest that reprogramming this circuit holds promise for treating opiate addiction.
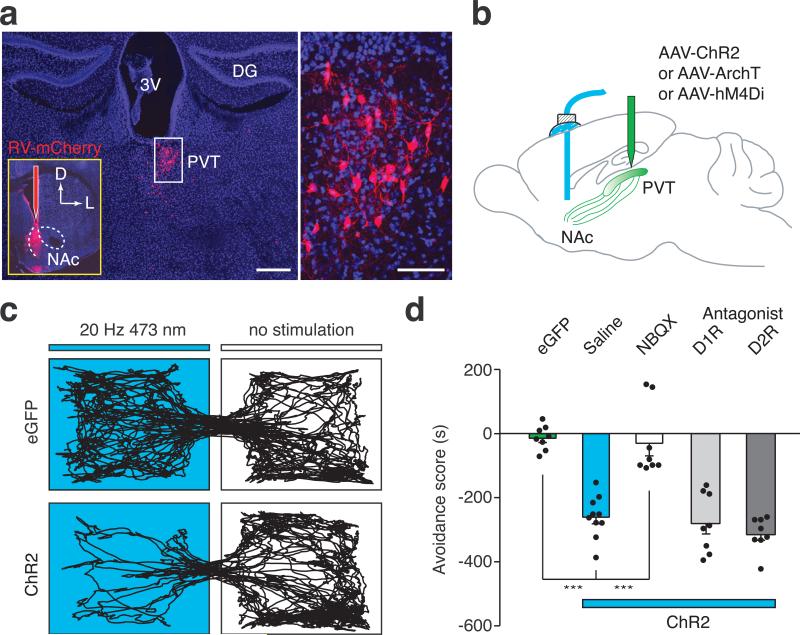
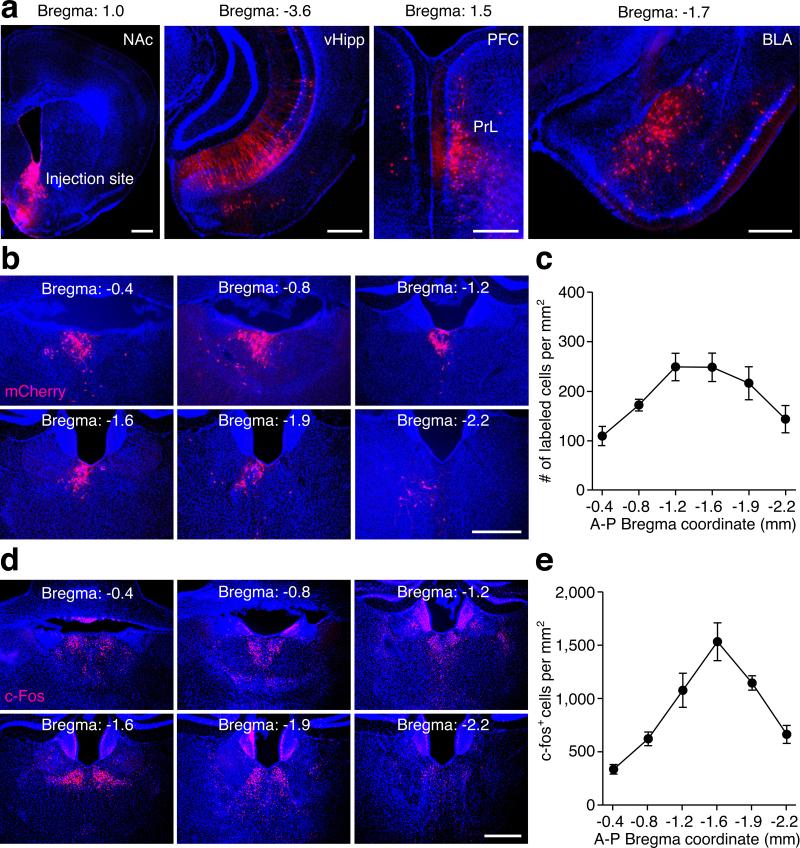
To systematically map brain regions that directly innervate the NAc, we stereotaxically injected a rabies virus in which the viral glycoprotein is replaced by red fluorescent protein mCherry (RV-mCherry) into the medial shell of the NAc10,11. Besides well-characterized inputs to the NAc, such as the prefrontal cortex (PFC), ventral hippocampus (vHipp), and basolateral amygdala (BLA)8,10,12 (Extended Data Fig.1a), we also detected mCherry-expressing neurons in the PVT (Fig.1a, Extended Data Fig.1b). This result was particularly interesting because although previous studies have suggested a potentially important role for the PVT in drug-seeking behavior, its underlying circuitry mechanism remains unknown13-15.
Figure 1. In vivo optical activation of the PVT→NAc pathway evokes behavioral aversion.
a, Left: Cluster of retrogradely labeled cells was observed in the PVT 5 days after injection of RV-mCherry into the medial shell of the NAc (n = 7). Scale bar, 500 μm; Inset shows the RV-mCherry injection site. Right: magnified image shows the morphology of labeled neurons in the boxed area. Scale bar, 50 μm. D, dorsal; L, lateral; 3V, third ventricle; DG, dentate gyrus. b, Schematics of in vivo manipulation of the PVT→NAc circuit in behaving animals. c, Representative RTPP tracks illustrate light-evoked behavioral aversion in ChR2-expressing mice (bottom, n = 10) but not in eGFP-expressing control mice (top, n = 8). d, Quantification of light-evoked aversion and its effect by intra-NAc pharmacological manipulations. Intra-NAc infusions of NBQX (AMPAR antagonist, 1.0 μg in 200 nl, n = 8) but not saline (n = 10), SCH23390 (D1R antagonist, 0.2 μg in 200 nl, n = 8) or Raclopride (D2R antagonist, 0.3 μg in 200 nl, n = 8) abolished behavioral aversion evoked by optical stimulation of the PVT→NAc fibers. One-way ANOVA (F(4, 37) = 29.61, p < 0.0001) followed by Post-hoc Tukey's test. *** p < 0.001. Mean ± s.e.m.
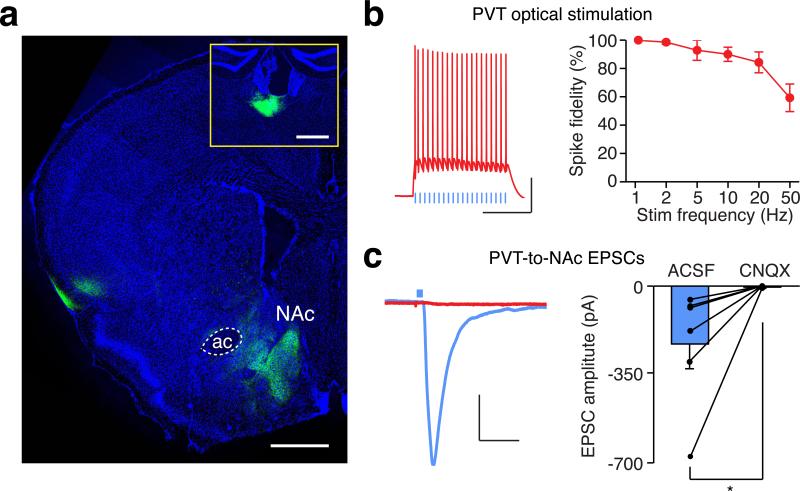
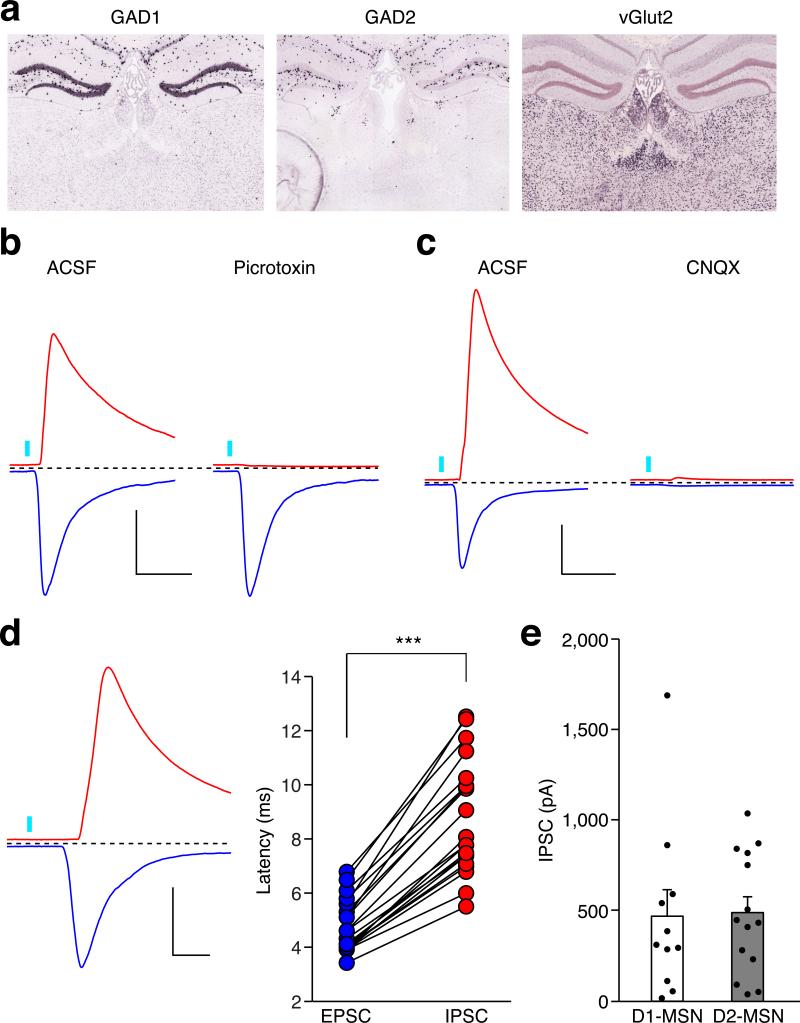
To characterize the PVT to NAc connection, we injected channelrodopin2-expressing adeno-associated virus (AAV-ChR2) into the PVT, then prepared acute NAc slices containing ChR2-expressing terminals from the PVT16 (Extended Data Fig. 2a). Brief light stimulation (3-5 ms) elicited reliable firing of action potentials up to 20 Hz in ChR2-expressing PVT neurons (Extended Data Fig. 2b). The same stimulation also evoked robust α-amino-3-hydroxy-5-methyl-4-isoxazolepropionic acid receptor (AMPAR)-mediated excitatory postsynaptic currents (EPSCs) in MSNs, as it was blocked by bath application of a competitive AMPAR antagonist CNQX (Extended Data Fig. 2c). Light stimulation also evoked picrotoxin-sensitive inhibitory postsynaptic currents (IPSCs) (Extended Data Fig. 3b). Because the PVT contains few if any GABAergic neurons (Extended Data Fig. 3a), it is likely that these IPSCs were caused by feed-forward inhibition in a local NAc circuit. Consistent with this prediction, PVT activation-evoked IPSCs had a longer delay than that of the EPSCs and the IPSCs which were blocked by CNQX (Extended Data Fig. 3c,d).
Activation of inputs from the PFC, vHipp and BLA to the NAc is rewarding and drives self-stimulation behavior8,9. To directly assess the behavioral consequences of PVT→NAc circuit activity, we optogenetically activated this pathway in freely moving mice and examined their motivational valence using a real-time place preference (RTPP) assay (Fig.1b) (Methods, Extended Data Fig. 4). Strikingly, optogenetic activation of the PVT→NAc pathway reduced the time spent in the chamber paired with light stimulation (Fig. 1c). This indicates that, unlike other major inputs to the NAc, activation of the PVT→NAc pathway is aversive rather than rewarding. Avoidance of the light-paired chamber was dependent on local glutamatergic but not dopaminergic transmission in the NAc. Intra-NAc infusion of AMPAR antagonist NBQX abolished the avoidance behavior, while intra-NAc infusion of D1 receptor (D1R) antagonist SCH23390 or D2 receptor (D2R) antagonist Raclopride had no effect (Fig. 1d). These results demonstrate that the PVT→NAc pathway transmits negative valence, and reveal an input-specific mechanism driving motivated behavior in the NAc.
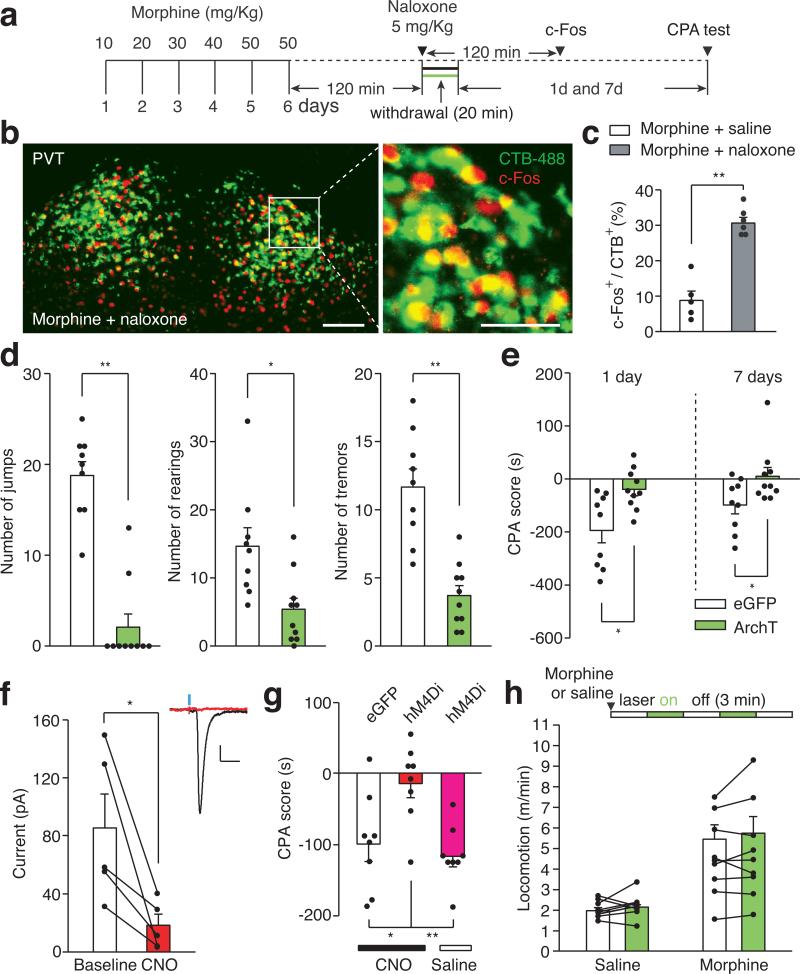
Since activation of the PVT→NAc pathway evoked an aversive response, this pathway could be instrumental for the negative symptoms of drug withdrawal. To test this, we selectively silenced the pathway in two different models of opiate withdrawal and examined withdrawal-induced physical signs and place aversion. We utilized optogenetic terminal silencing by injecting an archaerhodopsin-3 (ArchT)-expressing AAV into the PVT and bilaterally implanting fiber guide cannulae in the NAc17 (Extended Data Fig. 4). Two weeks after surgery, mice were treated with daily intraperitoneal (i.p.) injections of morphine in their home cage with doses escalating from 10 to 50 mg Kg−1, to develop opiate dependence18 (Fig. 2a). Two hours after the final morphine treatment, we injected naloxone, μ-opioid receptor antagonist (5 mg kg−1, i.p.), and confined the mice to one side of a two-compartment conditioned place aversion (CPA) training chamber3. This naloxone dose evoked strong negative somatic signs and robust avoidance to the withdrawal chamber in morphine-dependent mice, but not in drug-naïve mice (Extended Data Fig. 5). Moreover, injection of naloxone in chronic morphine-treated mice elicited robust expression of c-Fos, a marker for recent neuronal activity, in the PVTNAc projection neurons, which were labeled by injecting of retrograde tracer CTB-488 into the NAc (Fig. 2b,c; Extended Data Fig. 6a,b). Remarkably, constant bilateral optogenetic silencing of the PVT→NAc pathway during naloxone-precipitated withdrawal suppressed somatic signs of opiate dependence and learned place-aversion (measured 1 and 7 days after withdrawal) (Fig. 2d,e).
Figure 2. The PVT→NAc pathway is required for expression of aversive withdrawal symptoms.
a, Experimental timeline for b-e. b, Confocal images showing that naloxone-precipitated withdrawal induced robust expression of c-Fos (red) in the PVTNAc projection neurons (green) that were retrogradely labeled by injection of CTB-488 into the medial shell of the NAc (n = 6). Left: scale bar, 100 μm; Right: magnified image shows the boxed area. Scale bar, 50 μm. c, Percentage of PVTNAc projection neurons expressing c-Fos. Naloxone (gray bar, n = 6) but not saline (white bar, n = 5) injection evoked significant expression of c-Fos in the PVTNAc projection neurons. Mann-Whitney U-test. ** p < 0.01. d,e, Quantification of naloxone-precipitated withdrawal behaviors and CPA score. Light stimulation in ArchT- (green bar, n = 10) but not eGFP- (white bar, n = 9) expressing mice during withdrawal significantly reduces the number of jump, rearing and tremor events (d) as well as the expression of CPA (e). Mann-Whitney U-test. * p < 0.05, ** p < 0.01. f, CNO (3 μM) inhibits light-evoked synaptic current recorded from postsynaptic MSNs (n = 5). Inset shows example light-evoked EPSC traces before (black) and after (red) perfusion of CNO. Wilcoxon signed-rank test, * p < 0.05. Scale bar: 20 pA, 25 ms. g, Spontaneous opiate withdrawal induced CPA was reduced by local infusion of CNO in hM4Di- (red, n = 8) but not eGFP- (black, n = 8) expressing mice, or local infusion of saline in hM4Di- (magenta, n = 8) expressing mice. One-way ANOVA (F(2,21) = 7.4, p < 0.01) followed by Post-hoc Tukey's test. * p < 0.05, ** p < 0.01. h, Light stimulation has no effect on locomotor velocity in either saline (n = 9, p = 0.57) or morphine (n = 9, p = 0.5) injected animals. Wilcoxon signed-rank test. Mean ± s.e.m.
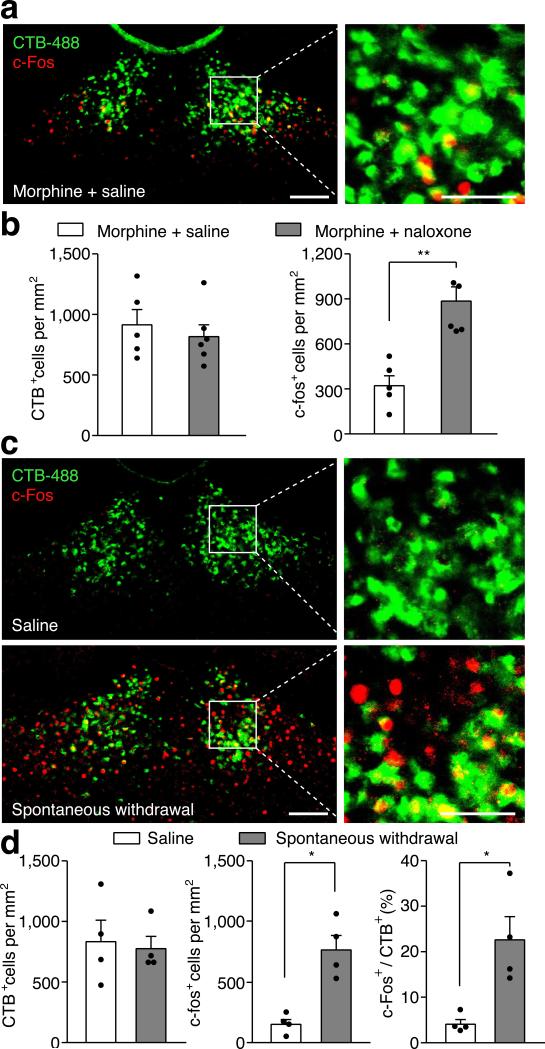
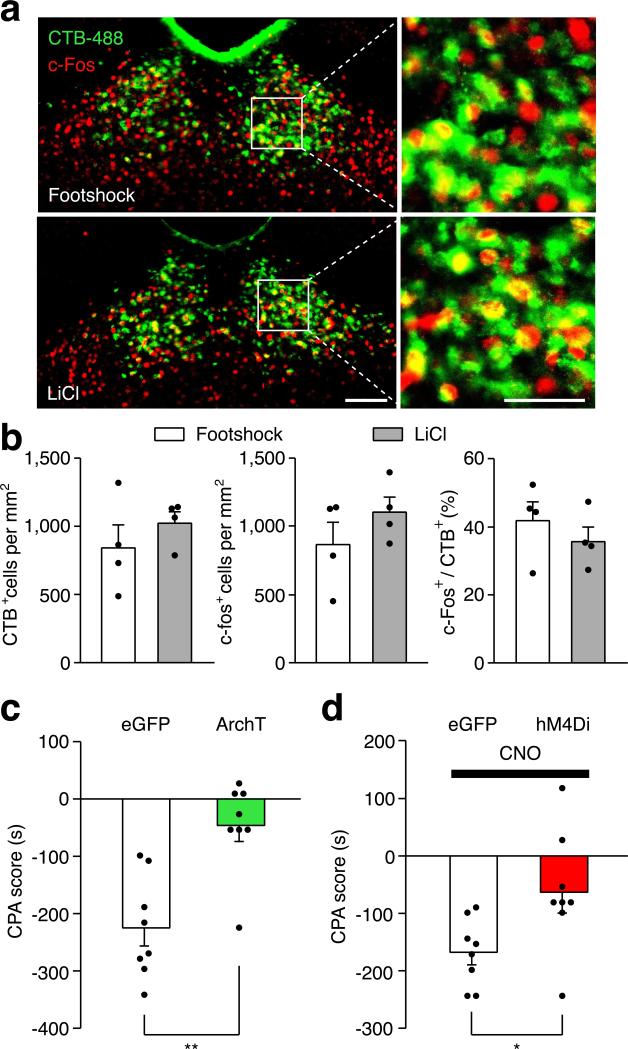
Opiate withdrawal in humans often results from cessation or reduction of opiate use, rather than blockade of opioid receptors, and this process can also be modeled in mice2,19. Spontaneous opiate withdrawal also evoked expression of c-Fos in PVTNAc projection neurons (Extended Data Fig. 6c,b). To measure aversive motivational states during spontaneous opiate withdrawal, mice were confined for 45 minutes to one side of a CPA training chamber 16 hours after each morphine injection. After 4 conditioning trials, mice developed aversion to the withdrawal chamber. We employed inhibitory DREADD (designer receptors exclusively activated by designer drugs; AAV-hM4Di) to selectively silence the PVT→NAc pathway during each 45 min CPA training trial20,21 (Fig.2f, Methods). Local infusion of clozapine-N-oxide (CNO, 3 μM) into the NAc before each CPA training session reduced the CPA score in AAV-hM4Di but not AAV-eGFP transduced mice (Fig. 2g). PVT→NAc pathway silencing had no effect on morphine-induced locomotor activity, a measurement of acute psychoactive drug effects7 (Fig. 2h). Therefore, activity in the PVT→NAc circuit is required for the expression of physical and emotional negative states following opiate withdrawal. Importantly, PVT→NAc pathway is not only for opioid-withdrawal induced aversion, mild footshock and i.p. injection of LiCl also evoked robust expression of c-Fos in PVTNAc projection neurons, and silencing the pathway during conditioning suppressed the ability of either of stimulus to evoke behavior aversion (Extended Data Fig. 7).
Chronic opiate use causes profound neuroadaptive changes in the NAc22,23. The NAc comprise two major subtypes of MSNs, defined by the expression of either D1 or D2 dopamine receptors (D1- or D2-MSNs). D1- and D2-MSNs are proposed to play opposing roles in mediating behavioral motivation and reward learning24,25, and synaptic plasticity of these MSNs appears to be causally involved in behavioral adaptations to drug addiction and chronic pain states6,7,26. Since the PVT→NAc pathway transmits negative valence and mediates opiate withdrawal symptoms, we anticipated that chronic morphine exposure might cause plasticity of the PVT input selectively onto D2-MSNs.
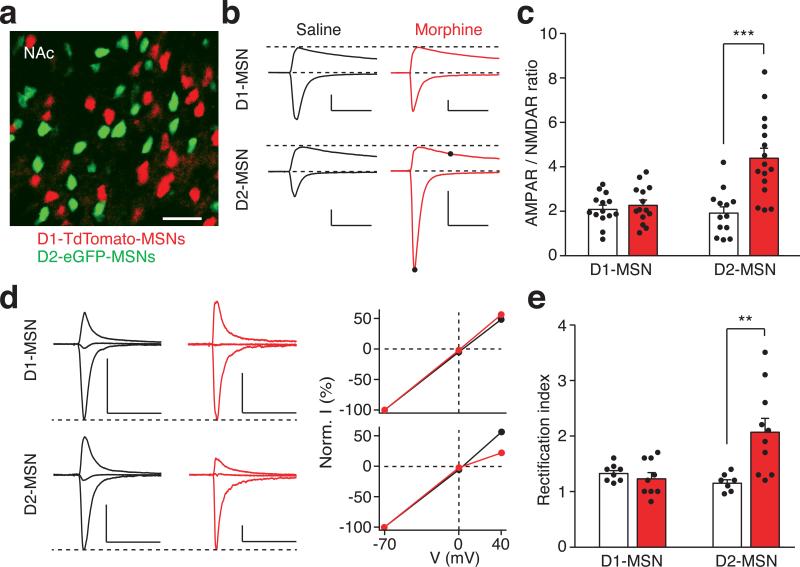
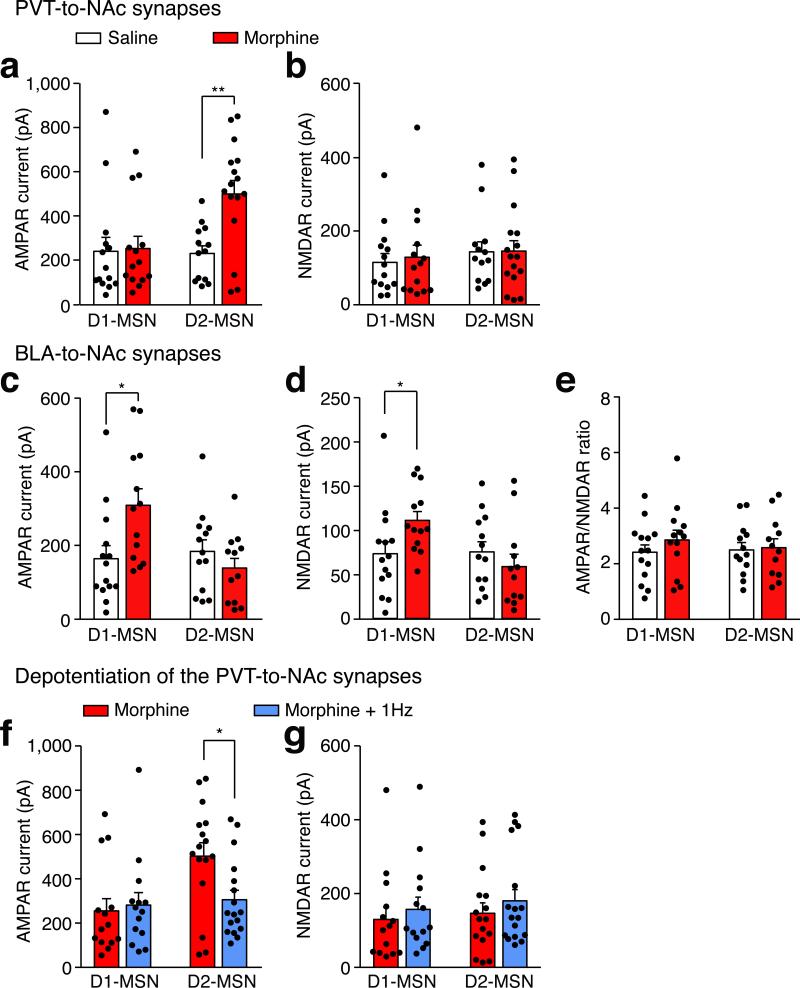
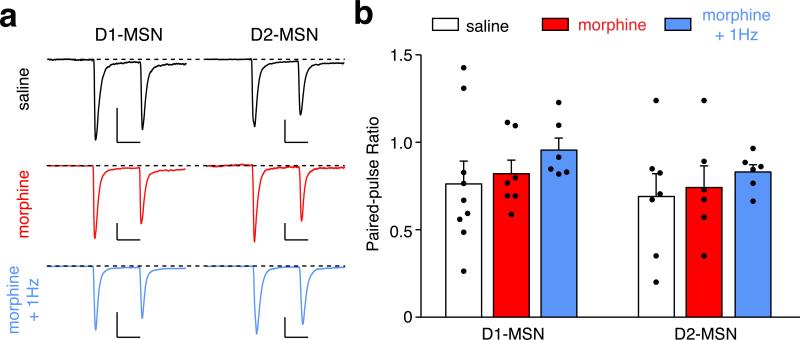
To directly examine morphine-induced synaptic plasticity of the PVT input onto identified NAc MSNs, we prepared brain slices from transgenic animals expressing fluorescent proteins under the control of the D1R or D2R promoter, with PVT neurons infected with AAV-ChR2 (Fig. 3a). To reduce experimental variability between slices, we measured the ratio of light-evoked AMPAR-mediated EPSCs to N-methyl-D-aspartate receptor (NMDAR)-mediated EPSCs (AMPAR/NMDAR ratio) in the same MSN. Consistent with our hypothesis, the escalating morphine regimen increased this ratio in D2-MSNs but not in D1-MSNs (Fig. 3b,c; Extended Data Fig. 8a,b). In contrast, presynaptic release probability was not changed in either type of MSN, as measured by the paired-pulse ratio (PPR) of light-evoked EPSCs in morphine-dependent mice (Extended Data Fig. 9). These results suggested that chronic morphine treatment caused a change in postsynaptic function. One plausible mechanism of drug-induced postsynaptic change is the insertion of GluA2-lacking calcium permeable AMPAR (CP-AMPAR) in the affected NAc synapses27. Compared to other AMPARs, CP-AMPARs have a larger conductance and show inward rectification at positive membrane potentials. In morphine-treated mice, we observed a significant increase in the rectification index selectively at PVT→D2-MSN synapses, but not at PVT→D1-MSN synapses (Fig. 3d,e). Interestingly, the AMPAR/NMDAR ratio at BLA→NAc synapses, which are part of a pathway that drives reward-seeking behavior, was not changed by the same morphine treatment (Extended Data Fig. 8 c-e). Collectively, these results indicate that the morphine regimen strengthened the PVT input selectively onto D2-MSNs via synaptic insertion of CP-AMPARs.
Figure 3. Morphine-induced potentiation at the PVT→D2-MSN synapses.
a, Image of a NAc slice from a D1–TdTomato and D2–eGFP double transgenic mouse (n = 5). Scale bar, 50 μm. b,c, Example traces (b) and quantification (c) of light-evoked EPSCs at −70 mV and +40 mV show that chronic morphine treatment significantly increased the AMPAR/NMDAR ratio in D2-MSNs (saline/morphine, n = 13/16 cells), but not D1-MSNs (saline/morphine, n = 14/14 cells). Two-way ANOVA (F(1,53) = 12.58, p < 0.001) followed by Post-hoc Tukey's test. *** p < 0.001. For comparison, EPSC amplitudes are normalized to peaks at +40 mV. Solid dots indicate the current amplitude used for calculating the AMPAR/NMDAR ratio. Scale bar: 300 pA, 50 ms. d,e, Example traces (d, left), I/V curve (d, right) and quantification (e) of light-evoked AMPAR EPSCs at −70 mV, 0 mV and +40 mV show that morphine treatment selectively increased the rectification index of AMPAR EPSCs in D2-MSNs (saline/morphine, n = 7/10 cells), but not D1-MSNs (saline/morphine, n = 8/9 cells). Two-way ANOVA (F(1,30) = 9.87, p < 0.01) followed by Post-hoc Tukey's test. ** p < 0.01. For comparison, amplitudes of AMPAR EPSCs are normalized to peaks at −70 mV. Scale bar: 250 pA, 50 ms. Mean ± s.e.m.
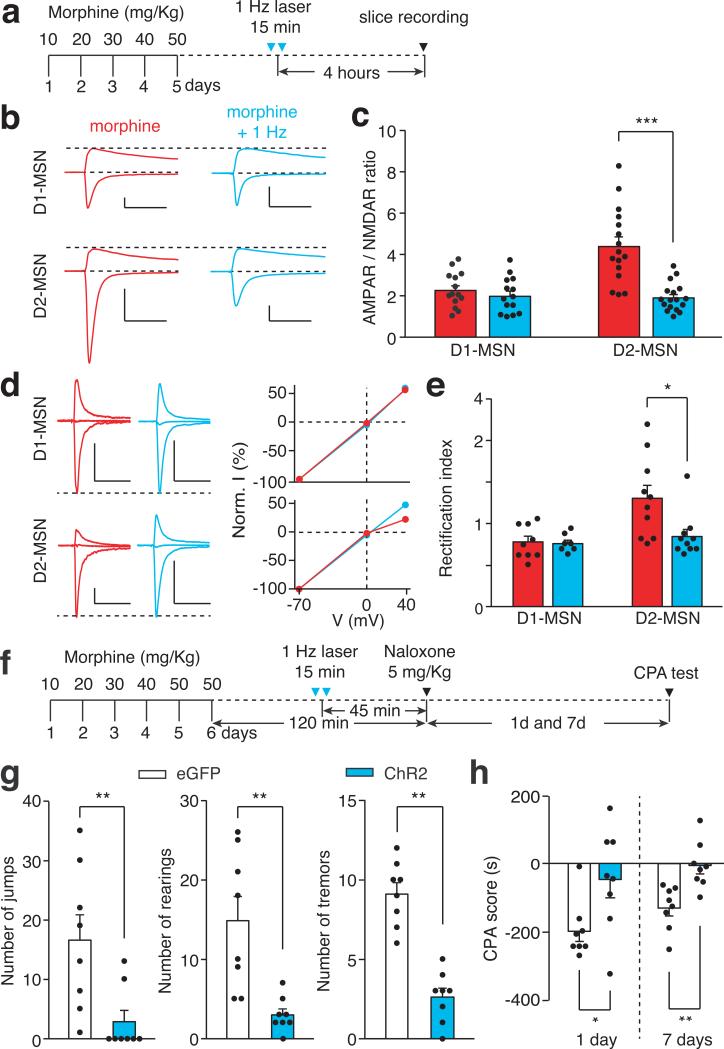
If morphine-induced potentiation of the PVT→D2-MSN synapse is essential for the expression of opiate withdrawal symptoms, then depotentiating this synapse in vivo to restore its normal transmission should relieve those symptoms. To test this prediction, we employed long-term depression (LTD)-based in vivo manipulation of the PVT→D2-MSN synapse by photostimulating ChR2-expressing PVT terminals in the NAc at 1 Hz for 15 min6,7,28(Fig. 4a). We applied this in vivo optogenetic LTD induction protocol in chronic morphine-treated mice, then prepared NAc slices to record photocurrents on visually identified D1- and D2-MSNs. Indeed, this light treatment reduced the AMPAR/NMDAR ratio, and rectified the AMPAR current at PVT→D2-MSN synapses to a level comparable to baseline transmission, but did not change the PPR (Fig.4b-e; Extended Data Fig. 8 f,g and 9). Treating morphine-dependent mice with this optogenetic LTD protocol 45 min before naloxone injection (Fig. 4f) reduced the immediate expression of withdrawal behavioral symptoms and the aversive memory of the withdrawal chamber (Fig. 4g,h). This 1Hz optogenetic stimulation had no effect on the plasticity at PVT→D1-MSN synapses (Fig. 4b-e). Together, these results establish a causal link between plasticity at PVT→D2-MSN synapses and the negative somatic and motivational states that accompany opiate withdrawal.
Figure 4. In vivo optogenetic LTD induction restores normal transmission at PVT→D2-MSN synapses and suppresses withdrawal symptoms.
a, Experimental timeline for b-e. b-e, in vivo 1Hz photostimulation successfully normalized morphine-induced changes of AMPAR/NMDAR ratio and rectification index in D2-MSNs, but had little effect on D1-MSNs. b,c, AMPAR/NMDAR ratio of D2-MSNs (morphine/morphine+1 Hz, n = 16/17 cells) and D1-MSNs (morphine/morphine+1 Hz, n = 14/14); Two-way ANOVA (F(1,57) = 13.86, p < 0.001) followed by Post-hoc Tukey's test. *** p < 0.001. d,e, Rectification index for AMPAR EPSCs in D2-MSNs (morphine/morphine+1 Hz, n = 10/10) and D1-MSNs (morphine/morphine+1 Hz, n = 9/7). Two-way ANOVA (F(1,32) = 4.3, p < 0.05) followed by Post-hoc Tukey's test. * p < 0.05. Scale bars: 300 pA, 50 ms (b); 250 pA, 50 ms (d). f, Experimental timeline for g,h. g,h, Quantification of withdrawal behaviors (g) and CPA score (h). In ChR2-(blue bar, n = 8) but not eGFP- (white bar, n = 8) expressing mice, in vivo 1Hz stimulation suppressed naloxone-precipitated jumping, rearing and tremor events (g), and also suppressed conditioned place aversion to the withdrawal chamber (h). Mann-Whitney U-test, * p < 0.05, ** p < 0.01. Mean ± s.e.m.
Complementary to previous studies that highlight the contribution of the PFC, BLA, and vHipp inputs to the NAc in mediating drug reward and their plasticity onto D1-MSNs after chronic drug exposure, here we show that the PVT input transmits negative valence and its plasticity at PVT→D2-MSN synapses is necessary for the expression of aversive states associate with opiate withdrawal. We further demonstrated that optogenetic restoration of normal synaptic transmission at these synapses effectively relieves withdrawal symptoms. Our optogenetic LTD protocol may inspire the development of novel treatments for opiate addiction involving deep brain stimulation to induce plasticity at relevant synapses29.
Methods
Animals
Male adult (5-12 weeks) C57BL/6, Drd1a–tdTomato, Drd2–eGFP and Drd1a–tdTomato/Drd2–eGFP double BAC transgenic mice were used for all experiments10. All procedures were in accordance with the US National Institutes of Health (NIH) guidelines for the care and use of laboratory animals, and were approved by Stanford University's Administrative Panel on Laboratory Animal Care.
Surgery
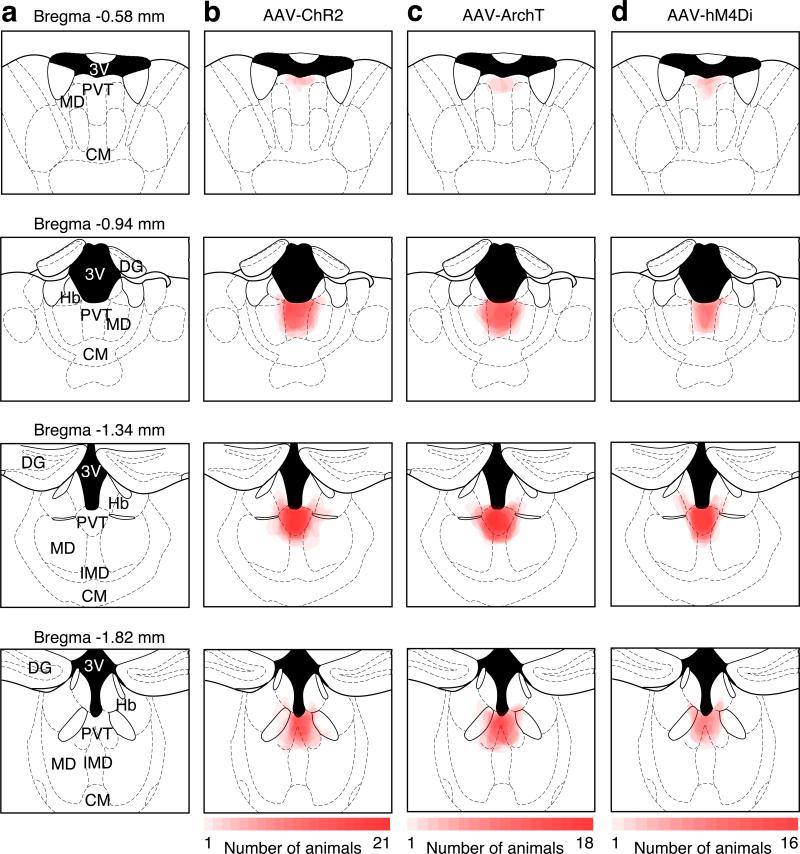
Stereotaxic injections were performed on 5-8 weeks old mice under ketamine and xylazine (100 mg Kg−1 and 10 mg Kg−1, i.p.) anesthesia using a stereotaxic instrument (BenchMARK Digital, Lecia). A small volume of concentrated virus solution was injected into the PVT (200 nl AAV, bregma −1.4 mm; lateral 0.1 mm; ventral 3.0 mm, with a 4° angle toward the midline) or medial shell of the NAc (500 nl RV-mCherry, bregma 1.1 mm; lateral 0.8 mm; ventral 4.6 mm) with a pulled glass capillary at a slow rate (100 nl min−1) using a pressure microinjector (Micro 4 system, World Precision Instruments). The injection needle was withdrawn 5 min after the end of the injection. For mice involved in behavioral experiments, a fiber-optic cannula (plastic one) was placed at least 500 μm above the medial shell of the NAc, and cemented onto the skull using dental cement (Lang Dental Manufacturing). Following surgery, a dummy was inserted to keep the guide cannula from getting clogged. Mice were allowed at least 2 weeks to recover and to express the virus before behavioral training. Rabies virus-injected mice were used 5 days after injection. The injected AAV led to the expression of ChR2, ArchT or hM4Di in PVT neurons extending from Bregma −1.82 mm to −0.94 mm (Extended Data Fig. 4), which covered the area with the highest density of PVTNAc projection neurons and the highest density of neurons expressing c-Fos in response to naloxone-precipitated withdrawal (Extended Data Fig. 1b-e). AAVs used in this study were produced by the University of Pennsylvania vector core: AAV1.hSyn.eGFP.WPRE.bGH, 1.76 × 10¹³ genomic copies ml−1; AAV1.hSynp.hChR2(H134R)-eYFP.WPRE.hGH, 3.35 × 10¹³ genomic copies ml−1; AAV9.CAG.ArchT.GFP.WPRE.SV40, 7.62× 10¹² genomic copies ml−1, and by the University of North Carolina vector core: AAV8.hSynp.hM4Di-mCherry, 8.3 × 10¹² genomic copies ml−1. The G-deleted Rabies-mCherry virus (4.5 × 10⁹ genomic copies ml−1) was produced by the gene transfer, targeting and therapeutics core at the Salk Institute for Biological Studies.
Behavioral assays
All mice used in behavioral assays were allowed to recover from surgery of AAV injection and cannula implantation for at least 3 weeks. Place preference training was performed in a custom-made two-compartment conditioned place preference (CPP) apparatus (30 × 25 × 20 cm). All locomotor behaviors, including real-time place preference, morphine-induced locomotion, and withdrawal-, LiCl-, footshock-induced place aversion were recorded for 15-20 min at 30 frames s−1 with a camera controlled by custom tracking software running on MATLAB (MathWorks). CPA score was calculated by subtracting the time spent in the aversive stimulus-paired side of the chamber during baseline from the time spent in the same side of the chamber during the test.
Real time place preference assay30
After connecting with optical fiber, mice infected with AAV-ChR2 or AAV-eGFP were placed in the CPP training apparatus for 15 min to assess their baseline place preference. During the test, we assigned the counterbalanced side of the chamber as the stimulation side, and placed the mice in the non-stimulated side to start the experiment. When the mouse crossed to the stimulated side of the chamber, it triggered 20 Hz laser stimulation (473 nm, 20 ms pulses, 7 mW per mm2 at the NAc) until the mouse crossed back to the non-stimulated side. Avoidance score was calculated by subtracting the time spent in stimulation side during baseline (without light) from the time spent in stimulation side during the test (with light).
Naloxone-precipitated morphine withdrawal
Mice infected with AAV-ArchT or AAV-eGFP were allowed to freely explore both side of a custom-made CPP training apparatus for 15 min in order to assess their baseline place preference. Then, these mice received single daily injection of morphine (i.p.) for 6 consecutive days with doses escalating at 10, 20, 30, 40, 50, 50 mg Kg−1 in their home cage to develop morphine dependence. Two hours after the last morphine injection, mice received an injection of naloxone (5 mgKg−1, i.p.) and were confined in the counterbalanced side of the CPP chamber. During the withdrawal, a constant green laser (532 nm, 5 mW per mm2 at the NAc) was delivered through the cannula onto the NAc. We turned off the laser for 1 min every 5 min to avoid tissue damage31. Withdrawal symptoms were recorded for 20 min before each mouse was returned to its home cage. Physical signs (jump, rearing and tremor) were manually quantified offline. 1 and 7 days after naloxone injection, withdrawal mice were re-exposed to the CPP chamber and allowed to explore both sides of the CPP chamber for 15 min.
Spontaneous morphine withdrawal19
Mice infected with AAV-hM4Di-mCherry or AAV-eGFP were allowed to freely explore both sides of a custom-made CPP training apparatus for 15 min in order to assess their baseline place preference. Then, these mice received daily injections of morphine (20 mg Kg−1, i.p.) in their home cage. Sixteen hours after each morphine injection, mice received a local infusion of CNO (3 μM, 200 nl) or saline (200 nl) through the cannula into the NAc. 20 min later, each mouse was confined for 45 min in the counterbalanced side of the training chamber. This entire procedure was repeated once per day for 4 days. 24 hours after the final training session, mice were re-exposed to the CPP chamber and allowed to explore both sides of the chamber for 15 min.
LiCl induced conditioned place aversion32
Mice infected with AAV-hM4Di-mCherry or AAV-eGFP were allowed to freely explore both sides of a custom-made CPP training apparatus for 15 min in order to assess their baseline place preference. Then, these mice were injected with saline (i.p.) and confined in the counterbalanced side of the training chamber for 1 hour before return to home cage. 6 hours later, the same mice were received a local infusion of CNO (3 μM, 200 nl) into the NAc 20 min before i.p. injection of LiCl (300 mg Kg−1) and confined in the other side of the chamber for 60 min. This entire procedure was repeated once per day for 4 days. 24 hours after the final training session, mice were re-exposed to the CPP chamber and allowed to explore both sides of the chamber for 15 min.
Footshock induced conditioned place aversion32,33
On day 1, mice infected with AAV-ArchT or AAV-eGFP were allowed to freely explore both sides of a custom-made CPP training apparatus for 15 min in order assess their baseline place preference. On the second day, after connecting with optical fiber, these mice were confined in the counterbalance side of the chamber for 15 min and received 10 unescapable mild footshocks (0.5 mA, 0.5 s with 90 s inter-stimulation interval) while constant green laser (532 nm, 5 mW per mm2 at the NAc) was delivered through the cannula onto the NAc. 24 hours later, mice were re-exposed to the CPP chamber and allowed to explore both sides of the CPP chamber for 15 min.
Morphine-induced locomotion
Mice infected with AAV-ArchT were habituated to the testing apparatus (36 × 36 × 20 cm) for two daily 30 min sessions before being subjected to the behavioral test on day 3. On the test day, mice were connected with optical fibers and received a single injection of saline or morphine (30 mgKg−1, i.p.). 5 min after injection, mice were placed in the testing apparatus for 15 min with laser stimulation (532 nm, 5 mW per mm2 at the NAc) alternating from off to on every 3 min. We compared the averaged locomotion velocity from two laser-on sessions to the mean locomotion velocity from three laser-off sessions.
In vivo optogenetic depotentiation
Two weeks after recovery from AAV-ChR2 or AAV-eGFP injection and cannula implantation surgery, mice received daily injections of morphine (i.p.) for 5 days with escalating doses of 10, 20, 30, 40, 50 mgKg−1 in their home cage. For slice recording, mice were photostimulated for 15 min with trains of 473 nm light (1 Hz, 4 ms, 900 pulses, 7 mW per mm2 at the NAc) 20 hours after the final morphine injection. For naloxone-precipitated morphine withdrawal, the same light stimulation was delivered 45 min before i.p. injection of naloxone.
Electrophysiological recording
Procedures for preparing acute brain slices and performing whole-cell recordings with optogenetic stimulations were similar to those described previously34,35. Coronal 250-300 μm slices containing the NAc were prepared using a vibratome (VT-1000S, Leica) in an ice-cold choline-based solution containing (in mM): 110 choline chloride, 2.5 KCl, 0.5 CaCl2, 7 MgCl2, 1.3NaH2PO4, 1.3 Na-ascorbate, 0.6 Na-pyruvate, 25 glucose, and 25 NaHCO3, saturated with 95% O2 and 5% CO2. Slices were incubated in 32 °C oxygenated artificial cerebrospinal fluid (ACSF) (in mM: 125 NaCl, 2.5 KCl, 2 CaCl2, 1.3 MgCl2, 1.3NaH2PO4, 1.3 Na-ascorbate, 0.6 Na-pyruvate, 25 glucose, and 25 NaHCO3) for at least one hour prior to recording. Slices were transferred to a recording chamber and superfused with 2 ml min−1 ACSF. Patch pipettes (2–5 Mohms) pulled from borosilicate glass (PG10150-4, World Precision Instruments) were filled with a Cs-based low Cl− internal solution containing (in mM): 135 CsMeSO3, 10 HEPES, 1 EGTA, 3.3 QX-314, 4Mg-ATP, 0.3 Na-GTP, 8 Na2-phosphocreatine, 290 mOsmkg−1, adjusted to pH 7.3 with CsOH. Whole-cell voltage-clamp recording was performed at room temperature (22-25 °C) with a Multiclamp 700B amplifier and a Digidata 1440A (Molecular Devices). Data were sampled at 10 KHz and analyzed with pClamp10 (Molecular Devices) or MATLAB (MathWorks). TdTomato-expressing D1-MSNs or eGFP-expressing D2-MSNs in the NAc were visualized using an upright fluorescent microscope (Olympus BX51WI). A blue LED (470 nm, Thorlabs) controlled by digital commands from the Digidata 1440A was coupled to the microscope with a dual lamp house adapter (5-UL180, Olympus) to deliver photostimulation. To record light-evoked EPSCs, 3-5 ms, 0.5-2 mW blue light was delivered through the objective to illuminate the entire field of view. To assess the efficiency of pharmacogenetic silencing of synaptic transmission, we first co-injected AAV-hM4Di and AAV-ChR2 into the PVT, then prepared NAc slices containing the ChR2 and hM4Di co-expressed terminals from the PVT. Light-evoked EPSCs were recorded from MSNs before and after perfusion with CNO (3 μM).
All experiments, except those in Extended Data Fig 3, were performed in the presence of picrotoxin (100 μM). For Extended Data Fig 3, picrotoxin or CNQX (10 μM) was perfused onto slices, and drug effects on light-evoked EPSCs/IPSCs were measured by recording traces before and 5 min after drug perfusion. Membrane potential was held at −70 mV to record AMPAR-mediated current, at 0 mV to record GABAA receptor-mediated IPSC or at +40 mV to record NMDAR-mediated current. Amplitude of NMDAR current was quantified at 50 ms after stimulus, when the contribution of the AMPAR component was minimal. AMPAR/NMDAR ratios were calculated by dividing the amplitude of the AMPAR current (peak current, at −70 mV) by the amplitude of the NMDAR current. The paired-pulse ratio (PPR) was calculated by dividing the second light-evoked EPSC by the first with 100 ms intervals between the two. The AMPAR current was recorded at three holding potentials (−70 mV, 0 mV, and +40 mV) in the presence of D-AP5 (50 μM). Rectification index (ir) of the AMPAR was calculated based on the following equation: ir= (I−70/70)/(I40/40), in which I−70 and I40were EPSC amplitudes recorded at −70 mV and +40 mV, respectively.
CTB tracing and c-Fos histology
2-5 days after bilaterally injection of CTB-488 (0.2 μl, 0.5% in PBS) (Invitrogen, C-22841) into the medial shell of the NAc (bregma 1.1 mm; lateral 0.8 mm; ventral 4.6 mm), mice underwent naloxone-precipitated withdrawal, spontaneous withdrawal, footshock, or LiCl treatment. 90 mins after the aversive stimuli, animals were deeply anaesthetized and perfused with 10ml of saline (0.9%) followed by 10 ml of 4% paraformaldehyde in PBS. Coronal brain sections (50 μm) were cut using a cryostat (Leica). Brain sections (between bregma - 1.2 mm to – 1.9 mm) were first washed in PBS (3 × 10 min) and then blocked at room temperature with 10% NDS/0.3% Triton X-100 (PBST), then incubated with primary anti-c-Fos antibody (Santa Cruz, SC-52G, rabbit polyclonal IgG, 1:2000 dilution) for 3 days at 4 °C. Brain sections were washed in PBS (3 × 10 min), followed by incubation for 2 hours with fluorophore-conjugated secondary antibody (1:1000 in 5% NDS PBST) and finally counterstained with Hoescht (1:10,000, ThermoFisher Scientific). Images were obtained using a Zeiss 510 confocal microscope or a Zeiss epifluorescence microscope, and analyzed by an individual blind to the identity of experimental groups.
Statistics
No statistics were used to predetermine sample size. However, our sample sizes were similar to those reported in previous publications7-9. Statistical methods were indicated when it used, and statistical analysis of main figures are provided in Extended Data Table 1. All analyses were performed using MATLAB (MathWorks) or Prism. No method of randomization was used in any of the experiments. For ANOVA analyses, the variances were similar as determined by Brown–Forsythe test. Experimenters were not blind to group allocation in behavioral experiments, but CPA sore and locomotion were measured automatically by custom tracking software running on MATLAB (MathWorks). All animals that finished the entire behavioral training and testing were included in analysis. Data are presented as mean ± s.e.m.
Extended Data
Extended Data Figure 1. Retrograde tracing with rabies virus labels brain areas innervating the NAc and naloxone-precipitated opiate withdrawal induces c-Fos expression in the PVT.
a, Representative images show the injection site in the medial shell of the NAc, and retrograde labeling with mCherry in the ventral hippocampus (vHipp), prelimbic cortex (PrL) and basolateral amygdala (BLA). b, Representative images show retrograde labeling with mCherry in the PVT, ranging from Bregma −0.4 mm to −2.2 mm. c, Distribution of the density of retrogradely labeled neurons in the PVT (n = 7). d, Representative images show c-Fos expression in the PVT induced by naloxone-precipitated opiate withdrawal. e, Distribution of the density of c-Fos expressing neurons in the PVT (n = 5). Area of the PVT at different A-P coordinates are determined based on the brain atlas published by Allen Institute for Brain Science (Available from: http://mouse.brain-map.org/experiment/thumbnails/100142143?image_type=atlas). Scale bar: 500 μm. Mean ± s.e.m.
Extended Data Figure 2. Optogenetic targeting of glutamatergic transmission between the PVT and the NAc.
a, A confocal image shows ChR2-eYFP expressing terminals from the PVT in the medial shell of the NAc. Inset, injection site in the PVT. Scale bar: 500 μm. b, Example traces (left) and quantification (right) of action potential firing evoked by light stimulation at different frequencies in ChR2-expressing PVT neurons (n = 7). Scale bar: 25 mV, 250 ms. c, Example traces (left) and quantification (right) of photo-evoked EPSCs recorded from the NAc before and after superfusion of CNQX (10 μM, n = 6). Scale bar: 50 pA, 25 ms. Wilcoxon signed-rank test, *p < 0.05. Mean ± s.e.m.
Extended Data Figure 3. Optogenetic activation of the PVT input evoked feed-forward inhibition onto MSNs in the NAc.
a, in situ hybridization with GAD1 (http://mouse.brain-map.org/gene/show/14191), GAD2 (http://mouse.brain-map.org/experiment/show/79591669) and vGlut2 (http://mouse.brain-map.org/experiment/show/73818754) in the PVT (©2014 Allen Institute for Brain Science). b,c, Superfusion of a GABAA receptor antagonist (Picrotoxin, 100 μM) selectively blocked IPSCs (b) (n = 4), whereas superfusion of an AMPAR antagonist (CNQX, 10 μM) blocked both IPSCs and EPSCs (c) (n = 5). Scale bar: 400 pA, 30 ms. d, Example trace (left) and quantification (right) of the onset latency for photo-evoked IPSCs and EPSCs in the same neuron (n = 20). Scale bar: 400 pA, 10 ms. Wilcoxon signed-rank test. *** p < 0.001. e, Averaged amplitude of photo-evoked IPSCs in D1-MSNs (n = 11) and D2-MSNs (n = 14). Mann–Whitney U-test, p = 0.67. Mean ± s.e.m.
Extended Data Figure 4. Location of ChR2, ArchT and hM4Di expression in the PVT.
a, Schematics showing the PVT and its surrounding brain nucleus from anterior to posterior locations. 3V, third ventricle; MD, mediodorsal thalamus; CM, central middle thalamus; DG, dentate gyrus; Hb, habenula; IMD, intermediodorsal thalamus. b, Overlay of ChR2-YFP expression in 21 mice, including 13 mice in Fig. 1d and 8 mice in Fig. 4g,h. c, Overlay of ArchT-YFP expression in 18 mice, including 10 mice in Fig. 2d and 8 mice in Extended Data Fig. 7c. d, Overlay of hM4Di-mCherry expression in 16 mice, including 8 mice in Fig. 2g and 8 mice in Extended Data Fig. 7d. Intensity of red color is proportional to the number of mice expressing virus in the marked area.
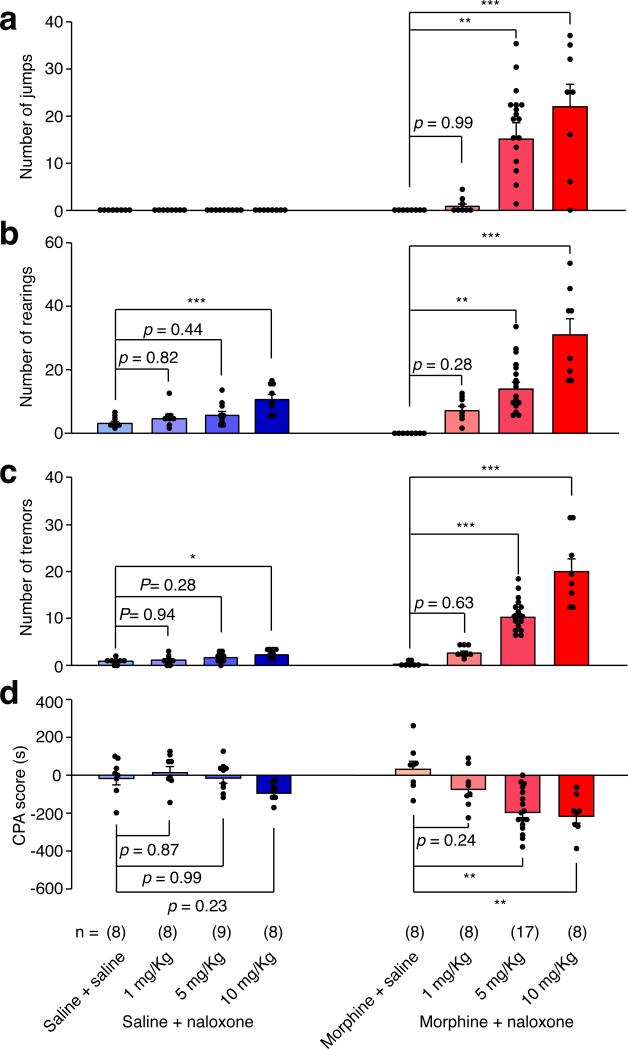
Extended Data Figure 5. Dose-response analysis of naloxone-precipitated withdrawal symptoms.
Concentration of naloxone was determined by 2 × 2 factorial design. Different doses of naloxone (0, 1, 5, 10 mg Kg−1) were injected in chronic saline (blue) or morphine (red) treated mice. Behavioral signs of withdrawal including jump (a), rearing (b) and tremor (c) were recorded for 20 min immediately after naloxone injection. CPA (d) tests were performed 24 hours after withdrawal. One-way ANOVA followed by Tukey's test. Jumping: Morphine + Naloxone group F(3,36) = 9.93, p < 0.0001; Rearing: Saline + Naloxone group F(3,36) = 7.07, p < 0.01; Morphine + Naloxone group F(3,36) = 22.98, p < 0.0001; Tremor: Saline + Naloxone group F(3,29) = 3.74, p < 0.05; Morphine + Naloxone group F(3,36) = 40.48, p < 0.0001; CPA: Saline + Naloxone group F(3,29) = 2.67, p = 0.066; Morphine + Naloxone group F(3,36) = 9.93, p < 0.0001; p values for post-hoc Tukey's test are indicated on each comparison pair. Mean ± s.e.m.
Extended Data Figure 6. Opiate withdrawal induced c-Fos expression in the PVTNAc projection neurons.
a, Example confocal image shows expression of c-Fos in a small number of PVTNAc projection neurons after injection of saline into chronic morphine treated mice. Left: scale bar, 100 μm; Right: magnified image shows the boxed area. Scale bar, 50 μm. b, Quantification of CTB (left) and c-fos (right) positive cells per mm2 after injection of saline (white bar, n = 5) or naloxone (gray bar, n = 6) into chronic morphine treated mice. c, Example confocal images show that spontaneous withdrawal from morphine (lower panel) but not saline (upper panel) treatment increases the expression of c-Fos in PVTNAc projection neurons. Left: scale bar, 100 μm; Right: magnified image shows the boxed area. Scale bar, 50 μm. d, Quantification of CTB (left) and c-fos (middle) positive cells per mm2 and percentage of PVTNAc projection neurons (right) that express c-Fos induced by spontaneous withdrawal from morphine (gray bar, n = 4) or saline (white bar, n = 4). Mann–Whitney U-test, *p < 0.05, **p < 0.01. Mean ± s.e.m.
Extended Data Figure 7. The PVT→NAc pathway is required for expression of behavioral aversion to footshock and LiCl injection.
a, Confocal images show robust expression of c-Fos (red) in the PVTNAc projection neurons (green) after footshock (upper panel) and LiCl injection (lower panel). Left: scale bar, 100 μm; Right: magnified image shows the boxed area. Scale bar, 50 μm. b, Quantification of CTB (left) and c-fos (middle) positive cells per mm2 and percentage of PVTNAc projection neurons (right) expressing c-Fos induced by footshock (white bar, n = 4) or LiCl injection (gray bar, n = 4). c, Light stimulation suppressed the expression of footshock-induced CPA in ArchT- (n = 8) but not eGFP- (n = 8) expressing mice. d, Local infusion of CNO reduced the expression of LiCl-induced CPA in hM4Di- (n = 8) but not eGFP- (n = 8) expressing mice. Mann–Whitney U-test, *p < 0.05, ** p < 0.01. Mean ± s.e.m.
Extended Data Figure 8. Effects of chronic morphine treatment and in vivo optogenetic LTD induction on the strength of AMPAR and NMDAR current in MSNs receiving input from the PVT or BLA.
a,b, In the PVT→NAc pathway, chronic morphine treatment specifically increases AMPAR but not NMDAR current on D2-MSNs (saline/morphine, n = 13/16 cells) but not D1-MSNs (saline/morphine, n = 14/14 cells). Two-way ANOVA (AMPAR: F(1,53) = 5.24, p < 0.05; NMDAR: F(1,53) = 0.04, p = 0.83) followed by Tukey's test, ** p < 0.01. c,d, In the BLA→NAc pathway, chronic morphine treatment increases both AMPAR current (c) and NMDAR current (d) on D1-MSNs (saline/morphine, n=14/13 cells) but not D2-MSNs (saline/morphine, n=13/12 cells). Two-way ANOVA (AMPAR: F(1,51) = 7.06, p < 0.05; NMDAR: F(1,51) = 0.35, p = 0.55) followed by Tukey's test, * P<0.05. e, Chronic morphine treatment has no effect on the AMPAR/NMDAR ratio in either D1-MSNs or D2-MSNs in the BLA→NAc pathway. Two-way ANOVA (F(1,51) = 7.06, p < 0.05). f,g, In the PVT→NAc pathway, in vivo optogenetic stimulation (4 ms, 1 Hz, 900 pulses) in morphine-treated mice specifically decreases AMPAR but not NMDAR current in D2-MSNs (morphine/morphine + 1 Hz, n = 16/17 cells) but not D1-MSNs (morphine/morphine + 1 Hz, n = 14/14 cells). Two-way ANOVA (AMPAR: F(1,57) = 4.24, p = 0.04; NMDAR: F(1,57) = 0.01, p = 0.92) followed by Tukey's test. * p < 0.05. Mean ± s.e.m.
Extended Data Figure 9. Chronic morphine treatment and in vivo optogenetic LTD induction does not affect paired-pulse ratio of MSNs receiving PVT input.
Example traces (a) and quantification (b) of paired-pulse ratio of photo-evoked EPSCs in D1- and D2-MSNs. An escalating regimen of morphine treatment and in vivo optogenetic stimulation (4 ms, 1 Hz, 900 pulses) in morphine-treated mice had no obvious effect on the paired-pulse ratio of MSNs receiving PVT input (Two-way ANOVA, F(2,35) = 0.02 p = 0.97). D1-MSNs: saline/morphine/morphine + 1 Hz, n = 9/7/6; D2-MSNs: saline/morphine/morphine + 1 Hz, n = 7/6/6. Scale bar: 200 pA, 50 ms. Mean ± s.e.m.
Extended Data Table 1.
| Figure | Groups (Ns refer to animals in behavior and c-fos experiments and cells in electrophysiology experiments) | Statistical Analysis |
|---|---|---|
| 1d (RTPP) | eGFP control (n = 8) ChR2 + saline (n = 10) ChR2 + NBQX (n = 8) ChR2 + D1R antagonist (n = 8) ChR2 + D2R antagonist (n = 8) |
One-way ANOVA: F(4, 37) = 29.61, p < 0.0001 Post-hoc Tukey's test: ChR2 + saline vs. GFP control, p < 0.001 ChR2 + saline vs. ChR2 + NBQX, p < 0.001 ChR2 + saline vs. ChR2 + D1R antagonist, p = 0.98 ChR2 + saline vs. ChR2 + D2R antagonist, p = 0.58 |
| 2c (c-fos) | Morphine + saline (n = 5) Morphine + naloxone (n = 6) |
Mann-Whitney U-test Morphine + saline vs. Morphine + naloxone, p < 0.01 |
| 2d (Behavioral signs) | eGFP control (n = 9) ArchT silencing (n = 10) |
Mann-Whitney U-test Jump: GFP vs. Arch, p < 0.001 Rearing: GFP vs. Arch, p < 0.01 Tremor: GFP vs. Arch, p < 0.001 |
| 2e (CPA) | eGFP control (n = 9) ArchT silencing (n = 10) |
Mann-Whitney U-test 1d CPA: GFP vs. Arch, p < 0.05 7d CPA: GFP vs. Arch, p < 0.05 |
| 2f (hM4Di silencing current) | Baseline (n = 5) CNO (n = 5) |
Wilcoxon signed-rank test Baseline vs. CNO, p < 0.05 |
| 2g (Spontaneous withdrawal) | eGFP + CNO (n = 8) hM4D + CNO (n = 8) hM4D + saline (n = 8) |
One-way ANOVA: F(2, 21) = 7.4, p < 0.01 Post-hoc Tukey's test: hM4D + CNO vs. GFP + CNO, p < 0.05 hM4D + CNO vs. hM4D + saline, p < 0.01 hM4D + saline vs. GFP + CNO, p = 0.55 |
| 2h (Locomotion) | eGFP control (n = 9) ArchT silencing (n = 9) |
Wilcoxon signed-rank test Saline: GFP vs. Arch, p = 0.57 Morphine: GFP vs. Arch, p = 0.5 |
| 3c (AN ratio) | Saline D1 (n = 14) Saline D2 (n = 13) Morphine D1 (n = 14) Morphine D2 (n = 16) |
Two-way factorial ANOVA Group (saline, morphine) × Cell (D1, D2) Group: F(1,53) = 17.01, p < 0.001 Cell: F(1,53) = 9.18, p < 0.01 Group × Cell: F(1,53) = 12.58, p < 0.001 Post-hoc Tukey's test: saline D1 vs morphine D1, p = 0.97 saline D2 vs morphine D2, p < 0.001 |
| 3e (Rectification index) | Saline D1 (n = 8) Saline D2 (n = 7) Morphine D1 (n = 9) Morphine D2 (n = 10) |
Two-way factorial ANOVA Group (saline, morphine) × Cell (D1, D2) Group: F(1,30) = 6.65, p < 0.05 Cell: F(1,30) = 4.32, p < 0.05 Group × Cell: F(1,30) = 9.87, p < 0.01 Post-hoc Tukey's test: saline D1 vs morphine D1, p = 0.97 saline D2 vs morphine D2, p < 0.01 |
| 4c (AN ratio) | Morphine D1 (n = 14) Morphine D2 (n = 16) Morphine + 1Hz, D1 (n = 14) Morphine + 1Hz, D2 (n = 17) |
Two-way factorial ANOVA Group (morphine, morphine + 1Hz) × Cell (D1, D2) Group: F(1,57) = 21.59, p < 0.0001 Cell: F(1,57) = 11.57, p < 0.01 Group × Cell: F(1,57) = 13.86, p < 0.001 Post-hoc Tukey's test: Morphine D1 vs morphine 1Hz D1, p = 0.97 Morphine D2 vs morphine 1 Hz D2, p< 0.001 |
| 4e (Rectification index) | morphine D1 (n = 9) morphine D2 (n = 10) depotentiation D1 (n = 7) depotentiation D2 (n = 10) |
Two-way factorial ANOVA Group (morphine, morphine 1Hz) × Cell (D1, D2) Group: F(1,32) = 5.12, p < 0.05 Cell: F(1,32) = 8.23, p < 0.01 Group × Cell: F(1,32) = 4.3, p < 0.05 Post-hoc Tukey's test: saline D1 vs morphine D1, p = 0.92 saline D2 vs morphine D2, p < 0.05 |
| 4g (Behavioral signs) | eGFP control (n = 8) ChR2 depotentiation (n = 8) |
Mann-Whitney U-test Jump: GFP vs. ChR2, p < 0.01 Rearing: GFP vs. ChR2, p < 0.01 Tremor: GFP vs. ChR2, p < 0.01 |
| 4h (CPA) | eGFP control (n = 8) ChR2 depotentiation (n = 8) |
Mann-Whitney U-test 1d CPA: GFP vs. ChR2, p < 0.05 7d CPA: GFP vs. ChR2, p < 0.01 |
Acknowledgments
We thank R.C. Malenka, K. Shen, L. Luo, T.R. Clandinin and members of the Chen laboratory for helpful comments on the manuscript. We thank M. Asaad, J. Charalel and X. Sun for tracing and behavior experiments. This work was supported by grants from The Whitehall Foundation, AIAP (Ajinomoto innovation alliance program), Terman Fellowship and start-up funding from Stanford University. G.N. is supported by a training grant from the National Institute on Drug Abuse (5T32DA035165-02).
Footnotes
Author Contributions:
X.K.C. conceived the study. Y.J.Z., G.N. and X.K.C. designed the experiments. Y.J.Z performed electrophysiology recording and analysis, Y.J.Z. and C.F.W conducted all other experiments. Y.J.Z. and X.K.C. analyzed behavioral data, C.F.W analyzed c-FOS and CTB tracing results. G.N., Y.J.Z. and X.K.C. wrote the manuscript.
References
- 1.Koob GF, LeMoal M. Drug abuse: Hedonic homeostatic dysregulation. Science. 1997;278:52–58. doi: 10.1126/science.278.5335.52. doi:DOI 10.1126/science.278.5335.52. [DOI] [PubMed] [Google Scholar]
- 2.Vargas-Perez H, Ting AKRA, Heinmiller A, Sturgess JE, van der Kooy D. A test of the opponent-process theory of motivation using lesions that selectively block morphine reward. Eur J Neurosci. 2007;25:3713–3718. doi: 10.1111/j.1460-9568.2007.05599.x. doi:10.1111/j.1460-9568.2007.05599.x. [DOI] [PubMed] [Google Scholar]
- 3.Wikler A. A theory of opioid dependence. NIDA Res Monogr. 1980;30:174–178. [PubMed] [Google Scholar]
- 4.Harris GC, Astonjones G. Involvement of D2 Dopamine-Receptors in the Nucleus-Accumbens in the Opiate Withdrawal Syndrome. Nature. 1994;371:155–157. doi: 10.1038/371155a0. doi:Doi 10.1038/371155a0. [DOI] [PubMed] [Google Scholar]
- 5.Koob GF, Wall TL, Bloom FE. Nucleus Accumbens as a Substrate for the Aversive Stimulus Effects of Opiate Withdrawal. Psychopharmacology. 1989;98:530–534. doi: 10.1007/BF00441954. doi:Doi 10.1007/Bf00441954. [DOI] [PubMed] [Google Scholar]
- 6.Pascoli V, et al. Contrasting forms of cocaine-evoked plasticity control components of relapse. Nature. 2014;509:459. doi: 10.1038/nature13257. doi:Doi 10.1038/Nature13257. [DOI] [PubMed] [Google Scholar]
- 7.Pascoli V, Turiault M, Luscher C. Reversal of cocaine-evoked synaptic potentiation resets drug- induced adaptive behaviour. Nature. 2012;481:71–U76. doi: 10.1038/nature10709. doi:Doi 10.1038/Nature10709. [DOI] [PubMed] [Google Scholar]
- 8.Britt JP, et al. Synaptic and Behavioral Profile of Multiple Glutamatergic Inputs to the Nucleus Accumbens. Neuron. 2012;76:790–803. doi: 10.1016/j.neuron.2012.09.040. doi:DOI 10.1016/j.neuron.2012.09.040. [DOI] [PMC free article] [PubMed] [Google Scholar]
- 9.Stuber GD, et al. Excitatory transmission from the amygdala to nucleus accumbens facilitates reward seeking. Nature. 2011;475:377–380. doi: 10.1038/nature10194. doi:Doi 10.1038/Nature10194. [DOI] [PMC free article] [PubMed] [Google Scholar]
- 10.Lim BK, Huang KW, Grueter BA, Rothwell PE, Malenka RC. Anhedonia requires MC4R- mediated synaptic adaptations in nucleus accumbens. Nature. 2012;487:183–189. doi: 10.1038/nature11160. doi:Doi 10.1038/Nature11160. [DOI] [PMC free article] [PubMed] [Google Scholar]
- 11.Wickersham IR, Finke S, Conzelmann KK, Callaway EM. Retrograde neuronal tracing with a deletion-mutant rabies virus. Nature Methods. 2007;4:47–49. doi: 10.1038/NMETH999. doi:Doi 10.1038/Nmeth999. [DOI] [PMC free article] [PubMed] [Google Scholar]
- 12.Sesack SR, Grace AA. Cortico-Basal Ganglia reward network: microcircuitry. Neuropsychopharmacology. 2010;35:27–47. doi: 10.1038/npp.2009.93. doi:10.1038/npp.2009.93. [DOI] [PMC free article] [PubMed] [Google Scholar]
- 13.Martin-Fardon R, Boutrel B. Orexin/hypocretin (Orx/Hcrt) transmission and drug-seeking behavior: is the paraventricular nucleus of the thalamus (PVT) part of the drug seeking circuitry? Frontiers in Behavioral Neuroscience. 2012;6:75. doi: 10.3389/fnbeh.2012.00075. doi:10.3389/fnbeh.2012.00075. [DOI] [PMC free article] [PubMed] [Google Scholar]
- 14.Browning JR, Jansen HT, Sorg BA. Inactivation of the paraventricular thalamus abolishes the expression of cocaine conditioned place preference in rats. Drug and Alcohol Dependence. 2014;134:387–390. doi: 10.1016/j.drugalcdep.2013.09.021. doi:DOI 10.1016/j.drugalcdep.2013.09.021. [DOI] [PMC free article] [PubMed] [Google Scholar]
- 15.James MH, et al. Cocaine- and Amphetamine-Regulated Transcript (CART) Signaling within the Paraventricular Thalamus Modulates Cocaine-Seeking Behaviour. Plos One. 2010;5 doi: 10.1371/journal.pone.0012980. doi:ARTN e12980 DOI 10.1371/journal.pone.0012980. [DOI] [PMC free article] [PubMed] [Google Scholar]
- 16.Boyden ES, Zhang F, Bamberg E, Nagel G, Deisseroth K. Millisecond-timescale, genetically targeted optical control of neural activity. Nature neuroscience. 2005;8:1263–1268. doi: 10.1038/nn1525. doi:Doi 10.1038/Nn1525. [DOI] [PubMed] [Google Scholar]
- 17.Chow BY, et al. High-performance genetically targetable optical neural silencing by light-driven proton pumps. Nature. 2010;463:98–102. doi: 10.1038/nature08652. doi:Doi 10.1038/Nature08652. [DOI] [PMC free article] [PubMed] [Google Scholar]
- 18.Vanderschuren LJ, et al. Morphine-induced long-term sensitization to the locomotor effects of morphine and amphetamine depends on the temporal pattern of the pretreatment regimen. Psychopharmacology (Berl) 1997;131:115–122. doi: 10.1007/s002130050273. [DOI] [PubMed] [Google Scholar]
- 19.Bechara A, Nader K, van der Kooy D. Neurobiology of withdrawal motivation: evidence for two separate aversive effects produced in morphine-naive versus morphine-dependent rats by both naloxone and spontaneous withdrawal. Behav Neurosci. 1995;109:91–105. doi: 10.1037//0735-7044.109.1.91. [DOI] [PubMed] [Google Scholar]
- 20.Stachniak TJ, Ghosh A, Sternson SM. Chemogenetic synaptic silencing of neural circuits localizes a hypothalamus-->midbrain pathway for feeding behavior. Neuron. 2014;82:797–808. doi: 10.1016/j.neuron.2014.04.008. doi:10.1016/j.neuron.2014.04.008. [DOI] [PMC free article] [PubMed] [Google Scholar]
- 21.Armbruster BN, Li X, Pausch MH, Herlitze S, Roth BL. Evolving the lock to fit the key to create a family of G protein-coupled receptors potently activated by an inert ligand. Proc Natl Acad Sci U S A. 2007;104:5163–5168. doi: 10.1073/pnas.0700293104. doi:10.1073/pnas.0700293104. [DOI] [PMC free article] [PubMed] [Google Scholar]
- 22.Williams JT, Christie MJ, Manzoni O. Cellular and synaptic adaptations mediating opioid dependence. Physiol Rev. 2001;81:299–343. doi: 10.1152/physrev.2001.81.1.299. [DOI] [PubMed] [Google Scholar]
- 23.Hyman SE, Malenka RC, Nestler EJ. Neural mechanisms of addiction: the role of reward- related learning and memory. Annu Rev Neurosci. 2006;29:565–598. doi: 10.1146/annurev.neuro.29.051605.113009. doi:10.1146/annurev.neuro.29.051605.113009. [DOI] [PubMed] [Google Scholar]
- 24.Kravitz AV, Tye LD, Kreitzer AC. Distinct roles for direct and indirect pathway striatal neurons in reinforcement. Nature neuroscience. 2012;15:816–U823. doi: 10.1038/nn.3100. doi:Doi 10.1038/Nn.3100. [DOI] [PMC free article] [PubMed] [Google Scholar]
- 25.Lobo MK, et al. Cell Type-Specific Loss of BDNF Signaling Mimics Optogenetic Control of Cocaine Reward. Science. 2010;330:385–390. doi: 10.1126/science.1188472. doi:DOI 10.1126/science.1188472. [DOI] [PMC free article] [PubMed] [Google Scholar]
- 26.Schwartz N, et al. Decreased motivation during chronic pain requires long-term depression in the nucleus accumbens. Science. 2014;345:535–542. doi: 10.1126/science.1253994. doi:DOI 10.1126/science.1253994. [DOI] [PMC free article] [PubMed] [Google Scholar]
- 27.Conrad KL, et al. Formation of accumbens GluR2-lacking AMPA receptors mediates incubation of cocaine craving. Nature. 2008;454:118–U119. doi: 10.1038/nature06995. doi:Doi 10.1038/Nature06995. [DOI] [PMC free article] [PubMed] [Google Scholar]
- 28.Lee BR, et al. Maturation of silent synapses in amygdala-accumbens projection contributes to incubation of cocaine craving. Nature neuroscience. 2013;16:1644–1651. doi: 10.1038/nn.3533. doi:Doi 10.1038/Nn.3533. [DOI] [PMC free article] [PubMed] [Google Scholar]
- 29.Creed M, Pascoli VJ, Luscher C. Addiction therapy. Refining deep brain stimulation to emulate optogenetic treatment of synaptic pathology. Science. 2015;347:659–664. doi: 10.1126/science.1260776. doi:10.1126/science.1260776. [DOI] [PubMed] [Google Scholar]
- 30.Stamatakis AM, Stuber GD. Activation of lateral habenula inputs to the ventral midbrain promotes behavioral avoidance. Nature neuroscience. 2012;15:1105–1107. doi: 10.1038/nn.3145. doi:10.1038/nn.3145. [DOI] [PMC free article] [PubMed] [Google Scholar]
- 31.Tye KM, et al. Amygdala circuitry mediating reversible and bidirectional control of anxiety. Nature. 2011;471:358–362. doi: 10.1038/nature09820. doi:10.1038/nature09820. [DOI] [PMC free article] [PubMed] [Google Scholar]
- 32.Yasoshima Y, Scott TR, Yamamoto T. Differential activation of anterior and midline thalamic nuclei following retrieval of aversively motivated learning tasks. Neuroscience. 2007;146:922–930. doi: 10.1016/j.neuroscience.2007.02.044. doi:10.1016/j.neuroscience.2007.02.044. [DOI] [PubMed] [Google Scholar]
- 33.Wolff SB, et al. Amygdala interneuron subtypes control fear learning through disinhibition. Nature. 2014;509:453–458. doi: 10.1038/nature13258. doi:10.1038/nature13258. [DOI] [PubMed] [Google Scholar]
- 34.Ren J, et al. Habenula “cholinergic” neurons co-release glutamate and acetylcholine and activate postsynaptic neurons via distinct transmission modes. Neuron. 2011;69:445–452. doi: 10.1016/j.neuron.2010.12.038. doi:10.1016/j.neuron.2010.12.038. [DOI] [PubMed] [Google Scholar]
- 35.Petreanu L, Huber D, Sobczyk A, Svoboda K. Channelrhodopsin-2-assisted circuit mapping of long-range callosal projections. Nature neuroscience. 2007;10:663–668. doi: 10.1038/nn1891. doi:Doi 10.1038/Nn1891. [DOI] [PubMed] [Google Scholar]


