Abstract
The simultaneous detection of multiple enzyme activities can improve the specificity of disease diagnoses. We have synthesized and characterized a diamagnetic CEST MRI contrast agent that can simultaneously detect two enzyme activities. Sulfatase and esterase enzymes cleaved the ligands of the CEST agent, to release salicylic acid that was detected with CEST MRI. Importantly, both enzymes were required to activate the agent to produce a CEST MRI contrast, and the CEST agent was stable without enzyme treatment. These results have established that this diamagnetic CEST MRI contrast agent is a platform technology with a modular design that can be potentially exploited to detect other combinations of enzyme activities, which can expand the armamentarium of contrast agents for molecular imaging.
Keywords: imaging agents, enzyme catalysis, exchange interactions, hydrogen bonds
Graphical Abstract
Noninvasive detection of multiple biomarkers has advantages for improving precision medicine, especially for improving the diagnostic specificity of notoriously heterogeneous diseases such as cancer.[1] The detection of enzyme activity can be used as a biomarker for disease diagnosis, especially when detected in vivo where conditions that impact catalytic rates of enzyme activities are most relevant.[2] However, the simultaneous detection of multiple enzyme activities is a daunting challenge. To date, multiplexed detection of enzyme activities has only been demonstrated with fluorescence imaging[3], but the nonspecific light absorbance and scattering within in vivo tissues has limited this technique to surface-accessible tissues, in vitro analyses, and ex vivo histopathology.[4] Multiplexed detection of enzyme activities has not been previously demonstrated with other in vivo imaging modalities.
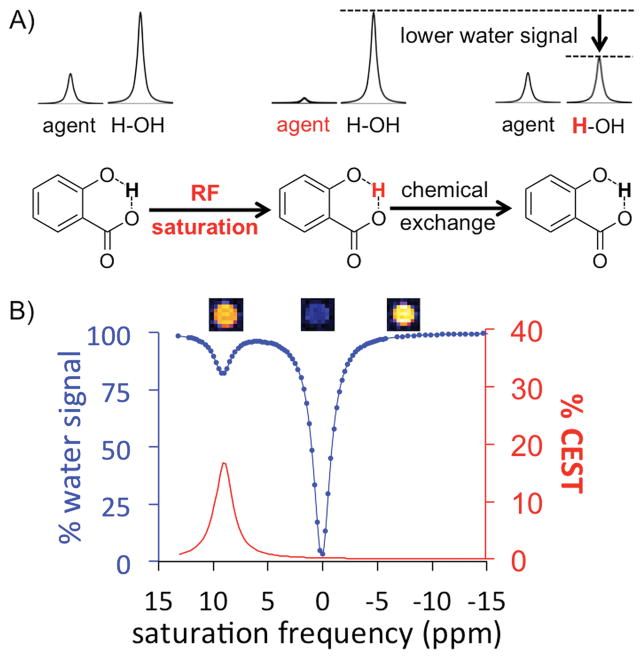
Magnetic resonance imaging (MRI) has advantages of interrogating tissues throughout entire animal models and patients, without using ionizing radiation, and with multiple types of image contrast mechanisms.[5] In particular, a new type of MRI contrast generated by Chemical Exchange Saturation Transfer (CEST) can be exploited for molecular imaging.[6] CEST MRI first involves the selective saturation of the coherent magnetic resonance of an exchangeable proton on a contrast agent. This specific saturation eliminates the net magnetization of the proton pool, thus eliminating the detectable MR signal (Figure 1, first step). After chemical exchange of the saturated proton from the agent to water, the reduced magnetization effect is transferred to the water pool, causing a decrease in total water MR signal (Figure 1, second step). Continuous saturation at the MR frequency of the agent’s labile proton can build a large population of saturated water protons, which improves detection sensitivity.
Figure 1.
Mechanism of CEST MRI. A) Radio frequency saturation of the proton “trapped” between the two oxygens of salicylic acid results in the loss of the MRI signal from this proton. After exchanging this saturated proton with a proton on water, some of the MRI signal of water is lost, which can be measured with MRI.5 B) A CEST spectrum of 25 mM salicylic acid shows a CEST signal at 9.25 ppm. MR images of the sample are shown above the CEST spectrum, showing the decreased MR signal with selective saturation applied at 9.25 ppm relative to −9.25 ppm as a reference, and almost no MRI signal with selective saturation applied at 0 ppm. The CEST spectrum was obtained with a 5 s, 5 μT saturation pulse using a 7T MRI instrument at 37 °C.
We have previously designed CEST MRI contrast agents that detect enzyme activity, and we have tailored CEST MRI acquisition and analysis methods that detect enzyme activities both in vitro[7] and in vivo.[8] The field of “catalyCEST MRI” has been used to detect enzyme-mediated catalysis of caspase-3,[7] urokinase Plasminogen Activator,[8,9] cathepsin B,[10] cathepsin D,[11] transglutaminase,[12] β-galactosidase,[13] esterase,[14] protein kinase A,[15] and cytosine deaminase[16] enzymes. In some cases, we and others have developed diamagnetic catalyCEST agents that do not require a potentially toxic metal ion, which facilitates clinical translation.[10,15,16] Despite this progress, catalyCEST MRI has not yet been developed to simultaneously respond to multiple enzyme activities. Therefore, we sought to develop a diamagnetic catalyCEST agent that could detect the activity of two enzymes, and would otherwise not generate CEST MRI contrast without the enzymes or with only one enzyme.
Our CEST agent is based on the structure of salicylic acid (Figure 1), which has a hydroxyl proton that is hydrogen bonded to the adjacent carboxylate moiety.[17] This “trapping” with hydrogen bonding slows the proton’s rate of chemical exchange from the agent to water to ~600 Hz (depending on pH), which is sufficiently slow to generate CEST MRI contrast. The hydrogen bond to the carboxylate, along with the electron density of the conjugated ring, causes the hydroxyl proton to be highly deshielded, generating a large MR chemical shift of 9.25 ppm relative to the chemical shift of water (which is referenced to 0 ppm for MRI studies). This large chemical shift facilitates selective saturation of the MR resonance of this hydroxyl proton of salicylic acid while avoiding direct saturation of the MR resonance of water.
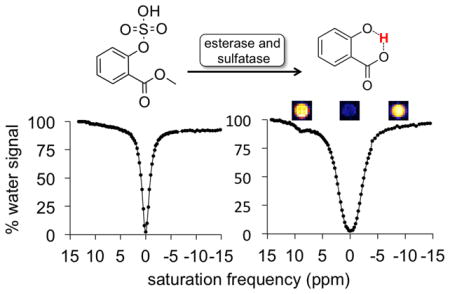
We proposed to remove the ability of salicylic acid to generate CEST MRI contrast by incorporating a sulfate group that replaces the hydroxyl group’s proton (Figure 2). We also proposed to increase the chemical exchange rate of the hydroxyl group’s proton to eliminate CEST MRI contrast by incorporating an ester group that should reduce the hydrogen bond strength. We rationalized that sulfatase and esterase could then catalyze the cleavage of the aryl sulfate and ester groups, respectively. This dual enzyme activity would yield salicylic acid and recover the CEST MRI contrast. Both enzyme-catalyzed reactions would be needed to produce salicylic acid, and only one enzyme reaction would be insufficient to recover the strongly hydrogen-bonded hydroxyl proton.
Figure 2.
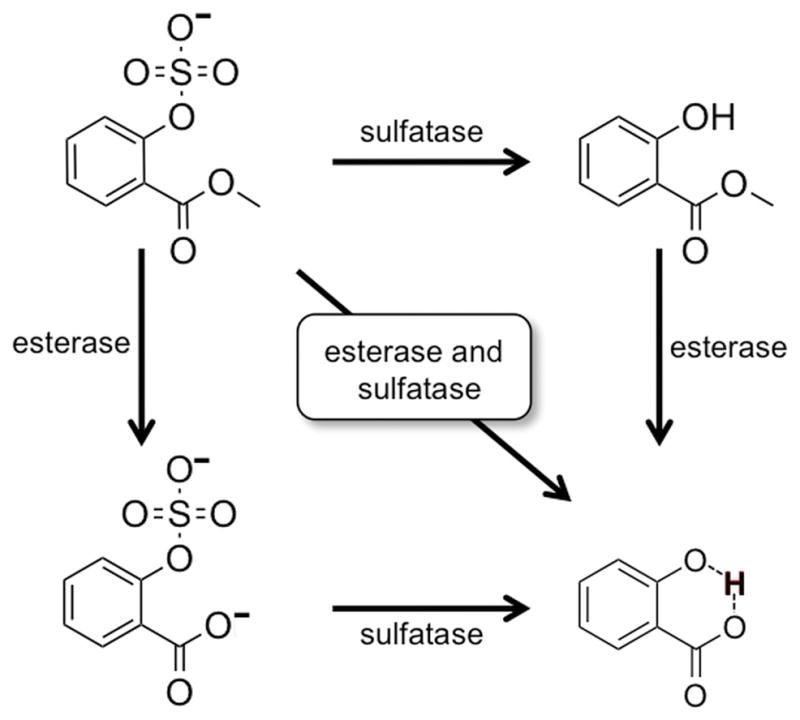
Enzymatic activation of CEST MRI contrast agent with sulfatase and esterase. The agent is designed to be converted to salicylic acid only after serial treatment with each enzyme, or simultaneous treatment with both enzymes.
Compound 4 was synthesized following a straightforward route based on previously reported procedures (Scheme 1; details are provided in the Experimental Section).[18] The final compound was obtained first through esterification of salicylic acid to produce methyl salicylate 2. We then used chlorosulfuric acid 2,2,2-trichloroethyl ester as the sulfation reagent, and in the last step deprotection of the TCE sulfate led to conversion of the desired product. Intermediate and final compounds were characterized with 1H and 13C NMR spectroscopy and electrospray ionization mass spectrometry (ESIMS). This procedure obtained the final compound with an overall yield of 26%.
Scheme 1.
Synthesis of catalyCEST MRI agent 4 with an overall yield of 26%.
A 25 mM solution of agent 4 in 200 μL of 1x PBS buffer was treated with approximately 10 units of esterase or 1 unit of sulfatase. The samples were incubated at 37 °C for 24 hours. After performing the CEST MRI measurements described below, the solution was treated with the other enzyme in the same conditions. An additional sample of the agent was simultaneously treated with both enzymes incubated at 37 °C for 24 hours. For all reactions, the pH was adjusted immediately after the addition of enzyme to be pH 7.16 to 7.25. During each reaction, there was no evidence of precipitation of the agent or degradation of the enzyme. In all cases, the pH remained within 0.2 units, which would only have a minor effect on the amplitude of the CEST signal that can be generated from salicylic acid.[17] After each enzyme-mediated reaction, the identity of the product was confirmed with ESIMS.
CEST MRI studies were performed with agent 4 before treatment with enzymes, after treatment with sulfatase or esterase, after serial treatment with both enzymes in either order, and after simultaneous treatment with both enzymes. The results are reported as CEST spectra (also known as Z spectra), which show the normalized water signal as a function of selective saturation frequency (Figure 1B).[19] The water signal was greatly suppressed when selective radio frequency saturation was applied at the chemical shift of water. The water signal was partially suppressed when selective saturation was applied at the frequency corresponding to the chemical shift of an exchangeable proton. In this case, we observed the appearance of a CEST effect at 9.25 ppm corresponding to the selective saturation of the exchangeable proton of salicylic acid after enzyme cleavage of both protecting groups.
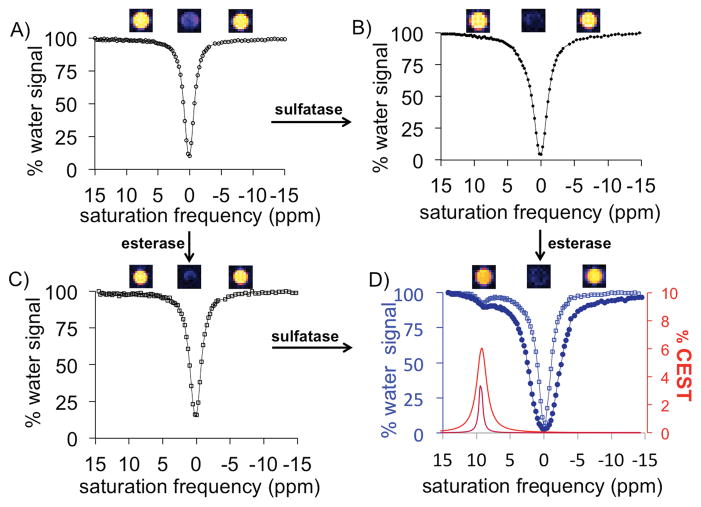
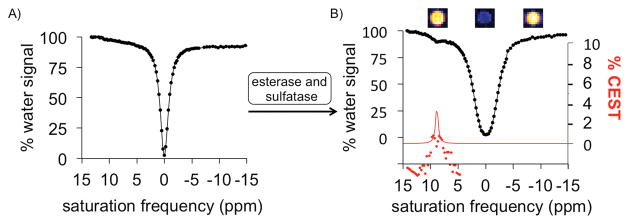
Before treatment with enzymes, the dual-blocked agent did not generate a CEST signal, and only evidence of the direct saturation of water was present in the CEST spectrum (Figure 3). After treatment with one enzyme, the agent had only one protecting group and still did not generate CEST MRI contrast. After treatment with the second enzyme, a signal appeared at 9.25 ppm in the CEST spectrum, which was assigned to the hydroxyl proton of salicylic acid. Similarly, simultaneous treatment with both enzymes caused the dual-protected CEST agent to generate a CEST signal at 9.25 ppm (Figure 4). We then fit a sum of Lorentzian line shapes to the CEST spectrum of the deprotected salicylic acid product. Notably, the large 9.25 ppm chemical shift difference between the labile proton of salicylic acid and water aided in quantitatively fitting CEST spectra with Lorentzian line shapes and further justified the use of salicylic acid as the base structure for our agent.[20] These Lorentzian line fittings conclusively demonstrated that the CEST agent detected the sequential and simultaneous activities of both enzymes.
Figure 3.
CEST MRI studies of serial enzyme treatments. A) The agent 4 with two protecting groups showed no CEST signal before treatment with enzymes, and only the decrease in water signal from saturation at the MR frequency of water (0 ppm) was observed. After treatment with B) sulfatase enzyme or C) esterase enzyme, the CEST agent had only one protecting group yet still could not generate a CEST signal. D) Treatment with the second enzyme produced the salicylic acid product that generated a CEST signal at 9.25 ppm. The spectra of the reaction derived from panel B is shown as dark blue, closed circles and a dark red Lorentzian line shape, and the spectra of the reaction derived from panel C is shown as light blue, open squares and a light red Lorentzian line shape. MR images are shown above each CEST spectrum.
Figure 4.
CEST MRI studies of simultaneous enzyme treatment. Simultaneous treatment with esterase and sulfatase enzymes converted A) the agent 4 that generated no CEST signal, B) to salicylic acid generated a CEST signal at 9.25 ppm. MR images are shown above CEST spectrum of the product. The red line represents the Lorentzian line shape of the CEST signal and the red circles represent the residuals of the fitting. The residuals are negligible around the center of the CEST signal, showing that Lorentzian line shape fitting is accurate for estimating CEST signal amplitude. The significant residuals around the “wings” of the Lorentzian line shape indicate that the CEST signal is not a true Lorentzian line shape, which agrees with a previous report.[20]
Additional control studies were performed to assess stability and ensure that enzyme catalysis was required to cleave the ester and sulfate moieties of the contrast agent. These studies were performed with no enzyme at room temperature and at 37 °C, and were monitored for 8 days with CEST MRI. No CEST signal was observed in CEST spectra from any sample. Stability studies were also performed with each individual enzyme reaction, to investigate whether intermediate products after a single enzyme catalysis would decompose to salicylic acid with time. Again, no CEST signal was observed in any CEST spectrum. Evidence for enzyme degradation was detected after 3 days, based on the appearance of a very broad CEST signal at 1–3 ppm, which corresponds to the chemical shifts of free amino acids and mobile, short peptides.[21] Therefore, the agent 4 has excellent stability with no CEST signal observed after long-term treatment with one enzyme or with long-term studies with no enzyme.
The simultaneous detection of sulfatase and esterase activities has potential applications for improved cancer diagnosis. Some tumor cells can secrete a high level of sulfatase enzymes into the extracellular microenvironment.[22] These tumors can be hypoxic, which is an attractive environment for anaerobic microorganisms that excrete esterases.[23] Therefore, the simultaneous detection of sulfatase and esterase activities can provide a more specific diagnosis of some types of tumors. This level of specificity can potentially impact precision medicine and improve decision support regarding treatment options.
Our contrast agent for the dual detection of sulfatase and esterase enzymes was designed to show that both the carboxylate and the hydroxyl group of salicylic acid can each be exploited to detect enzyme activity. This demonstration indicates that other ligands for biologically relevant enzymes can be used to block these moieties and similarly control the generation of a CEST signal. Examples include a phosphate group that can be cleaved by phosphatase, a peptide that can be cleaved by a protease, or a sugar that can be cleaved by a carbohydrase. Furthermore, we and others have previously demonstrated that ligands can be conjugated to other positions of the ring of salicylic acid, which expands the flexibility of incorporating additional ligands onto the agent for simultaneous dual- or even tri-enzyme detection.[10,24] Therefore, this demonstration of dual-enzyme detection with catalyCEST MRI represents a platform technology that can be potentially modified to detect other combinations of enzyme activities.
In conclusion, we have demonstrated a facile design of a catalyCEST MRI contrast agent that can simultaneously detect the activities of two enzymes. The agent did not degrade to produce salicylic acid without enzymes or with only one enzyme. The use of a diamagnetic agent avoids toxicities encountered with paramagnetic agents that contain lanthanide metals, while the use of MRI can provide outstanding coverage of entire animal models and patients at excellent spatial resolution. The flexibility of this approach provides many opportunities to simultaneously detect the activities of other combinations of enzymes, indicating that additional studies are warranted to further develop catalyCEST MRI for clinical translation.
Experimental Section
General synthesis and characterization
The CEST agent was synthesized using previously reported methods.[18] Compounds were analyzed with 1H and 13C NMR spectroscopic methods using a fully automated Bruker Avance-III 400MHz NMR spectrometer. The final product was confirmed with low-resolution electrospray ionization (LRMS (ESI negative mode)) mass spectroscopy analysis recorded on a Bruker 9.4 T Apex-Qh hybrid Fourier transfer ion-cyclotron resonance (FT-ICR) instrument. All compounds where purified by flash column chromatography when needed.
Methyl 2-hydroxybenzoate (2)
Salicylic acid 1 (7.24 mmol) was dissolved in 5 mL of MeOH and 3 drops of concentrated sulfuric acid were added. The reaction mixture was stirred overnight at 80 °C. After cooling to room temperature, the mixture was poured into an aqueous solution of NaHCO3 and the organic layer was separated. The aqueous layer was extracted three times with DCM and the combined organic layers were dried over MgSO4, filtered and concentrated under reduced pressure. (1.07 g, colorless oil, 98% yield)
1H NMR (CDCl3, 400 MHz) δ 10.75 (brs, 1H), 7.83 (dd, J = 4.0 Hz, 8.0 Hz 1H), 7.46 (appt, J = 4.0 Hz, 8.0 Hz, 1H), 7.68 (dd, J = 4.0 Hz, 8.0 Hz, 1H), 6.88 (appt, J = 4.0 Hz, 8.0 Hz, 1H), 3.96 (s, 3H). 13C NMR (CDCl3, 100 MHz) 170.6, 161.6, 135.7, 129.9, 119.1, 117.6, 112.4, 52.3
Methyl 2-(((2,2,2-trichloroethoxy)sulfonyl)oxy)benzoate (3)
Compound 2 (4.27 mmol), DMAP (1 equiv, 0.5223 g) and triethylamine (1.2 equiv, 0.7150 mL) were dissolved in THF (8.5 mL), cooled to −10 °C and 2,2,2-trichloroethyl sulfurochloridate was slowly added. After stirring for 3 hours at room temperature, the reaction mixture was diluted with ethyl acetate and washed with water once, with 0.5 M HCl twice and with brine. The organic layer was dried over MgSO4, filtered and concentrated under reduced pressure to obtain the crude which was purified by SiO2 column chromatography (7:3 Hexanes/EtOAc). (0.28 g, light yellow powder, 28% yield)
1H NMR (CDCl3, 400 MHz) δ 8.03 (d, J = 8.0 Hz, 1H), 7.62 (appt, J = 8.0 Hz, 1H), 7.53 (dd, J = 8.00 Hz, 1H), 7.43 (cd, J = 4.00 Hz, 8.00 Hz, 1H), 4.98 (s, 2H), 3.96 (s, 3H). 13C NMR (CDCl3, 100 MHz) 164.3, 148.6, 134.0, 132.4, 127.8, 124.0, 122.8, 92.5, 80.6, 52.6
Methyl 2-(sulfooxy)benzoate (4)
TCE protected sulfate 3 (0.7684 mmol) was dissolved in dry MeOH (8 mL) and reacted with Pd/C (10 m%) and HCOONH4 (6 equiv/TCE 3). After stirring for 6 hours at room temperature, the reaction mixture was filtered over celite and concentrated under reduced pressure. The resulting crude was then triturated with DCM and EtOAc. The desired product was obtained after filtering over a short plug of SiO2 eluting with DCM/MeOH/NH4OH (10:4:1). (0.17 g, yellow crystalline solid, 93% yield)
1H NMR (DMSO, 400 MHz) δ 7.55 (d, J = 8.0 Hz, 1H), 7.46 (m, 2H), 7.12 (appt, J = 8.00 Hz, 1H), 3.75 (s, 3H). 13C NMR (DMSO, 100 MHz) 166.5, 151.8, 132.0, 129.6, 124.5, 122.7, 122.2, 51.8. LRMS (ESI) m/z: calcd for C8H8O6S−: 230.20; found: 230.996 [M−]
Enzyme reactions
Samples were prepared in phosphate buffer (1x strength) and maintained at a pH of 7.16 to 7.25. The substrate concentration was 25 mM for all samples and enzyme reactions. Temperature was adjusted to 37 °C for 24-hour incubation and for image acquisition. Sulfatase from Aerobacter aerogenes and esterase from porcine liver were purchased from Sigma Aldrich. A total of approximately 1 and 10 units of each enzyme, respectively, were used for the enzymatic reactions. Samples were analyzed after enzyme reactions with reverse phase LC-MS (Shimadzu Corp.)
CEST MRI acquisition protocol
MRI studies were performed with a preclinical Bruker Biospec MRI scanner operating at 7T (300 MHz) magnetic field strength and processed using ParaVision 5.1 software. A CEST-FISP acquisition protocol was used for all CEST MRI studies.[25] We aqcuired a series of 96 images after selective saturation was applied using a continuous wave pulse at 5 μT power for 5 s with frequencies ranging from 15 to −15 ppm. FISP acquisition parameters included TR: 3.196 ms; TE: 1.598 ms; excitation flip angle: 30°; number of averages: 1; matrix: 128x128; field of view: 8x8 cm; in-plane spatial resolution: 625x625 mm; slice thickness: 1 mm. The temporal resolution of acquiring one image with one selective saturation frequency was 5.44 s.
Analysis of CEST spectra
A region of interest in the sample was selected from the acquired image to generate the CEST spectrum. To measure CEST signal amplitudes, the spectrum was analyzed by fitting two Lorenztian line shapes to account for the direct saturation of water and the CEST signal at 9.25 ppm.[20] The center, width and amplitude of each Lorenzian line shape were allowed to change to optimize the fit. The Lorentzian line shape fitting automatically referenced the bulk water chemical shift at 0 ppm, negating the effect of B0 inhomogeneities in the CEST MR images. The larger residuals around the “wings” of the CEST signal show that this signal profile is not a perfect Lorentzian line shape, which agrees with a previous report.[20] However, the small residuals around the center of the CEST signal demonstrate excellent fitting, and therefore this analysis method can still accurately measure CEST signal amplitude.
Acknowledgments
The authors thank Edward A. Randtke, Kyle M. Jones, and Kirsten A. Tucker for helpful interactions. Gabriela Fernández-Cuervo is a Howard Hughes Medical Institute Gilliam Fellow also supported by the Biological Chemistry Program Training Grant: T32 GM008804. This research study was also funded by the NIH through grant R01 CA169774 and P01 CA95060.
References
- 1.Chen JJ, Lu TP, Chen YC, Lin WJ. Biomarkers Med. 2015 Epub ahead of print. [Google Scholar]
- 2.Edwards D, Hoyer-Hansen G, Blasi F, Sloane B, editors. The Cancer Degradome. Springer Science; New York: 1998. [Google Scholar]
- 3.Rao J, Dragulescu-Andrasi A, Yao H. Curr Opin Biotech. 2007;18:17–25. doi: 10.1016/j.copbio.2007.01.003. [DOI] [PubMed] [Google Scholar]
- 4.Leblond F, Davis SC, Valdés PA, Pogue BW. J Photochem Photobiol B. 2010;98:77–94. doi: 10.1016/j.jphotobiol.2009.11.007. [DOI] [PMC free article] [PubMed] [Google Scholar]
- 5.Haake EM, Brown RW, Thompson MR, Venkatesan R, editors. Magnetic Resonance Imaging: Physical Principles and Sequence Design. Wiley & Sons; New York: 1999. [Google Scholar]
- 6.Liu G, Song X, Chan KWY, McMahon MT. NMR Biomed. 2013;26:810–828. doi: 10.1002/nbm.2899. [DOI] [PMC free article] [PubMed] [Google Scholar]
- 7.Yoo B, Pagel MD. J Am Chem Soc. 2006;128:14032–14033. doi: 10.1021/ja063874f. [DOI] [PubMed] [Google Scholar]
- 8.Yoo B, Sheth VR, Howison CM, Douglas MJK, Pineda CT, Maine EA, Baker AF, Pagel MD. Mag Reson Med. 2014;71:1221–1230. doi: 10.1002/mrm.24763. [DOI] [PMC free article] [PubMed] [Google Scholar]
- 9.Yoo B, Sheth VR, Pagel MD. Tet Lett. 2009;50:4459–4462. doi: 10.1016/j.tetlet.2009.05.061. [DOI] [PMC free article] [PubMed] [Google Scholar]
- 10.Hingorani DV, Montano LA, Randtke EA, Lee YS, Cárdenas-Rodríguez J, Pagel MD. Contrast Media Molec Imaging. 2015 doi: 10.1002/cmmi.1672. accepted for publication. [DOI] [PMC free article] [PubMed] [Google Scholar]
- 11.Suchy M, Ta R, Li A, Wojciechowski F, Pasternak SH, Bartha R, Hudson RHE. Org Biomolec Chem. 2010;8:2560–2566. doi: 10.1039/b926639a. [DOI] [PubMed] [Google Scholar]
- 12.Hingorani DV, Randtke EA, Pagel MD. J Am Chem Soc. 2013;135:6396–6398. doi: 10.1021/ja400254e. [DOI] [PMC free article] [PubMed] [Google Scholar]
- 13.Chauvin T, Durand P, Bernier M, Meudal H, Doan BT, Noury F, Badet B, Beloeil JC, Tóth E. Angew Chemie Int Ed. 2008;47:4370–4372. doi: 10.1002/anie.200800809. [DOI] [PubMed] [Google Scholar]
- 14.Li Y, Sheth VR, Liu G, Pagel MD. Contrast Media Molec Imaging. 2011;6:219–228. doi: 10.1002/cmmi.421. [DOI] [PMC free article] [PubMed] [Google Scholar]
- 15.Airan RD, Bar-Shir A, Liu G, Pelled G, McMahon MT, van Zijl PCM, Bulte JWM, Gilad AA. Magn Reson Med. 2012;68:1919–1923. doi: 10.1002/mrm.24483. [DOI] [PMC free article] [PubMed] [Google Scholar]
- 16.Liu G, Liang Y, Bar-Shir AA, Chan KWYC, Galpoththawela CS, Bernard SM, Tse T. J Am Chem Soc. 2011;133:16326–16329. doi: 10.1021/ja204701x. [DOI] [PMC free article] [PubMed] [Google Scholar]
- 17.Yang X, Song X, Li Y, Liu G, Banerjee SR, Pomper MG, McMahon MT. Angew Chemie Int Ed. 2013;52:8116–8119. doi: 10.1002/anie.201302764. [DOI] [PMC free article] [PubMed] [Google Scholar]
- 18.Mikula H, Sohr B, Skrinjar P, Weber J, Hametner C, Brethiller F, Krska R, Adam G, Frohlich J. Tet Lett. 2013;54:3290–3293. [Google Scholar]
- 19.Bryant RG. Annu Rev Biophys Biomol Struct. 1996;25:29–53. doi: 10.1146/annurev.bb.25.060196.000333. [DOI] [PubMed] [Google Scholar]
- 20.Sheth VR, Liu G, Li Y, Pagel MD. Contrast Media Molec Imaging. 2012;7:26–34. doi: 10.1002/cmmi.460. [DOI] [PMC free article] [PubMed] [Google Scholar]
- 21.Lee JS, Xia D, Jerschow A, Regatte RR. Contrast Media Molec Imaging. 2015 doi: 10.1002/cmmi.1652. Epub ahead of print. [DOI] [PMC free article] [PubMed] [Google Scholar]
- 22.Morimoto-Tomita M, Uchimura K, Rosen SD. Trends Glycosci Glycotech. 2003;15:159–164. [Google Scholar]
- 23.Chatzinikolaou I, Abi-Said D, Bodey GP, Tarrand KVI, Jeffrey J, Samonis G. Arch of Internal Med. 2000;160:501–509. doi: 10.1001/archinte.160.4.501. [DOI] [PubMed] [Google Scholar]
- 24.Yang X, Yadav NN, Song X, Banerjee SR, Edelman H, Minn I, van Zijl PCM, Pomper MG, McMahon MT. Chem Eur J. 2014;20:15824–15832. doi: 10.1002/chem.201403943. [DOI] [PMC free article] [PubMed] [Google Scholar]
- 25.Shah T, Lu L, Dell K, Pagel MD, Griswold M, Flask CA. Magn Reson Med. 2011;65:432–437. doi: 10.1002/mrm.22637. [DOI] [PMC free article] [PubMed] [Google Scholar]


