Abstract
Myeloid‐derived suppressor cells (MDSC) are a heterogeneous population of immature and progenitor myeloid cells with an immunosuppressive role in various types of cancer, including head and neck squamous cell carcinoma (HNSCC). However, the effect on the host immune system, especially on invariant NKT (iNKT) cells with potent anti‐tumor activity, remains unclear. In this study, we investigated the effects of circulating MDSC subsets on the peripheral lymphocytes of patients with head and neck tumors. A significant accumulation of CD15+ granulocytic MDSC (G‐MDSC) and CD14+ monocytic MDSC (M‐MDSC) was demonstrated in HNSCC patients. The percentage of G‐MDSC showed an inverse correlation with the percentage of T cells in the peripheral blood. The increased G‐MDSC was significantly associated with advanced clinical stage and poor prognosis of HNSCC patients. The proliferation and viability of T cells were suppressed by CD15+ cells, and the suppression was reversed by adding the hydrogen peroxide scavenger catalase. However, iNKT cell activation upon α‐galactosylceramide (αGalCer) stimulation was not affected by the presence or absence of CD15+ G‐MDSC. These results indicate that increased G‐MDSC negatively affects peripheral T cell immunity, but not iNKT cells, in HNSCC patients, and that T cells are more sensitive to hydrogen peroxide produced by G‐MDSC than iNKT cells. Cancer immunotherapy designed to enhance the antitumor activity of iNKT cells by stimulation with αGalCer may remain effective in the presence of G‐MDSC.
Keywords: Head and neck cancer, hydrogen peroxide, immune suppression, invariant NKT cell, squamous cell carcinoma
Targeted immunotherapy to promote anti‐tumor immune responses, such as cancer vaccination, has been examined against various types of cancer as an adjuvant for conventional cancer therapy.1 Despite the fact that cancer immunotherapy has been shown to induce significant immunological responses, the clinical response has been limited. Head and neck cancer is the sixth most common malignancy worldwide, with approximately 500 000 patients diagnosed annually.2 Despite advances in combination treatment modalities involving surgery, radiotherapy and chemotherapy for advanced head and neck squamous cell carcinoma (HNSCC), the survival rate remains low. The poor prognosis is thought to be linked to the fact that HNSCC strongly influences the host immune system.3 The anti‐tumor responses in HNSCC patients are compromised due to the presence of functional defects or increased T cell apoptosis, both circulating and tumor‐infiltrating;4 however, the mechanism underlying this depressed immune response is unclear. Tumors are thought to evoke many strategies to evade the host immune system, such as the induction of suppressive cells, including regulatory T cells and myeloid‐derived suppressor cells.
Myeloid‐derived suppressor cells (MDSC) are a heterogeneous population of immature and progenitor myeloid cells with immunosuppressive roles in infection,5 autoimmune disease6 and various types of cancer.7 MDSC have the potential to suppress the immune response by secreting mediators such as cytokines,8 reactive oxygen species (ROS) and nitric oxide (NO).9 It has been reported that an increased percentage of MDSC is associated with an increased risk of death in several types of cancer.10, 11 In humans, MDSC express the common myeloid markers CD11b and CD33, but lack the mature myeloid marker HLA‐DR, and a recent proposal subdivided them into two groups: CD15+ granulocytic MDSC (G‐MDSC) and CD14+ monocytic MDSC (M‐MDSC).12 However, the suppressive functions of MDSC subsets are still unclear in patients with cancer, including those with HNSCC.
Invariant NKT (iNKT) cells are a unique lymphocyte subpopulation characterized by the co‐expression of a T cell receptor and lineage markers of natural killer (NK) cells.13, 14, 15 Human iNKT cells express the invariant Vα24 antigen receptor and are activated by a glycolipid ligand, α‐galactosylceramide (αGalCer), in a CD1d‐dependent manner,16, 17, 18 and exhibit anti‐tumor activity against various cancers.19, 20, 21 Recently, the clinical efficacy of an iNKT cell‐based cancer immunotherapy has been demonstrated for head and neck cancer patients.22, 23, 24, 25 However, the effects of MDSC on iNKT cells in cancer patients have been unclear. In this study, we investigated the effect of circulating MDSC subsets on the peripheral immune response, especially on iNKT cells, and the association with clinical stage and prognosis in HNSCC patients.
Materials and Methods
Study subjects
The clinical characteristics of the study subjects are summarized in Table 1. The following patients were enrolled for the present study: 32 patients (34–83 years old) with HNSCC, nine patients (35–67 years old; one patient with stage I, one patient with stage III, seven patients with stage IV) with thyroid papillary carcinoma, seven patients (18–60 years old) with salivary gland pleomorphic adenoma and 18 healthy donors (35–63 years old). The study was approved by the institutional review board. Patients did not receive any treatment before sample collection. All HNSCC patients were enrolled in the study before receiving standard treatments, including surgery, radiotherapy and chemotherapy. Informed consent was obtained from all individual participants included in the study. All procedures performed were in accordance with the ethical standards of the institutional research committee and with the 1964 Helsinki declaration and its later amendments or comparable ethical standards.
Table 1.
The characteristics of head and neck tumor patients and healthy donors
| Sample | Total number | Median age (range) | Gender (male/female) |
|---|---|---|---|
| Healthy donors | 18 | 47.5 (35–63) | 9/9 |
| Pleomorphic adenoma | 7 | 43.9 (18–60) | 1/6 |
| Thyroid papillary adenocarcinoma | 9 | 56.3 (35–67) | 2/7 |
| Head and neck squamous cell carcinoma | 32 | 67.0 (34–83) | 26/6 |
| Age | Gender | Primary of HNSCC | TNM | Stage |
|---|---|---|---|---|
| 34 | F | Tongue | T1N0M0 | I |
| 67 | M | Tongue | T1N0M0 | I |
| 39 | M | Tongue | T4aN2cM0 | IV |
| 77 | M | Tongue | T2N2bM0 | IV |
| 64 | M | Tongue | T2N2bM0 | IV |
| 77 | M | Tongue | T2N2bM0 | IV |
| 64 | F | Oral floor | T4N2M0 | IV |
| 74 | M | Larynx | T1aN0M0 | I |
| 81 | M | Larynx | T2N0M0 | II |
| 75 | M | Larynx | T2N1M0 | III |
| 78 | M | Larynx | T3N0M0 | III |
| 72 | M | Larynx | T3N0M0 | III |
| 51 | M | Larynx | T4aN2cM0 | IV |
| 65 | M | Maxillary sinus | T3N0M0 | III |
| 60 | M | Maxillary sinus | T4aN0M0 | IV |
| 40 | F | Maxillary sinus | T4aN0M0 | IV |
| 71 | M | Maxillary sinus | T4bN0M0 | IV |
| 74 | M | Maxillary sinus | T4bN2bM0 | IV |
| 75 | M | Maxillary sinus | T3N1M0 | III |
| 56 | M | Oropharynx | T1N2bM0 | IV |
| 63 | F | Oropharynx | T2N2bM0 | IV |
| 77 | M | Oropharynx | T2N2bM0 | IV |
| 67 | F | Oropharynx | T4N3M0 | IV |
| 82 | M | Oropharynx | T4N2M1 | IV |
| 66 | M | Hypopharynx | T1N0M0 | I |
| 71 | M | Hypopharynx | T2N1M0 | III |
| 57 | M | Hypopharynx | T1N3M0 | IV |
| 68 | M | Hypopharynx | T4aN2bM0 | IV |
| 69 | M | Hypopharynx | T4aN2cM1 | IV |
| 74 | F | Hypopharynx | T4aN0M0 | IV |
| 75 | M | Hypopharynx | T4N2cM0 | IV |
| 83 | M | Hypopharynx | T4bN2bM0 | IV |
Blood samples
Peripheral blood cells (PBC) were isolated from a heparinized venous blood sample by density gradient centrifugation within 2 h of sample collection. Blood was diluted 1:1 with saline before being layered onto Ficoll‐Paque PLUS (GE Healthcare Bio‐Sciences, Uppsala, Sweden). After centrifugation for 30 min at 600 g, PBC were collected from the plasma‐Ficoll interphase. The cells were immediately used for flow cytometry or were assayed.
Antibodies and flow cytometry
Granulocytic MDSC were characterized as HLA‐DR‐negative, lineage (CD3, CD14, CD19, CD56)‐negative and CD15‐positive (HLA‐DR− Lin− CD15+), while M‐MDSC were identified as CD14+ HLA‐DR−/low.26, 27, 28 Anti‐HLA‐DR, CD33, Vα24‐FITC, CD3, CD19, CD56, CD11b, Vβ11‐PE, CD14‐PerCP, CD3 and CD15‐APC (BD Biosciences, San Diego, CA, USA) antibodies were used to separate and analyze T cells, B cells, NK cells and iNKT cells. Propidium iodide solution (Sigma‐Aldrich, St. Louis, MO, USA) and AnnexinV (BD Biosciences) were used to identify dead cells. The phenotype of the cells was evaluated by multicolor flow cytometry using a FACS Calibur or FACS Canto (BD Biosciences). The data were analyzed with FlowJo software (Tree Star, Ashland, OR, USA).
T cell proliferation assay
Peripheral blood cells were labeled with an anti‐CD15‐APC antibody and anti‐APC magnetic beads (Miltenyi Biotec K.K., Tokyo, Japan). The CD15+ cells were depleted from PBC using MiniMACS columns (Miltenyi Biotec). The control PBC were labeled with anti‐mouse IgG1‐APC antibody and anti‐APC magnet beads. In other experiments, the sorted CD15+ cells were added to the PBC at up to 10 times higher concentration than in original PBC. PBC with and without CD15+ cells were labeled with carboxy‐fluorescein diacetate succinimidyl ester (CFSE) (Cayman Chemichal, Ann Arbor, MI, USA) or CellTrace Violet (CTV) (Invitrogen, Carlsbad, CA, USA), and were stimulated with anti‐CD3 (5 μg/mL) (eBioscience, San Diego, CA, USA) and anti‐CD28 (5 μg/mL) (Miltenyi Biotec) antibodies in RPMI 1640 medium. In some experiments H2O2 scavenger catalase (100 U/mL, catalase from bovine liver; Sigma‐Aldrich) was added into the T cell culture. After a 48‐h or 72‐h incubation, the cells were collected and stained with anti‐CD3‐PE, CD4‐APC and CD8‐APC antibodies for flow cytometric analysis. The proliferation of CD4+ and CD8+ T cells was assessed by CFSE or CTV fluorescence intensity.
Cytokine assay
Interleukin (IL)‐4, IL‐10 and GM‐CSF in the culture medium were measured with Bio‐Plex Pro (Bio‐Rad Laboratories, Hercules CA, USA) according to the manufacturer's protocol. Briefly, antibody coupled capture beads were prepared and plated. After washing, samples and standards were added in duplicate to the beads in the wells. The detection antibodies were added to each well. Streptavidin‐phycoerythin solution was added to the wells. The plate was read and analyzed with the Bio‐Plex system. The absolute concentrations of the samples were determined by construction of a standard curve for each analysis.
Invariant NKT cell proliferation and IFN‐γ ELISPOT assay
Peripheral blood cells were depleted of CD15+ cells, as previously described, and were cultured in RPMI 1640 medium in the presence of IL‐2 (100 JRU/mL; Shionogi, Osaka, Japan) and αGalCer (100 ng/mL) to expand the iNKT cells. After 5 days of culture, the cells were collected and stained for flow cytometry using anti‐Vα24‐FITC, Vβ11‐PE and CD3‐APC antibodies. For the IFN‐γ ELISPOT assay, the cultured iNKT cells in the presence or absence of CD15+ cells were adjusted to 5 × 10⁵ cells per well, and stimulated with αGalCer. The iNKT cell responses were evaluated by counting the number of spots for IFN‐γ production using an ImmunoScan computer system and ImmunoSpot software (CTL, Cleveland, OH, USA).
Statistical analyses
The statistical analyses of the means and correlations were evaluated with nonparametric (Mann–Whitney U‐test or Spearman's test) tests, the change of G‐MDSC before and after treatment with a nonparametric (Wilcoxon signed rank test) test, and the overall survival with a log‐rank test. All P‐values were two‐sided, and P‐values <0.05 were considered to be statistically significant.
Results
Phenotypic characterization of myeloid‐derived suppressor cells subpopulations in peripheral blood
Compared with healthy donors, a significant increase in CD14+ HLA‐DR−/low M‐MDSC and HLA‐DR− Lin− CD15+ G‐MDSC was observed in HNSCC patients. No significant correlation was seen between the patient age and the ratio of M‐MDSC or G‐MDSC in HNSCC patients (data not shown). Representative staining profiles of M‐MDSC and G‐MDSC are shown (Fig. 1a–c). The CD15+ cells were also positive for both CD11b and CD33 (Fig. 1c). However, there was no correlation between the percentage of G‐MDSC and M‐MDSC (Fig. 1d).
Figure 1.
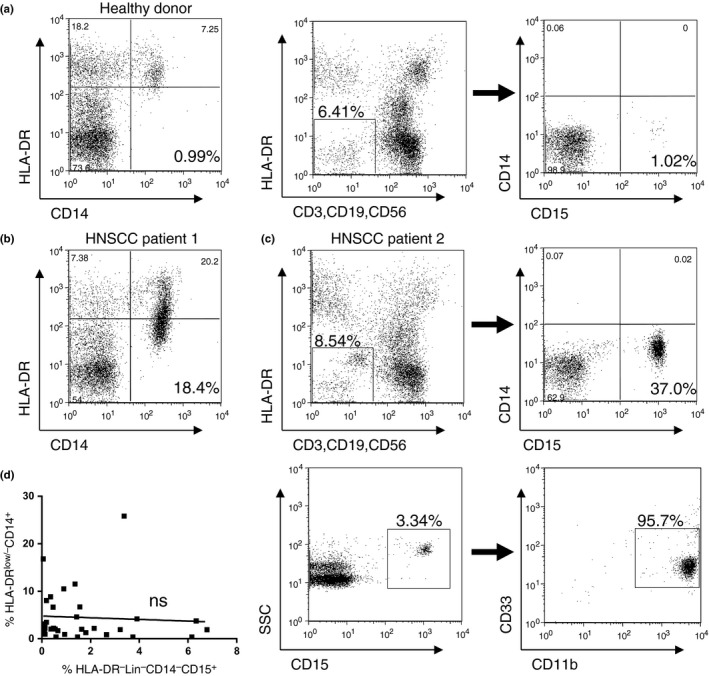
Identification of monocytic‐myeloid‐derived suppressor cells (M‐MDSC) in peripheral blood cells. M‐MDSC were defined as the HLA‐DR−/low CD14+ cell population. Granulocytic‐myeloid‐derived suppressor cells (G‐MDSC) were defined as the HLA‐DR− Lin− CD14− CD15+ cell population. (a–c) Representative staining and gating of M‐MDSC and G‐MDSC in peripheral blood cells (PBC) from a healthy donor, M‐MDSC from a patient with head and neck squamous cell carcinoma (HNSCC) and G‐MDSC from a patient with HNSCC, respectively. The CD15+ fraction of G‐MDSC stained positive for CD11b+ and CD33+. (d) No significant correlation was seen between the percentages of M‐MDSC and G‐MDSC in HNSCC patients.
Clinical features of monocytic myeloid‐derived suppressor cells in patients with head and neck tumors
The percentage of CD14+ HLA‐DR−/low M‐MDSC was significantly elevated in patients with HNSCC (Fig. 2a). There was no significant correlation between the percentages of M‐MDSC and lymphocytes in the white blood cell fraction or CD3+, CD19+, CD56+ and Vα24+ Vβ11+ cells in the PBC of HNSCC patients (Fig. 2b–f).
Figure 2.
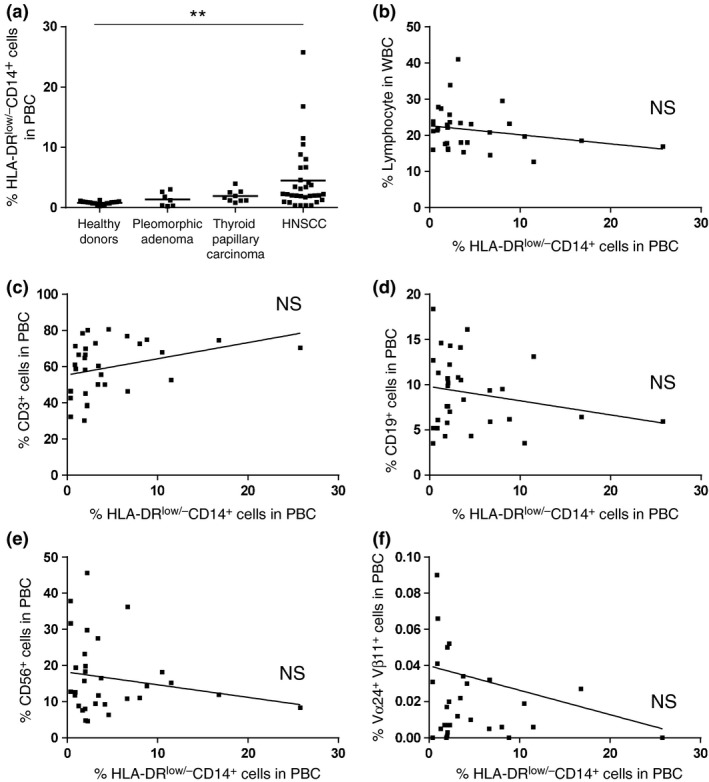
Percentage of monocytic‐myeloid‐derived suppressor cells (M‐MDSC) in peripheral blood cells and the correlation with the percentage of peripheral lymphocytes. (a) The percentage of CD14+ HLA‐DR−/low M‐MDSC from healthy donors and patients with pleomorphic adenoma, thyroid papillary carcinoma and head and neck squamous cell carcinoma (HNSCC). (b) The correlation between the percentage of M‐MDSC and the percentage of circulating lymphocytes in HNSCC patients. (c–f) The correlation between the percentage of M‐MDSC and lymphocyte subsets in HNSCC patients. **P < 0.01.
Clinical features of granulocytic‐myeloid‐derived suppressor cells in patients with head and neck tumor
The percentage of HLA‐DR− Lin− CD15+ G‐MDSC was significantly increased in patients with HNSCC compared with pleomorphic adenoma patients or healthy donors (Fig. 3a). No correlation was detected between the proportion of G‐MDSC and the lymphocyte subsets, including CD19+, CD56+ and Vα24+ Vβ11+ cells (Fig. 3b,d–f). However, a significant inverse correlation was detected between the ratio of HLA‐DR− Lin− CD14− CD15+ G‐MDSC and CD3+ cells (P < 0.01; Fig. 3c). To examine the correlation between MDSC and the clinical course, the ratio of G‐MDSC in five HNSCC patients with a high percentage (>1%) of G‐MDSC before treatment were counted again after 2 months of treatment. All five patients had a complete response after treatment, with significant decreases in the frequencies of circulating G‐MDSC detected following standard treatments (one patient treated with surgery alone, 2 with surgery and chemoradiotherapy and 2 with chemoradiotherapy alone; Fig. 3g). The ratio of CD3+ cells and Vα24+ Vβ11+ cells in the five patients were not significantly changed after treatment (data not shown).
Figure 3.
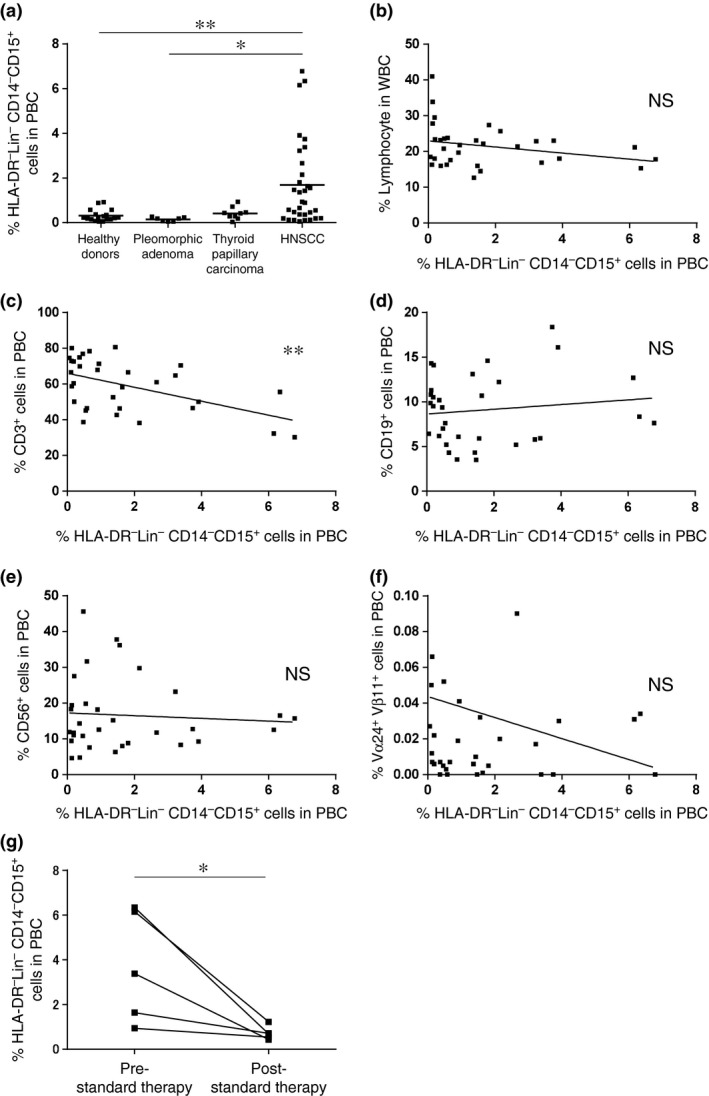
Percentage of granulocytic‐myeloid‐derived suppressor cells (G‐MDSC) in peripheral blood cells and the correlation with the percentage of peripheral lymphocytes. (a) The percentage of HLA‐DR− Lin− CD15+ G‐MDSC from healthy donors and patients with pleomorphic adenoma, thyroid papillary carcinoma and head and neck squamous cell carcinoma (HNSCC). (b–f) The correlation between the percentage of G‐MDSC and the percentage of circulating lymphocytes subsets in HNSCC patients. (g) The percentage of HLA‐DR− Lin− CD14− CD15+ G‐MDSC at pre‐standard and post‐standard therapy in HNSCC patients. *P < 0.05, **P < 0.01.
Association of myeloid‐derived suppressor cell subsets with tumor differentiation, clinical stage and prognosis in head and neck squamous cell carcinoma patients
The association of tumor differentiation and clinical stage of HNSCC with the ratio of G‐MDSC, M‐MDSC and CD3+ cells in PBC before treatment were analyzed in a total of 32 patients with HNSCC. There were no significant differences in the percentage of G‐MDSC, M‐MDSC and CD3+ cell in the pathological differentiation (Table 2). The percentage of G‐MDSC was significantly higher in patients with advanced stage III/IV compared with those with stage I/II (Fig. 4b), but not in M‐MDSC (Fig. 4a). There were no significant differences in CD3+ cells between the clinical stages (Fig. 4c). The percentage of iNKT cells in HNSCC patients was not decreased compared with healthy donors (Fig. 4d). The overall survival rate in the HNSCC patients with increased M‐MDSC (>3%) were not significantly different compared with those of patients with normal numbers of M‐MDSC in all stages (Fig. 4e), stage III/IV (Fig. 4f) or stage IV (data not shown). However, the overall survival rate in HNSCC patients with increased G‐MDSC (>1%) was significantly lower compared with survival of patients with normal levels of G‐MDSC in all stages (Fig. 4g), stage III/IV (Fig. 4h) and stage IV (data not shown).
Table 2.
Categorical measurement in patients with head and neck squamous cell carcinoma (HNSCC)
| Category | G‐MDSC | M‐MDSC | CD3+ cells |
|---|---|---|---|
| Healthy control, n = 18 | 0.35 (0.05–0.92) | 0.79 (0.25–1.27) | 64.6 (49.7–81.5) |
| HNSCC, n = 32 | 1.69 (0.06–6.78) | 4.48 (0.38–25.8) | 59.4 (30.2–80.6) |
| P‐value† | <0.01 | <0.01 | 0.36 |
| Well‐differentiated, n = 13 | 1.01 (0.11–3.38) | 4.66 (0.38–25.8) | 63.2 (38.7–80.6) |
| Moderately diff., n = 12 | 2.34 (0.13–6.78) | 3.11 (0.39–11.5) | 56.5 (30.2–80.1) |
| Poorly diff., n = 7 | 1.83 (0.06–6.34) | 6.49 (1.99–16.8) | 57.3 (38.2–74.5) |
| P‐value‡ | 0.21 | 0.43 | 0.49 |
| Stage I, II, n = 5 | 0.46 (0.11–1.47) | 1.74 (0.38–3.14) | 55.9 (38.7–72.9) |
| Stage III, IV, n = 27 | 1.92 (0.06–6.78) | 4.98 (0.39–25.8) | 60.1 (30.2–80.6) |
| P‐value† | <0.05 | 0.20 | 0.51 |
Data shown average % (range), †Unpaired t‐test, ‡ anova. G‐MDSC, granulocytic‐myeloid‐derived suppressor cells; M‐MDSC, monocytic‐myeloid‐derived suppressor cells.
Figure 4.
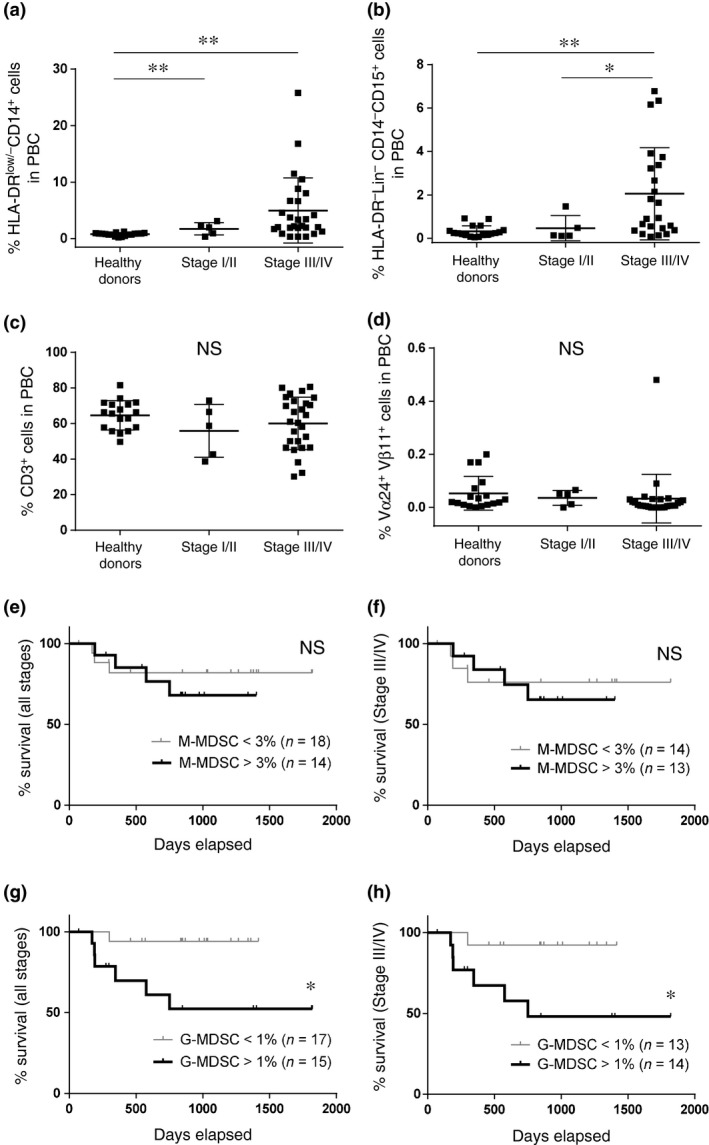
Association of myeloid‐derived suppressor cells subsets with clinical stage and prognosis in head and neck squamous cell carcinoma (HNSCC) patients. (a–d) The percentages of monocytic‐myeloid‐derived suppressor cells (M‐MDSC), granulocytic‐myeloid‐derived suppressor cells (G‐MDSC), CD3+ cells and invariant NKT (iNKT) cells from healthy donors and patients with HNSCC with stage I/II and stage III/IV. The rate of survival between high (>3%) and low (<3%) percentages of M‐MDSC in all stages (e) and stage III/IV (f). The rate of survival between high (>1%) and low (<1%) percentages of G‐MDSC in all stages (g) and stage III/IV (h). *P < 0.05. **P < 0.01.
Suppressive effect of circulating myeloid‐derived suppressor cells on T cells
T cell proliferation in the presence or absence of CD15+ cells stimulated with anti‐CD3 and anti‐CD28 antibodies for 48 h was examined. In a representative HNSCC patient, CD15+ cells were positive in 16.7% of the HLA‐DR− Lin− fraction of PBC and 0.1% positive after depletion (Fig. 5a). Proliferation of both CD4+ and CD8+ T cells was enhanced by the depletion of CD15+ cells (Fig. 5b). In addition, T cell proliferation and viability following the depletion or addition of CD15+ cells was compared. In an HNSCC patient, CD15+ cells were positive in 2.05% of the HLA‐DR− Lin− fraction of PBC and 0.05% positive after depletion. The cell numbers of CD3+, CD4+ and CD8+ cells in CD15+ cell‐added PBC stimulated with anti‐CD3/28 antibody were significantly lower compared with those without CD15+ cells after 72 h (Fig. 5c–e). Proliferation of both CD4+ and CD8+ T cells was suppressed by the addition of CD15+ cells (Fig. 5g). Levels of IL‐10 were higher in the culture supernatant at 24 h in CD15+ cell‐added PBC (Fig. 5h). The levels of IL‐4 and granulocyte macrophage colony‐stimulating factor (GM‐CSF) were not significantly different in the presence or absence of CD15+ cells (data not shown). Catalase was added into culture of T cells, and the proliferation and viability of T cells were largely recovered its addition in the presence of CD15+ G‐MDSC (Fig. 5i,j). All experiments were repeated at least twice with similar results.
Figure 5.
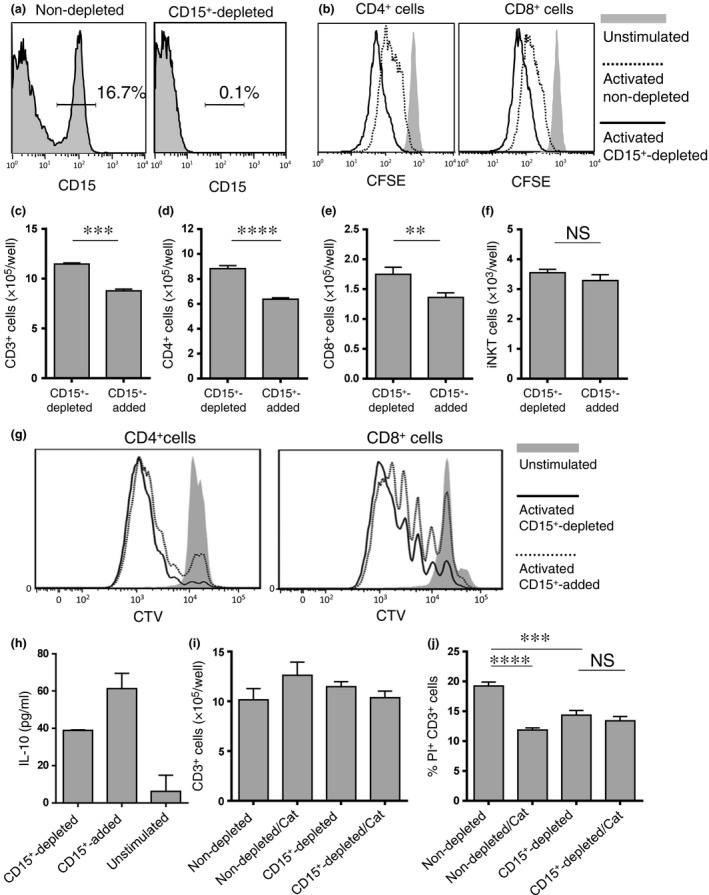
Granulocytic‐myeloid‐derived suppressor cells (G‐MDSC) suppress autologous T cell proliferation. (a) The percentage of CD15+ cells in HLA‐DR− Lin− fraction of whole peripheral blood cells (PBC) from a head and neck squamous cell carcinoma (HNSCC) patient before (left) and after (right) depletion by CD15 magnetic beads. (b) PBC depleted or not depleted of CD15+ cells were stained with carboxy‐fluorescein diacetate succinimidyl ester (CFSE) and stimulated with anti‐CD3/anti‐CD28 antibodies for 48 h. The difference in CD4+ and CD8+ T cell proliferation was assessed by CFSE dilution. PBC depleted of or with added CD15+ cells were stained with CellTrace Violet and stimulated with anti‐CD3/anti‐CD28 antibodies for 72 h. (c–e) The differences in CD3+, CD4+ and CD8+ cell number were counted, and (g) CD4+ and CD8+ cell proliferation was assessed by CTV dilution. (h) Levels of interleukin (IL)‐10 were measured in supernatants of T cell cultures at 24 h. (f) PBC depleted of or with added CD15+ cells were cultured for 5 days stimulated with αGalCer, and invariant NKT (iNKT) cell number was counted. (i, j) PBC depleted or not depleted CD15+ cells were stimulated with anti‐CD3/anti‐CD28 antibodies with or without catalase (Cat) for 72 h. The difference in CD3+ cell number was counted and cell death was assessed by the percentage of PI+ cells in CD3+cells. **P < 0.01, ***P < 0.001, ****P < 0.0001.
The activation of invariant NKT cells stimulated by αGalCer is not affected by granulocytic‐myeloid‐derived suppressor cells
We evaluated the proliferation and viability of iNKT cells and IFN‐γ production following stimulation with αGalCer in the presence or absence of CD15+ cells. In a representative HNSCC patient, the CD15+ cells comprised 15.8% of the HLA‐DR− Lin− fraction in PBC, and after CD15+ cell depletion, only 0.01% were positive (Fig. 6a). There was no significant difference in the cell number (Fig. 6b), the ratio in PBC (Fig. 6c) and the cell death in iNKT cells (Fig. 6d,e) between CD15+ cell replete cultures and CD15+ cell‐depleted cultures after 5 days. There was no significant difference in the IFN‐γ production of iNKT cells between non‐depleted and CD15+ cell‐depleted cultures after 5 days (Fig. 6f). Similarly, 5 days after stimulation with αGalCer, there was no difference in iNKT cell number between CD15+ cell‐depleted and CD15+ cell‐added PBC (Fig. 5f). These results were repeated in three samples.
Figure 6.
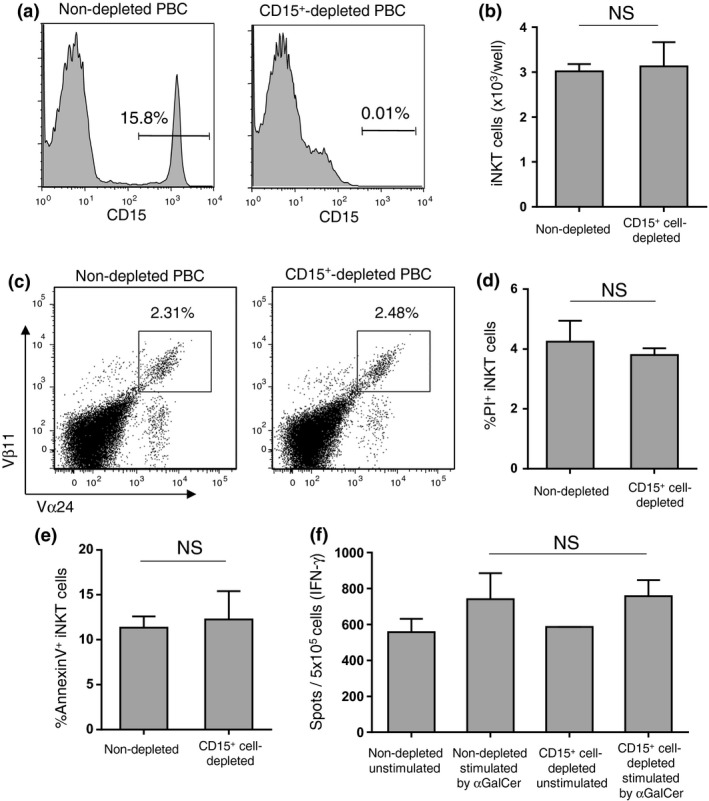
Invariant NKT (iNKT) cells are resistant to granulocytic‐myeloid‐derived suppressor cells (G‐MDSC). (a) The percentage of CD15+ cells in the HLA‐DR− Lin− fraction of whole peripheral blood cells (PBC) from a head and neck squamous cell carcinoma (HNSCC) patient before (left) and after (right) depletion by CD15 magnetic beads. PBC with and without CD15+ cells were cultured for 5 days, stimulated with αGalCer. (b–e) The cell numbers were counted, and the staining profile, percentage of cell death and apoptosis of iNKT cells were assessed by flow cytometry. (f) IFN‐γ produced by iNKT cells was assessed by ELISPOT after 5 days. NS, not significant.
Discussion
In this study, we investigated the human MDSC subsets in patients with head and neck tumors, including benign pleomorphic adenoma, thyroid papillary carcinoma and squamous cell carcinoma, and healthy donors. We observed a significant increase in the percentage of both CD14+ HLA‐DR−/low M‐MDSC and HLA‐DR− Lin− CD15+ G‐MDSC in PBC from HNSCC patients, but not in patients with other head and neck tumors. However, there was no correlation between the percentages of G‐MDSC and M‐MDSC, suggesting that they independently accumulated in the peripheral blood of HNSCC patients. In HNSCC patients, the percentage of circulating G‐MDSC had an inverse correlation with the ratio of T cells in PBC, suggesting that G‐MDSC preferentially suppress T cell proliferation or viability. Therefore, we investigated the suppressive capabilities of G‐MDSC on T cells. Depletion of CD15+ G‐MDSC in PBC from HNSCC patients enhanced the T cell proliferation and decreased T cell death, and, inversely, addition of CD15+ G‐MDSC into PBC suppressed the T cell proliferation. However, the H2O2 scavenger catalase reversed the suppressive activity of CD15+ G‐MDSC against T cells. These results indicated that circulating G‐MDSC have potent suppressive activity toward both CD4+ and CD8+ T cells, and H2O2 was one of the main suppressive factors produced by G‐MDSC. In addition, the level of IL‐10 was increased in supernatant of T cell culture in CD15+ cell‐added PBC, suggesting that G‐MDSC enhance IL‐10 production by T cells and could indirectly suppress the activation of T cells. MDSC reportedly have the potential to suppress the T cell‐mediated immune response through their production of arginase‐1 (Arg‐1), NO,26, 29, 30 ROS31, 32 and immunosuppressive cytokines, such as TGF‐β, IL‐4, IL‐6 and IL‐10, in experimental animal models.9 In mice, M‐MDSC express high levels of NO, while G‐MDSC express high levels of ROS, with their suppressive function dependent on Arg‐1 and the production of ROS.33
In this study, we found that the percentage of G‐MDSC in PBC in patients with HNSCC post‐standard therapy was significantly decreased compared with G‐MDSC pre‐standard therapy. This result suggests that the eradication of tumors decreased the induction of G‐MDSC by HNSCC. However, the percentages of CD3+ cells were not increased after treatment, suggesting that radiation and chemotherapy might effect and prolong the suppression of T cells. In addition, it was demonstrated that G‐MDSC were significantly associated with the poor prognosis in HNSCC patients in this study, indicating that G‐MDSC is a clinically significant factor.
The development of new treatment strategies, such as cancer immunotherapy, is expected to improve both the prognosis and quality of life of HNSCC patients. Recently, our group has shown efficacy of an iNKT cell‐based cancer immunotherapy for HNSCC patients.22, 23, 24, 25 However, the effects of MDSC on iNKT cells have been unclear. Thus, in this study, the effect of circulating MDSC on iNKT cells was investigated. No correlation was found between the percentage of M‐MDSC or G‐MDSC and iNKT cells in PBC. Next, we evaluated the iNKT cell proliferation, viability and IFN‐γ production in the presence or absence of CD15+ G‐MDSC. However, upon stimulation with αGalCer, the iNKT cells in PBC expanded equally, and there was no difference in IFN‐γ production, regardless of the G‐MDSC. In mice, reportedly, iNKT cells could convert CD11b+ Gr1+ MDSC into stimulatory APC, or suppress CD11b+ Ly‐6G+ Ly‐6C+ MDSC in a CD1d‐dependent manner.34, 35 The association of iNKT cells with MDSC has been poorly understood in humans, including cancer patients. From our results, it is suggested that G‐MDSC from HNSCC patients produce H2O2, and while T cells are sensitive to H2O2, iNKT cells are resistant. From these results, it could be expected that cancer immunotherapy to enhance the antitumor activity of iNKT cells using αGalCer might not be inhibited, and is, therefore, more likely to be effective in HNSCC patients, even in the presence of G‐MDSC. However, because the antitumor activity of iNKT cells mediates T cell activation,36 it is expected that targeted therapy to reduce MDSC will also enhance the therapeutic efficacy of iNKT cell‐based immunotherapy.
In conclusion, we found a significant increase in the circulating M‐MDSC and G‐MDSC, and increased G‐MDSC was associated with poor prognosis in HNSCC patients. The percentage of G‐MDSC in PBC showed an inverse correlation with the percentage of T cells, and T cell proliferation and viability were suppressed by G‐MDSC. The suppression was reversed by catalase, suggesting that G‐MDSC constitutively suppress the proliferation and viability of peripheral T cells mediated by H2O2. Meanwhile, iNKT cells showed resistance to the suppressive activity of G‐MDSC, suggesting that iNKT cells had a higher antioxidative capacity than T cells. Cancer immunotherapy to enhance the antitumor activity of iNKT cells by stimulation with αGalCer is likely to remain effective even in the presence of G‐MDSC.
Disclosure Statement
The authors have no conflict of interest to declare.
Acknowledgments
We thank Ayako Inamine for assisting in the T cell proliferation assay. This work was supported by MEXT KAKENHI Grant Numbers 22791569 and 24592589.
Cancer Sci 107 (2016) 207–216
Funding Information
Japan Society for the Promotion of Science, (grant/award numbers: ‘22791569’ and ‘24592589’).
References
- 1. Schuler G. Dendritic cells in cancer immunotherapy. Eur J Immunol 2010; 40: 2123–30. [DOI] [PubMed] [Google Scholar]
- 2. Kamangar F, Dores GM, Anderson WF. Patterns of cancer incidence, mortality, and prevalence across five continents: defining priorities to reduce cancer disparities in different geographic regions of the world. J Clin Oncol 2006; 24: 2137–50. [DOI] [PubMed] [Google Scholar]
- 3. Duray A, Demoulin S, Hubert P, Delvenne P, Saussez S. Immune suppression in head and neck cancers: a review. Clin Dev Immunol 2010; 2010: 701657. [DOI] [PMC free article] [PubMed] [Google Scholar]
- 4. Albers AE, Strauss L, Liao T, Hoffmann TK, Kaufmann AM. T cell‐tumor interaction directs the development of immunotherapies in head and neck cancer. Clin Dev Immunol 2010; 2010: 236378. [DOI] [PMC free article] [PubMed] [Google Scholar]
- 5. Goh C, Narayanan S, Hahn YS. Myeloid‐derived suppressor cells: the dark knight or the joker in viral infections? Immunol Rev 2013; 255: 210–21. [DOI] [PMC free article] [PubMed] [Google Scholar]
- 6. Cripps JG, Gorham JD. MDSC in autoimmunity. Int Immunopharmacol 2011; 11: 789–93. [DOI] [PMC free article] [PubMed] [Google Scholar]
- 7. Filipazzi P, Valenti R, Huber V et al Identification of a new subset of myeloid suppressor cells in peripheral blood of melanoma patients with modulation by a granulocyte‐macrophage colony‐stimulation factor‐based antitumor vaccine. J Clin Oncol 2007; 25: 2546–53. [DOI] [PubMed] [Google Scholar]
- 8. Ostrand‐Rosenberg S, Sinha P. Myeloid‐derived suppressor cells: linking inflammation and cancer. J Immunol 2009; 182: 4499–506. [DOI] [PMC free article] [PubMed] [Google Scholar]
- 9. Gabrilovich DI, Ostrand‐Rosenberg S, Bronte V. Coordinated regulation of myeloid cells by tumours. Nat Rev Immunol 2012; 12: 253–68. [DOI] [PMC free article] [PubMed] [Google Scholar]
- 10. Gabitass RF, Annels NE, Stocken DD, Pandha HA, Middleton GW. Elevated myeloid‐derived suppressor cells in pancreatic, esophageal and gastric cancer are an independent prognostic factor and are associated with significant elevation of the Th2 cytokine interleukin‐13. Cancer Immunol Immunother 2011; 60: 1419–30. [DOI] [PMC free article] [PubMed] [Google Scholar]
- 11. Solito S, Falisi E, Diaz‐Montero CM et al A human promyelocytic‐like population is responsible for the immune suppression mediated by myeloid‐derived suppressor cells. Blood 2011; 118: 2254–65. [DOI] [PMC free article] [PubMed] [Google Scholar]
- 12. Poschke I, Kiessling R. On the armament and appearances of human myeloid‐derived suppressor cells. Clin Immunol 2012; 144: 250–68. [DOI] [PubMed] [Google Scholar]
- 13. Vicari AP, Zlotnik A. Mouse NK1.1+ T cells: a new family of T cells. Immunol Today 1996; 17: 71–6. [DOI] [PubMed] [Google Scholar]
- 14. Taniguchi M, Koseki H, Tokuhisa T et al Essential requirement of an invariant Vα14 T cell antigen receptor expression in the development of natural killer T cells. Proc Natl Acad Sci USA 1996; 93: 11025–8. [DOI] [PMC free article] [PubMed] [Google Scholar]
- 15. Bendelac A, Rivera MN, Park SH, Roark JH. Mouse CD1‐specific NK1 T cells: development, specificity, and function. Annu Rev Immunol 1997; 15: 535–62. [DOI] [PubMed] [Google Scholar]
- 16. Hameg A, Apostolou I, Leite‐De‐Moraes M et al A subset of NKT cells that lacks the NK1.1 marker, expresses CD1d molecules, and autopresents the alpha‐galactosylceramide antigen. J Immunol 2000; 165: 4917–26. [DOI] [PubMed] [Google Scholar]
- 17. Kawano T, Cui J, Koezuka Y et al CD1d‐restricted and TCR‐mediated activation of valpha14 NKT cells by glycosylceramides. Science 1997; 278: 1626–9. [DOI] [PubMed] [Google Scholar]
- 18. Brossay L, Chioda M, Burdin N et al CD1d‐mediated recognition of an alpha‐galactosylceramide by natural killer T cells is highly conserved through mammalian evolution. J Exp Med 1998; 188: 1521–8. [DOI] [PMC free article] [PubMed] [Google Scholar]
- 19. Kawano T, Nakayama T, Kamada N et al Antitumor cytotoxicity mediated by ligand‐activated human V alpha24 NKT cells. Cancer Res 1999; 59: 5102–5. [PubMed] [Google Scholar]
- 20. Motohashi S, Nakayama T. Clinical applications of natural killer T cell‐based immunotherapy for cancer. Cancer Sci 2008; 99: 638–45. [DOI] [PMC free article] [PubMed] [Google Scholar]
- 21. Nieda M, Nicol A, Koezuka Y et al TRAIL expression by activated human CD4(+) V alpha 24 NKT cells induces in vitro and in vivo apoptosis of human acute myeloid leukemia cells. Blood 2001; 97: 2067–74. [DOI] [PubMed] [Google Scholar]
- 22. Uchida T, Horiguchi S, Tanaka Y et al Phase I study of alpha‐galactosylceramide‐pulsed antigen presenting cells administration to the nasal submucosa in unresectable or recurrent head and neck cancer. Cancer Immunol Immunother 2008; 57: 337–45. [DOI] [PMC free article] [PubMed] [Google Scholar]
- 23. Kunii N, Horiguchi S, Motohashi S et al Combination therapy of in vitro‐expanded natural killer T cells and alpha‐galactosylceramide‐pulsed antigen‐presenting cells in patients with recurrent head and neck carcinoma. Cancer Sci 2009; 100: 1092–8. [DOI] [PMC free article] [PubMed] [Google Scholar]
- 24. Kurosaki M, Horiguchi S, Yamasaki K et al Migration and immunological reaction after the administration of αGalCer‐pulsed antigen‐presenting cells into the submucosa of patients with head and neck cancer. Cancer Immunol Immunother 2011; 60: 207–15. [DOI] [PMC free article] [PubMed] [Google Scholar]
- 25. Yamasaki K, Horiguchi S, Kurosaki M et al Induction of NKT cell‐specific immune responses in cancer tissues after NKT cell‐targeted adoptive immunotherapy. Clin Immunol 2011; 138: 255–65. [DOI] [PubMed] [Google Scholar]
- 26. Gabrilovich DI, Nagaraj S. Myeloid‐derived suppressor cells as regulators of the immune system. Nat Rev Immunol 2009; 9: 162–74. [DOI] [PMC free article] [PubMed] [Google Scholar]
- 27. Serafini P, Borrello I, Bronte V. Myeloid suppressor cells in cancer: recruitment, phenotype, properties, and mechanisms of immune suppression. Semin Cancer Biol 2006; 16: 53–65. [DOI] [PubMed] [Google Scholar]
- 28. Ostrand‐Rosenberg S. Myeloid‐derived suppressor cells: more mechanisms for inhibiting antitumor immunity. Cancer Immunol Immunother 2010; 59: 1593–600. [DOI] [PMC free article] [PubMed] [Google Scholar]
- 29. Schouppe E, Van Overmeire E, Laoui D, Keirsse J, Van Ginderachter JA. Modulation of CD8(+) T‐cell activation events by monocytic and granulocytic myeloid‐derived suppressor cells. Immunobiology 2013; 218: 1385–91. [DOI] [PubMed] [Google Scholar]
- 30. Kusmartsev S, Su Z, Heiser A et al Reversal of myeloid cell‐mediated immunosuppression in patients with metastatic renal cell carcinoma. Clin Cancer Res 2008; 14: 8270–8. [DOI] [PubMed] [Google Scholar]
- 31. Kusmartsev S, Nefedova Y, Yoder D, Gabrilovich DI. Antigen‐specific inhibition of CD8+ T cell response by immature myeloid cells in cancer is mediated by reactive oxygen species. J Immunol 2004; 172: 989–99. [DOI] [PubMed] [Google Scholar]
- 32. Ando T, Mimura K, Johansson CC et al Transduction with the antioxidant enzyme catalase protects human T cells against oxidative stress. J Immunol 2008; 181: 8382–90. [DOI] [PubMed] [Google Scholar]
- 33. Sauer H, Wartenberg M, Hescheler J. Reactive oxygen species as intracellular messengers during cell growth and differentiation. Cell Physiol Biochem 2001; 11: 173–86. [DOI] [PubMed] [Google Scholar]
- 34. Ko HJ, Lee JM, Kim YJ, Kim YS, Lee KA, Kang CY. Immunosuppressive myeloid‐derived suppressor cells can be converted into immunogenic APCs with the help of activated NKT cells: an alternative cell‐based antitumor vaccine. J Immunol 2009; 182: 1818–28. [DOI] [PubMed] [Google Scholar]
- 35. De Santo C, Salio M, Masri SH et al Invariant NKT cells reduce the immunosuppressive activity of influenza A virus‐induced myeloid‐derived suppressor cells in mice and humans. J Clin Invest 2008; 118: 4036–48. [DOI] [PMC free article] [PubMed] [Google Scholar]
- 36. Fujii S, Shimizu K, Okamoto Y et al NKT cells as an ideal anti‐tumor immunotherapeutic. Front Immunol 2013; 4: 409. [DOI] [PMC free article] [PubMed] [Google Scholar]


