

Abstract
MicroRNA (miRNA), which are stably present in serum, have been reported to be potentially useful for detecting cancer. In the present study, we examined the expression profiles of serum miRNA in several large cohorts to identify novel miRNA that can be used to detect early stage breast cancer. We comprehensively evaluated the serum miRNA expression profiles using highly sensitive microarray analysis. A total of 1280 serum samples of breast cancer patients stored in the National Cancer Center Biobank were used. In addition, 2836 serum samples were obtained from non‐cancer controls, 451 from patients with other types of cancers, and 63 from patients with non‐breast benign diseases. The samples were divided into a training cohort including non‐cancer controls, other cancers and breast cancer, and a test cohort including non‐cancer controls and breast cancer. The training cohort was used to identify a combination of miRNA that could detect breast cancer, and the test cohort was used to validate that combination. miRNA expressions were compared between patients with breast cancer and non‐breast cancer, and a combination of five miRNA (miR‐1246, miR‐1307‐3p, miR‐4634, miR‐6861‐5p and miR‐6875‐5p) was found to be able to detect breast cancer. This combination had a sensitivity of 97.3%, specificity of 82.9% and accuracy of 89.7% for breast cancer in the test cohort. In addition, this combination could detect early stage breast cancer (sensitivity of 98.0% for Tis).
Keywords: Biomarker, breast cancer, cancer screening, liquid biopsy, microRNA
Breast cancer is one of the most common cancers among Japanese women, and accounted for over 13,000 deaths in 2013.1 Although diagnostic techniques and anticancer drugs have greatly improved in recent years, it is still difficult to detect early stage breast cancer. Recurrence of breast cancer is often incurable; therefore, early detection is extremely important to obtain a good prognosis.
Breast cancer screening using mammography has been accepted and actively promoted worldwide. However, some individuals avoid mammography because of the fear of pain resulting from the pressure of the compression plates or due to the inconvenience of making the time for the procedure. Therefore, a painless and simple alternative examination method is needed. One such easy, less invasive examination for “entry” breast cancer screening is blood analysis.
Circulating microRNA (miRNA) are considered stable miRNA in the serum/plasma. These miRNA represent potential biomarkers for evaluating cancer, and many circulating miRNA indicative of breast cancer have been identified.2, 3, 4, 5, 6, 7, 8, 9, 10, 11, 12, 13, 14 For example, the combination of miR‐145 and miR‐451 has been shown to be useful for breast cancer detection,15 miR‐155 has been reported to be a possible breast cancer marker, and the combination of miR‐155, miR‐145 and miR‐382 has also been reported to be effective for breast cancer detection16, 17 Moreover, a previous study reported the use of a combination of nine miRNA, including miR‐145 and miR‐15a, for breast cancer detection.18 However, the sensitivity and specificity of these miRNA for detecting early stage breast cancer are not ideal, and no validated miRNA for early breast cancer has been tested with a statistically appropriate number of clinical samples.
It has been reported that breast cancer cells use extracellular miRNA for signal transduction. We previously showed that miR‐23b plays an important role in retaining breast cancer cells in the bone marrow niche for future metastasis.19 We also reported that miR‐181c‐containing extracellular vesicles, released from breast cancer cells, trigger the breakdown of the blood‐brain barrier and promote brain metastasis.20 These findings support the hypothesis that breast cancer patients have specific circulating miRNA in the blood, which can be used for breast cancer detection. Recently, a high number of new miRNA have been identified in Homo sapiens; however, for most of these miRNA, and especially circulating miRNA, the expression levels or functions have never been examined in breast cancer patients.
In the present study, we examined the expression profiles of serum miRNA that were recently updated in miRBase (release 20) in several very large cohorts that included 1280 breast cancer patients and 3350 controls to identify circulating miRNA that can detect early stage breast cancer.
Materials and Methods
Clinical samples
Serum samples were obtained from breast cancer patients and patients with benign breast diseases who were admitted or referred to the National Cancer Center Hospital (NCCH) between 2008 and 2014. Breast cancer patients with the following characteristics were excluded: (i) administration of medication before the collection of serum; and (ii) simultaneous or previous diagnosis of advanced cancer in other organs. For the breast cancer patients, a total of 74 serum samples were assigned to the training cohort and stored at −80°C, while 1206 serum samples were assigned to the test cohort and stored at −20°C. Moreover, a total of 54 patients with benign breast diseases were included and assigned to the test cohort, with the samples stored at −20°C. All sera from other cancers and non‐malignant disease patients were stored at −80°C, irrespective of the cohort.
Control serum samples were obtained from healthy individuals in three cohorts. The first cohort included volunteers aged over 60 years recruited from the Japanese company Toray Industries in 2013. The inclusion criteria for this cohort were no history of cancer and no hospitalization during the last 3 months. The second cohort included individuals whose serum samples were collected and stored by the National Center for Geriatrics and Gerontology (NCGG) Biobank between 2010 and 2012. The final cohort included female volunteers aged over 35 years who were recruited from the Yokohama Minoru Clinic in 2015, with the same criteria as those of the first cohort.
Serum samples from patients with other cancers/non‐breast benign diseases were included to identify the miRNA that are specific for breast cancer. A total of 400 patients with other cancers (100, 98, 50, 50, 50 and 52 cases of pancreatic, biliary tract, colon, gastric, esophageal and hepatic cancers, respectively) and 21 patients with non‐malignant pancreatic/biliary‐tract disease who were registered in the National Cancer Center (NCC) Biobank were included to determine the circulating miRNA in control subjects. Whole miRNA expression profiles of these serum samples are present in the Gene Expression Omnibus (GEO) database (GSE59856), and the registered data and clinical information21 were used in the present study. In addition, serum samples from 51 patients with prostate cancer and 42 patients with prostate benign disease (prostate specific antigen ≥4 ng/mL) from Saint Marianna School of Medicine were donated to the NCC and used in the present study.
miRNA expression analysis using microarray
Total RNA was extracted from a 300‐μL serum sample using 3D‐Gene® RNA extraction reagent from a liquid sample kit (Toray Industries, Inc., Kanagawa, Japan). Comprehensive miRNA expression analysis was performed using a 3D‐Gene® miRNA Labeling kit and a 3D‐Gene® Human miRNA Oligo Chip (Toray Industries, Inc.), which was designed to detect 2555 miRNA sequences registered in miRBase release 20 ( http://www.mirbase.org/).
miRNA was considered to be present if the corresponding microarray signal was more than the (mean + 2 × standard deviation) signal of the negative controls of which the top and bottom 5% ranked by signal intensity were removed. Once miRNA was considered present, the mean signal of the negative controls of which the top and bottom 5% ranked by signal intensity were removed was subtracted from the miRNA signal. When the signal value was negative (or undetected) after background subtraction, the value was replaced by the lowest signal intensity on the microarray minus 0.1 on a base 2 logarithm scale. To normalize the signals across the different microarrays tested, three pre‐selected internal control miRNA (miR‐149‐3p, miR‐2861 and miR‐4463), which had been stably detected in more than 500 serum samples, were used. Each miRNA signal value was standardized with the ratio of the average signal value of the three internal control miRNA to the pre‐set value. All microarray data of this study are in agreement with the Minimum Information About a Microarray Experiment (MIAME) guidelines and are publicly available through the GEO database (GSE73002, http://www.ncbi.nlm.nih.gov/projects/geo/).
Quantitative RT‐PCR assay
To validate the data, the total RNA samples extracted for microarray analysis were also used for quantitative RT‐PCR (qRT‐PCR) analysis. The miRNA expression levels were investigated using TaqMan® microRNA assay (Thermo Fisher Scientific, San Jose, CA, USA), TaqMan® Reverse Transcription kit (Thermo Fisher Scientific) and TaqMan® Universal PCR Master Mix (Thermo Fisher Scientific) according to the manufacturer's instructions. The expression levels were normalized to miR‐149‐3p, because specific primer sets for miR‐2861 and miR‐4463 could not be designed.
Statistical analysis
In the present study, miRNA expression profiles were compared between breast cancer patients and individuals with other clinical conditions, including non‐cancer controls and patients with other types of cancer/non‐breast benign diseases.
Before statistical comparisons, the samples of each clinical condition were divided into a training cohort and a test cohort independently. Using the training cohort, two clinical groups were compared using a two‐sided Student's t‐test, and a Bonferroni‐corrected P‐value < 0.01 was considered statistically significant. To identify robust biomarkers, only miRNA that had a signal value of 26 in more than 50% of the analyses in each clinical group being compared were selected for further analysis. Using these miRNA, Fisher's linear discriminant analysis was performed in the training cohort, and the diagnostic sensitivity, specificity and accuracy were calculated for each miRNA marker or a combination of miRNA markers in the training/test cohort. When expressions of multiple miRNA were used in the algorithm development, the discriminant functions were created using Fisher's linear discriminant analysis. The resulting values of the discriminant functions were used to prepare the diagnostic index. In clinical samples, an index score of 0 or more was considered to indicate breast cancer and an index score of less than 0 was considered to indicate non‐breast cancer or other clinical conditions.
To analyze the results of the qRT‐PCR analysis, unpaired Student's t‐test was used to evaluate the differences between two groups. The correlations between the results of the microarray and qRT‐PCR analyses were examined using Pearson's correlation analysis.
All analyses were performed using R version 3.1.2 (R Foundation for Statistical Computing, http://www.R-project.org), MASS package version 7.3–3022 and bee swarm package version 0.1.6.23
Prediction of miRNA target genes and enrichment analysis
Prediction of candidate miRNA target genes and target enrichment analysis were performed using DIANA miRPath v2.0.24 Each miRNA was analyzed with micro‐CDS using a threshold of 0.8, and predicted target genes were enriched in KEGG pathways with a P‐value threshold of 0.05 (default setting).
Ethical statement
The present study involving human subjects was approved by: the National Cancer Center Hospital Institutional Review Board (21‐074, 2013‐111); the Ethics and Conflict of Interest Committee of the National Center for Geriatrics and Gerontology (754); the Human Tissue Samples Ethics Committee for R&D, Toray Industries (HC2014‐41, 44, HC2015‐2, and 30); and the Research Ethics Committee of Medical Corporation Shintokai Yokohama Minoru Clinic (6019‐18‐3772). Written informed consent was obtained from each subject. Copies of the written consent statements are available for review by the Editor of this journal.
Results
Characteristics of the control and breast cancer patients
A total of 1280 and 54 serum samples were obtained from breast cancer patients and patients with benign breast diseases, respectively. In addition, 2836 serum samples were obtained from non‐cancer controls, 451 from patients with other types of cancers and 63 from patients with non‐breast benign diseases. The characteristics of the breast cancer patients, patients with benign breast diseases, non‐cancer controls, and patients with other types of cancers or non‐breast benign diseases are presented in Table 1a–d, respectively.
Table 1.
Characteristics of the breast cancer patients (a), patients with benign breast diseases (b), non‐cancer controls (c), and patients with other types of cancers or benign diseases (d)
| Training cohort | Test cohort | |
|---|---|---|
| (a) Breast cancer patients | ||
| Total number of patients (1280) | 74 | 1206 |
| Tumor stage | ||
| Stage 0 (256) | 0 | 256 |
| Stage 1 (483) | 0 | 483 |
| Stage 2 (444) | 52 | 392 |
| Stage 3 (44) | 22 | 22 |
| Stage 4 (53) | 0 | 53 |
| (b) Patients with benign breast diseases | ||
| Total number of patients (54) | 0 | 54 |
| Clinical condition | ||
| Atypical ductal hyperplasia | 0 | 3 |
| Intraductal papilloma | 0 | 14 |
| Benign phyllodes | 0 | 6 |
| Fibroadenoma | 0 | 11 |
| Others | 0 | 20 |
| (c) Non‐cancer controls | ||
| Total number of patients (2836) | 1493 | 1343 |
| Sex | ||
| Male (787) | 477 | 310 |
| Female (2049) | 1016 | 1033 |
| Cohort | ||
| Healthy male/female volunteers aged over 60 years (150) | 150 | 0 |
| NCGG Biobank (1689) | 848 | 841 |
| Healthy female volunteers aged over 35 years (997) | 495 | 502 |
| (d) Patients with other types of cancers or benign diseases | ||
| Total number of patients (514) | 514 | 0 |
| Clinical condition | ||
| Pancreatic cancer | 100 | 0 |
| Biliary tract cancer | 98 | 0 |
| Stomach cancer | 50 | 0 |
| Esophageal cancer | 50 | 0 |
| Colon cancer | 50 | 0 |
| Liver cancer | 52 | 0 |
| Prostate cancer | 51 | 0 |
| Benign prostate disease | 42 | 0 |
| Benign pancreatic/biliary tract disease | 21 | 0 |
Among the breast cancer patients, two independent cohorts were designed (Table 1a). The first cohort was used as the training cohort, and included 74 serum samples of female breast cancer patients collected for previous research and stored in NCCH at −80°C (ethically permitted for use in this study). The second cohort was used as the test cohort and included 1206 serum samples of breast cancer patients stored in the NCC Biobank at −20°C.
Among the non‐cancer controls, three cohorts were included (Table 1c). The first cohort included 150 serum samples of healthy volunteers recruited in a previous study, who were over 60 years of age and mainly male.21 This cohort was included in the training cohort (Table 1c). The second cohort included serum samples collected and stored in the NCGG Biobank. As NCGG is a research center for geriatric diseases, most of the serum samples were obtained from patients who were older than 60 years, and approximately half of these patients were diagnosed with dementia. Both male and female individuals were present in this cohort. As this cohort included over 1000 serum samples, the samples were randomly divided into the training and test cohorts. The third cohort included serum samples of healthy female volunteers aged 35 years or more. As this cohort included nearly 1000 serum samples, the samples were randomly divided into the training and test cohorts.
The group of patients with other types of cancer or non‐breast benign diseases included those with pancreatic, biliary tract, stomach, esophageal, colon, liver or prostate cancer, and those with benign pancreatic/biliary tract disease or benign prostate disease with a high prostate‐specific antigen level (≥4 ng/mL). Patients without prostate diseases were recruited and analyzed with the same platform, as described previously.21
Comparison of breast cancer patients and controls
Using Fisher's linear discriminant analysis, we designed comprehensive discriminants with 1–5 miRNA in the training cohort (breast cancer versus non‐cancer or other cancer/non‐breast benign diseases) and validated them in the test cohort. The analysis identified a combination of five miRNA (miR‐1246, miR‐1307‐3p, miR‐4634, miR‐6861‐5p and miR‐6875‐5p) that showed the best discrimination in both the training cohort and test cohort. The expression levels of these five miRNA are presented in Figure 1. The diagnostic index was calculated using the following formula: (0.25 × miR‐1246) + (0.49 × miR‐1307‐3p) − (1.06 × miR‐4634) + (1.89 × miR‐6875‐5p) + (0.31 × miR‐6861‐5p) − 13.94. In the training cohort, the diagnostic index showed a sensitivity of 87.8%, specificity of 78.5% and accuracy of 78.7%. Although the serum samples of breast cancer patients in the test cohort were independent from those in the training cohort, the diagnostic index showed high performance (Fig. 2a,b), with a sensitivity of 97.3%, specificity of 82.9% and accuracy of 89.7% (Table 2). The receiver operating characteristic curve of the test cohort is presented in Figure 3. The area under the curve (AUC) was 0.971. The specificity and AUC were calculated for the discrimination of breast cancer from the non‐cancer controls.
Figure 1.
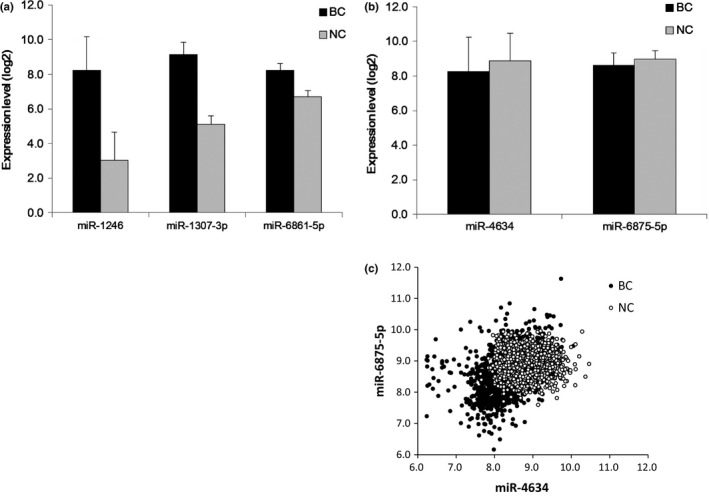
Expression levels of the five microRNA (miRNA). (a) Expression levels of miRNA that are upregulated in the serum of cancer patients. (b) Expression levels of miRNA that are downregulated in the serum of cancer patients. (c) Scatter plot of the two miRNA that are downregulated in the serum of cancer patients. Expression level: miRNA signal is shown in log2. The error bars indicate the standard error. BC, patients with breast cancer in the test cohort (n = 1206); NC, non‐cancer controls in the test cohort (n = 1343).
Figure 2.
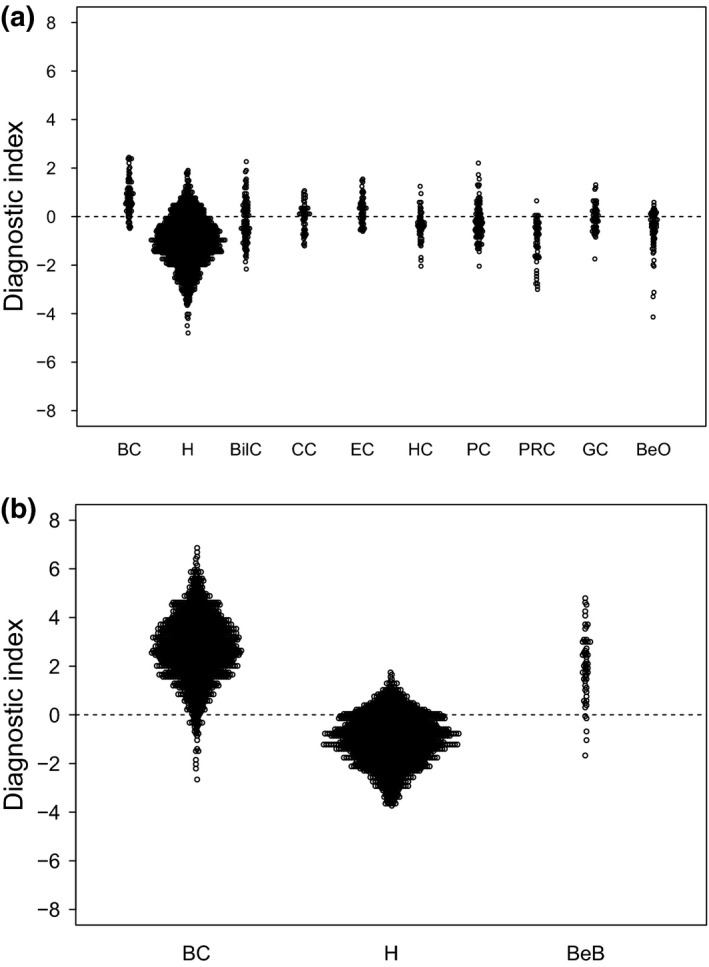
Cancer specificity of the diagnostic index using the combination of miR‐1246, miR‐1307‐3p, miR‐4634, miR‐6861‐5p and miR‐6875‐5p in the test cohort. (a) Training cohort. Patients with breast cancer (n = 74), non‐cancer controls (n = 1493), patients with other types of cancers (n = 451) and patients with non‐breast benign diseases (n = 63) were included. (b) Test cohort. Patients with breast cancer (n = 1206), non‐cancer controls (n = 1343) and patients with benign breast diseases (n = 54) were included. BC, breast cancer; BeB, benign breast diseases; BeO, benign pancreas/biliary tract/prostate diseases; BilC, biliary cancer; CC, colorectal cancer; EC, esophageal cancer; GC, gastric cancer; H, healthy volunteer; HC, hepatic cancer; PC, pancreas cancer; PRC, prostate cancer.
Table 2.
Discriminant analysis for breast cancer
| Discriminant | Training cohort | Test cohort | ||||
|---|---|---|---|---|---|---|
| Accuracy (%) | Sensitivity (%) | Specificity (%) | Accuracy (%) | Sensitivity (%) | Specificity (%) | |
| Diagnostic index with five miRNAs | 78.7 | 87.8 | 78.5 | 89.7 | 97.3 | 82.9 |
| miR‐1246 | 63.8 | 81.1 | 63.2 | 91.0 | 88.3 | 93.4 |
| miR‐1307‐3p | 57.8 | 51.4 | 58 | 75.3 | 100 | 53.1 |
| miR‐4634 | 50.9 | 58.1 | 50.7 | 40.4 | 3.4 | 73.6 |
| miR‐6861‐5p | 63.2 | 62.2 | 63.3 | 89.1 | 99.8 | 79.4 |
| miR‐6875‐5p | 73.7 | 77 | 73.6 | 47.4 | 14.7 | 76.8 |
The diagnostic index was calculated using the following formula: (0.25 × miR‐1246) + (0.49 × miR‐1307‐3p) − (1.06 × miR‐4634) + (1.89 × miR‐6875‐5p) + (0.31 × miR‐6861‐5p) − 13.94.
Figure 3.
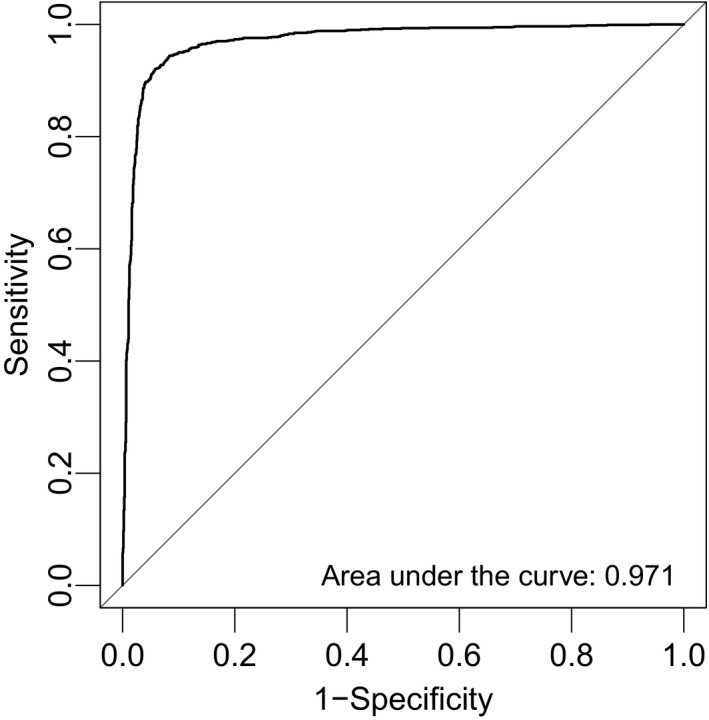
Receiver operating characteristic curve analysis of the diagnostic index using the combination of miR‐1246, miR‐1307‐3p, miR‐4634, miR‐6861‐5p and miR‐6875‐5p.
The discrimination performances of each miRNA included in the diagnostic index are presented in Table 2. Of the five miRNA, miR‐1246 showed the highest performance, but the single value did not exceed that of the diagnostic index (the combination of the five miRNA). miR‐1307‐3p and miR‐6861‐5p showed sensitivities of 100% and 99.9% in the test cohort, respectively, but their specificities were not as good as the specificity of miR‐1246. Serum miR‐1246 was overexpressed in breast cancer patients by over twofold in the test cohort (breast cancer: 8.2 ± 2.0; non‐cancer individuals: 3.0 ± 1.6), and miR‐1307‐3p and miR‐6861‐5p were also overexpressed in breast cancer patients (breast cancer: 9.1 ± 0.7 and 8.2 ± 0.4; non‐cancer individuals: 5.1 ± 0.4 and 6.7 ± 0.3, respectively).
Performance of the diagnostic index according to clinical conditions
The discrimination performance of the diagnostic index for each breast cancer grade was examined in the test cohort. TNM classification and staging information of the breast cancers were used to assess the performance of the diagnostic index. The diagnostic index showed high performance for all cancer stages (stage 0, 98.0%; stage 1, 98.1%; stage 2, 95.7%; stage 3, 100%; stage 4, 96.2%) and TNM grades (T: Tis, 97.7%; T1, 98.2%; T2, 95.8%; T3, 90.9%; T4, 97.1%; N: N0, 97.2%; N1, 98.2%; N2, 92.9%; N3, 100%; and M: M0, 97.3%; M1, 96.2%) (Table 3).
Table 3.
Number of positive and negative samples according to the diagnostic index in each clinical group
| Clinical group | Stage/disease type | Discrimination | ||
|---|---|---|---|---|
| Positive | Negative | |||
| Training cohort (N = 2081) | ||||
| Patients with breast cancer (74) | Stage | Stage 2 | 48 | 4 |
| Stage 3 | 17 | 5 | ||
| Patients with other types of cancer (451) | Pancreatic cancer (100) | 33 | 67 | |
| Biliary tract cancer (98) | 42 | 56 | ||
| Colon cancer (50) | 29 | 21 | ||
| Stomach cancer (50) | 23 | 27 | ||
| Esophageal cancer (50) | 33 | 17 | ||
| Liver cancer (52) | 10 | 42 | ||
| Prostate cancer (51) | 4 | 47 | ||
| Patients with other types of benign diseases (63) | Benign prostate disease (42) | 8 | 34 | |
| Benign pancreatic/biliary tract disease (21) | 9 | 12 | ||
| Non‐cancer controls (1493) | – | 242 | 1251 | |
| Clinical group | Stage or TNM | Discrimination | ||
|---|---|---|---|---|
| Positive | Negative | |||
| Test cohort (N = 2600) | ||||
| Patients with breast cancer (1206) | Stage | Stage 0 (256) | 251 | 5 |
| Stage 1 (483) | 474 | 9 | ||
| Stage 2 (392) | 375 | 17 | ||
| Stage 3 (22) | 22 | 0 | ||
| Stage 4 (53) | 51 | 2 | ||
| T | Tis (257) | 252 | 5 | |
| T1 (505) | 496 | 9 | ||
| T2 (385) | 369 | 16 | ||
| T3 (22) | 20 | 2 | ||
| T4 (34) | 33 | 1 | ||
| Unknown (M1) (3) | 3 | 0 | ||
| N | N0 (1070) | 1040 | 30 | |
| N1 (109) | 107 | 2 | ||
| N2 (14) | 13 | 1 | ||
| N3 (4) | 4 | 0 | ||
| Unknown (M1) (9) | 9 | 0 | ||
| M | M0 (1153) | 1122 | 31 | |
| M1 (53) | 51 | 2 | ||
| Patients with benign breast diseases (54) | – | 49 | 5 | |
| Non‐cancer controls (1343) | – | 230 | 1113 | |
Only 54 serum samples of patients with benign breast diseases (intraductal papilloma, 14; fibroadenoma, 11; benign phyllodes, 6; atypical ductal hyperplasia, 3; others, 20) were available and these were evaluated in the test cohort. Of these samples, only five (benign phyllodes, 2; fibroadenoma, 1; others, 2) were discriminated as non‐cancer. In the test cohort, the breast cancer group comprised a single cohort, while the non‐cancer group included two cohorts (NCGG and female healthy volunteers). Age and sex might have an impact on the performance of the diagnostic index; therefore, we examined whether age‐dependent or sex‐dependent effects on the non‐cancer controls were present in the discrimination of the test cohort. The NCGG cohort included male and female controls; hence, sex‐specific analysis was performed with this cohort. In the NCGG cohort, no difference was noted between male (93.5%, n = 310) and female (89.5%, n = 531) controls. Age‐specific analysis was performed in the test cohort, and the discrimination performance showed an increasing tendency with age (35–40 years, 73.9%, n = 115; 41–50 years, 58.7%, n = 155; 51–60 years, 73.9%, n = 180; 61–70 years, 85.5%, n = 193; 71–80 years, 90.7%, n = 388; ≥81 years, 92.0%, n = 312).
miRNA expression levels detected by qRT‐PCR
We attempted to evaluate the expression levels of miR‐1246, miR‐1307‐3p, miR‐4634, miR‐6875‐5p and miR‐6861‐5p using qRT‐PCR analysis, for which the detection principle is different from that of microarrays. However, specific TaqMan® primer sets for miR‐4634 and miR‐6861‐5p could not be designed. In addition, the detection levels of miR‐1307‐3p and miR‐6875‐5p were too low to measure precisely in human serum samples using qRT‐PCR (Fig. S1). Therefore, we evaluated the expression levels of miR‐1246 in 13 randomly selected breast cancer samples and 13 non‐cancer samples. As shown in Figure 4(a), the miR‐1246 expression levels were significantly higher in breast cancer samples than in non‐cancer samples. Overall, the results obtained by qRT‐PCR were considered well correlated with those by microarray analysis (Fig. 4b).
Figure 4.
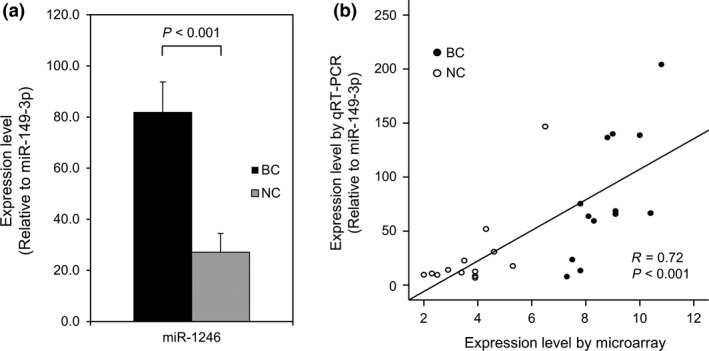
Expression levels of serum miR‐1246 using quantitative RT‐PCR (qRT‐PCR). (a) The expression levels of miR‐1246 are significantly upregulated in the serum of cancer patients. The expression levels were normalized to miR‐149‐3p. The error bars indicate the standard error. (b) The expression levels of miR‐1246 examined by qRT‐PCR significantly correlated with those obtained by microarray analysis. BC, patients with breast cancer (n = 13); NC, non‐cancer controls (n = 13).
Pathway analysis of candidate target genes
For examining the biological significance of the five candidate marker miRNA, we introduced these miRNA into miRPath.24 miRPath can predict the target genes of the introduced miRNA (based on miRBase release 18) and the biological network among candidate target genes. Among the five miRNA, miR‐1246 had 808 predicted target genes, miR‐1307‐3p had 22 and miR‐4634 had 1. The biological network could be predicted only with the candidate target genes of miR‐1246, and the listed KEGG pathways are presented in Table 4. The ErbB and mTOR signaling pathways were ranked at the fifth and sixth positions. The target genes assigned to the ErbB signaling pathway were BRAF, PIK3CB, SHC4 and ERBB4, and those assigned to the mTOR signaling pathway were BRAF, FIGF, PIK3CB and EIF4E.
Table 4.
Predicted target gene enrichment for miR‐1246 using miRPath
| Enriched KEGG pathway | P‐value | Assigned gene number |
|---|---|---|
| Neurotrophin signaling pathway (hsa04722) | 0.000131 | 7 |
| N‐Glycan biosynthesis (hsa00510) | 0.001794 | 2 |
| Inositol phosphate metabolism (hsa00562) | 0.004935 | 4 |
| Protein processing in endoplasmic reticulum (hsa04141) | 0.004935 | 6 |
| ErbB signaling pathway (hsa04012) | 0.006231 | 4 |
| mTOR signaling pathway (hsa04150) | 0.006231 | 4 |
| Cytokine–cytokine receptor interaction (hsa04060) | 0.007325 | 6 |
| Phosphatidylinositol signaling system (hsa04070) | 0.007325 | 4 |
| Thyroid cancer (hsa05216) | 0.007325 | 2 |
| Cell adhesion molecules (CAM) (hsa04514) | 0.019107 | 5 |
| Colorectal cancer (hsa05210) | 0.03125 | 3 |
| Endometrial cancer (hsa05213) | 0.032856 | 3 |
| Axon guidance (hsa04360) | 0.039147 | 5 |
| Long‐term depression (hsa04730) | 0.046436 | 3 |
| Glioma (hsa05214) | 0.049757 | 3 |
Discussion
The detection of breast cancer in the early stages is extremely important; therefore, breast cancer screening using mammography has been actively promoted worldwide. However, the screening rate for breast cancer is rather low in Japan (27.4% among women aged ≥40 years; Comprehensive Survey of Living Conditions, 2013). Although many public and private organizations encourage women to undergo breast cancer screening, and although public funds provide financial support to women for breast cancer screening, unfortunately, these efforts have not proven very successful in Japan. Possible reasons for avoidance of breast cancer screening might include the assumption that mammography is associated with pain and the time required to visit clinics for screening. To avoid these problems, we attempted to develop a simple screening test that detects circulating miRNA. As serum is a commonly used for health screening, there should be no additional problems associated with using a serum sample for breast cancer screening.
Several previous studies have demonstrated the value of serum miRNA in breast cancer detection.2, 3, 4, 5, 6, 7, 8, 9, 10, 11, 12, 13, 14, 15, 16, 17, 18, 19 Recently, a number of new cancer‐related miRNA have been identified, most of which have never been examined in breast cancer patients. In the present study, we comprehensively examined the expression profiles of these novel serum miRNA in breast cancer patients, using highly sensitive microarrays that permitted the simultaneous analysis of more than 2500 miRNA that were recently updated in miRBase (release 20). In addition, we used as many as 5000 serum samples, including newly collected samples and samples stored in the NCC and NCGG Biobank. This new technique of detecting miRNA is simpler and less invasive (only 300 μL of serum is required) for cancer screening than other liquid biopsy techniques, such as those used for circulating tumor cells and circulating tumor DNA. In the future, this technique is expected to be developed as an automated diagnostic kit with an analysis time of less than a day and a required sample size of less than 100 μL.
In the present study, using a single miRNA as a marker, a sensitivity of 100% was obtained at the optimized threshold for miR‐1307‐3p (Table 2). However, good specificity was not obtained at the same condition (53.1%). Previous studies have demonstrated that the diagnostic performance can be increased by combining multiple significant miRNA.15, 18, 21, 22 Thus, herein, five miRNA were identified from comparative analyses, and a diagnostic index was developed. The discrimination performance of the diagnostic index was validated in the test cohort. The five miRNA included miR‐1246, miR‐1307‐3p, miR‐4634, miR‐6861‐5p and miR‐6875‐5p, and the combination had a sensitivity of 97.3%, specificity of 82.9% and accuracy of 89.7% in detecting breast cancer among non‐cancer individuals and patients with non‐breast benign diseases or other types of cancer. When one more miRNA was integrated into the diagnostic index, the discrimination performance did not improve, and this may have resulted from the noise features. Such a phenomenon is known as the “curse of dimensionality” in algorithm development.25 In contrast, the combination of four miRNA could achieve comparable performance to the discriminant with five miRNA (Table S1). This suggests that the robustness of the discriminant is obtained by using the five selected miRNA, and we selected the discriminant with five miRNA as the best one. A previous study showed that a combination of miR‐145 and miR‐451 in plasma achieved an AUC of 0.931, sensitivity of 83%, and specificity of 93% in an independent cohort (70 breast cancer patients and 50 normal controls).15 Another study showed that a combination of serum miRNA (miR‐145, miR‐155 and miR‐382) achieved an AUC of 0.988, sensitivity of 97.6%, and specificity of 100% among 61 breast cancer patients and 10 healthy individuals; however, the findings were not validated in an independent cohort.16 However, in these previous studies, the number of samples was smaller and/or the sensitivity, specificity and accuracy were lower than those in the present study or were not well validated.
In this study, further examination of the five miRNA revealed that there was no correlation between the level of the diagnostic index and clinical parameters, and the diagnostic index identified breast cancer both in the early stage (especially in Tis; non‐invasive cancer, stage 0) and in the advanced stages. Therefore, there was no discrimination bias according to the clinical condition. Moreover, each miRNA expression level used to compose the diagnostic index showed no correlation with the clinical stage. The function of these five miRNA in the biology of breast cancer, which is briefly discussed below, will be further examined in the near future.
Of note, the present study used multiple independent clinical cohorts, which had their own specific features. Among the breast cancer patients, serum samples in the training cohort were stored at −80°C, while serum samples in the test cohort were stored at −20°C for no more than 6 years. Different storage conditions might affect the miRNA profiles; however, the effect was considered minimal in the present study, because the miRNA signals were normalized using internal control miRNA during the analysis. The miRNA combination identified in the training cohort was well validated in the test cohort, despite the sample storage temperatures being different between breast cancer samples in the test and training cohorts, which included more than 1000 samples, and this validation showed the robustness and reproducibility of the diagnostic index.
It is extremely difficult to match the clinical status of cancer patients to that of non‐cancer (control) patients. As an alternative, we recruited groups with variations to allow for robust discriminant analysis. We used: (i) a cohort that had been utilized previously with the same analysis platform; (ii) a cohort from the NCGG Biobank, which is one of the national biobanks in Japan run under strict standards; and (iii) female healthy volunteers. The male/female difference did not have an effect on the diagnostic index. However, a slight age‐specific tendency was noted (more specific for elderly individuals), and the specificity in young healthy individuals should, hence, be improved in the future. Furthermore, the clinical utility of the diagnostic index developed herein should be validated in a prospective cohort study, along with existing diagnostic techniques such as mammography.
A problem with the developed diagnostic index is that it cannot distinguish benign breast diseases from breast cancer. With this diagnostic index, benign breast diseases were identified as breast cancer. Therefore, it might be used for breast hyperplasia. However, as one aim of the present study was to identify an initial screening technique that provides good reasoning and motivation for more women to undergo mammography, we believe that the problem of false‐positive results of the diagnostic index caused by benign breast diseases is acceptable at the present time. However, studies should be performed in the future to improve the diagnostic index so that it can distinguish benign breast diseases from breast cancer.
As mentioned above, although we found that a combination of serum miRNA could be used to detect breast cancer, the biological roles of these serum miRNA are under discussion and warrant further examination. All miRNA used for the diagnostic index had an ID name higher than 1000, indicating that they were discovered relatively recently. Therefore, we were not able to find many previous studies on these miRNA, except for miR‐1246.
miR‐1246 has been reported to be actively secreted from the breast cancer cell line MCF‐7.26 There may be differences between cell lines and intact tumors; however, in the present study, serum miR‐1246 was overexpressed in breast cancer patients by over twofold. As the expression of miR‐1246 in non‐cancer controls was close to the background expression, miR‐1246 might represent a powerful breast cancer marker. miRPath analysis also showed the significance of miR‐1246 as a breast cancer marker. The predicted target genes were part of the ErbB and mTOR pathways; these pathways play very important roles in the pathogenesis and progression of breast cancer.27 Breast cancer cells might actively produce miR‐1246, which, in turn, might inhibit the signaling pathways utilized by cancers. We did not identify any biological pathways for the other four miRNA, and this might be because miRPath utilizes miRBase release 18 and because these four miRNA have not been substantially analyzed. miR‐6861‐5p and miR‐6875‐5p were not registered in miRBase release 18, miR‐1307‐3p (formerly miR‐1307) was registered before 2008, and miR‐4634 was registered in miRBase release 17 in 2011; however, miRPath predicted a low number of target genes for these miRNA compared to those for miR‐1246 (808 for miR‐1246 vs 22 for miR‐1307‐3p and one for miR‐4634). The features of these four miRNA in breast cancer biology should be analyzed further.
Finally, we also investigated the feasibility of the use of detection methods other than microarrays for the five miRNA that composed the discriminant. However, by TaqMan® qRT‐PCR, miR‐1246 was the only miRNA that could be detected effectively. The detection principles of qRT‐PCR and microarrays differ, especially in terms of the fact that the detection of qRT‐PCR depends on the amplification of the target sequence, while that of microarrays depends on hybridization without target amplification. For the five miRNA used for the final discriminant, TaqMan® probes for miR‐4634 and miR‐6875‐5p could not be designed because of high GC content or the potential of self‐dimers. On the other hand, probes for miR‐1307‐3p and miR‐6875‐5p could be obtained, but could not efficiently detect the target in human serum RNA (Fig. S1). Therefore, we believe that this discriminant is more suitable for the detection by microarrays.
In conclusion, our results indicate that a diagnostic index prepared using a combination of miR‐1246, miR‐1307‐3p, miR‐4634, miR‐6861‐5p and miR‐6875‐5p measured from serum can be used to detect breast cancer in the early stages and to differentiate breast cancer from pancreas/biliary tract/prostate benign diseases or other cancers. We hope that such a diagnostic index will be implemented to help detect breast cancer in the early stages, thus improving the curability of breast cancer in the future.
Disclosure Statement
JK and ST are employees of Toray Industries, Inc., the provider of the 3D‐Gene® system. All other authors have no conflict of interest to declare.
Supporting information
Fig. S1. Expression levels of serum miR‐1246, miR‐1307‐3p and miR‐6875‐5p analyzed using quantitative RT‐PCR (qRT‐PCR).
Table S1. Discriminant analysis for breast cancer with all possible combinations of the five miRNA markers.
Acknowledgments
We would like to thank Makiko Ichikawa, Satoshi Kondou, Hiroko Sudo and Hitoshi Nobumasa for technical support, Tomomi Fukuda and Kamakura Techno‐Science for microarray assays, Takumi Sonoda for microarray and qRT‐PCR assays, Noriko Abe and Michiko Ohori for picking up samples, Ken Kato for clinical management of the project, and Hideo Sasaki and Tatsuya Chikaraishi for provision of serum samples with prostate abnormalities. This study was supported by the “Development of Diagnostic Technology for Detection of miRNA in Body Fluids” grant from the Japan Agency for Medical Research and Development and New Energy and Industrial Technology Development Organization. The NCC Biobank was supported in part by Grants‐in‐Aid for Cancer Research (14S‐3, 14S‐4, 17S‐3, 17S‐5, 20S‐3 and 20S‐6) from the Ministry of Health, Labour and Welfare of Japan and the National Cancer Center Research and Development Fund (23‐A‐16, 23‐A‐21, 26‐A‐1 and 26‐A‐4) of Japan.
Cancer Sci 107 (2016) 326–334
Funding Information
New Energy and Industrial Technology Development Organization, National Cancer Center Research and Development Fund, (grant/award number: ‘23‐A‐16, 23‐A‐21, and 26‐A‐4') Ministry of Health, Labour and Welfare of Japan, (grant/award number: ‘14S‐3, 14S‐4, 17S‐3, 17S‐5, 20S‐3, and 20S‐6') Japan Agency for Medical Research and Development.
References
- 1. Cancer Registry and Statistics. Cancer Information Service, National Cancer Center, Japan 2015.
- 2. Zhu W, Qin W, Atasoy U, Sauter ER. Circulating microRNAs in breast cancer and healthy subjects. BMC Res Notes 2009; 2: 89. [DOI] [PMC free article] [PubMed] [Google Scholar]
- 3. Heneghan HM, Miller N, Kelly R, Newell J, Kerin MJ. Systemic miRNA‐195 differentiates breast cancer from other malignancies and is a potential biomarker for detecting noninvasive and early stage disease. Oncologist 2010; 15: 673–82. [DOI] [PMC free article] [PubMed] [Google Scholar]
- 4. Asaga S, Kuo C, Nguyen T, Terpenning M, Giuliano AE, Hoon DS. Direct serum assay for microRNA‐21 concentrations in early and advanced breast cancer. Clin Chem 2011; 57: 84–91. [DOI] [PubMed] [Google Scholar]
- 5. Roth C, Rack B, Muller V, Janni W, Pantel K, Schwarzenbach H. Circulating microRNAs as blood‐based markers for patients with primary and metastatic breast cancer. Breast Cancer Res 2010; 12: R90. [DOI] [PMC free article] [PubMed] [Google Scholar]
- 6. Jung EJ, Santarpia L, Kim J et al Plasma microRNA 210 levels correlate with sensitivity to trastuzumab and tumor presence in breast cancer patients. Cancer 2012; 118: 2603–14. [DOI] [PMC free article] [PubMed] [Google Scholar]
- 7. Cuk K, Zucknick M, Heil J et al Circulating microRNAs in plasma as early detection markers for breast cancer. Int J Cancer 2013; 132: 1602–12. [DOI] [PubMed] [Google Scholar]
- 8. Si H, Sun X, Chen Y et al Circulating microRNA‐92a and microRNA‐21 as novel minimally invasive biomarkers for primary breast cancer. J Cancer Res Clin Oncol 2013; 139: 223–9. [DOI] [PMC free article] [PubMed] [Google Scholar]
- 9. Sun Y, Wang M, Lin G et al Serum microRNA‐155 as a potential biomarker to track disease in breast cancer. PLoS One 2012; 7: e47003. [DOI] [PMC free article] [PubMed] [Google Scholar]
- 10. Chan M, Liaw CS, Ji SM et al Identification of circulating microRNA signatures for breast cancer detection. Clin Cancer Res 2013; 19: 4477–87. [DOI] [PubMed] [Google Scholar]
- 11. Cuk K, Zucknick M, Madhavan D et al Plasma microRNA panel for minimally invasive detection of breast cancer. PLoS One 2013; 8: e76729. [DOI] [PMC free article] [PubMed] [Google Scholar]
- 12. Zearo S, Kim E, Zhu Y et al MicroRNA‐484 is more highly expressed in serum of early breast cancer patients compared to healthy volunteers. BMC Cancer 2014; 14: 200. [DOI] [PMC free article] [PubMed] [Google Scholar]
- 13. Sochor M, Basova P, Pesta M et al Oncogenic microRNAs: miR‐155, miR‐19a, miR‐181b, and miR‐24 enable monitoring of early breast cancer in serum. BMC Cancer 2014; 14: 448. [DOI] [PMC free article] [PubMed] [Google Scholar]
- 14. Shen J, Hu Q, Schrauder M et al Circulating miR‐148b and miR‐133a as biomarkers for breast cancer detection. Oncotarget 2014; 5: 5284–94. [DOI] [PMC free article] [PubMed] [Google Scholar]
- 15. Ng EK, Li R, Shin VY et al Circulating microRNAs as specific biomarkers for breast cancer detection. PLoS One 2013; 8: e53141. [DOI] [PMC free article] [PubMed] [Google Scholar]
- 16. Mar‐Aguilar F, Mendoza‐Ramirez JA, Malagon‐Santiago I et al Serum circulating microRNA profiling for identification of potential breast cancer biomarkers. Dis Markers 2013; 34: 163–9. [DOI] [PMC free article] [PubMed] [Google Scholar]
- 17. Liu J, Mao Q, Liu Y, Hao X, Zhang S, Zhang J. Analysis of miR‐205 and miR‐155 expression in the blood of breast cancer patients. Chin J Cancer Res 2013; 25: 46–54. [DOI] [PMC free article] [PubMed] [Google Scholar]
- 18. Kodahl AR, Lyng MB, Binder H et al Novel circulating microRNA signature as a potential non‐invasive multi‐marker test in ER‐positive early‐stage breast cancer: a case control study. Mol Oncol 2014; 8: 874–83. [DOI] [PMC free article] [PubMed] [Google Scholar]
- 19. Ono M, Kosaka N, Tominaga N et al Exosomes from bone marrow mesenchymal stem cells contain a microRNA that promotes dormancy in metastatic breast cancer cells. Sci Signal 2014; 7: ra63. [DOI] [PubMed] [Google Scholar]
- 20. Tominaga N, Kosaka N, Ono M et al Brain metastatic cancer cells release microRNA‐181c‐containing extracellular vesicles capable of destructing blood‐brain barrier. Nat Commun 2015; 6: 6716. [DOI] [PMC free article] [PubMed] [Google Scholar]
- 21. Kojima M, Sudo H, Kawauchi J et al MicroRNA markers for the diagnosis of pancreatic and biliary‐tract cancers. PLoS One 2015; 10: e0118220. [DOI] [PMC free article] [PubMed] [Google Scholar]
- 22. Venables WN, Ripley BD. Modern Applied Statistics with S, 4th edn New York, NY: Springer, 2002. [Google Scholar]
- 23. Eklund A. Beeswarm: The Bee Swarm Plot, An Alternative to StripChart, 2013. R package version 0.1.6. Available from URL: http://CRAN.R-project.org/package=beeswarm. [Google Scholar]
- 24. Vlachos S, Kostoulas N, Vergoulis T et al DIANA miRPath v.2.0: investigating the combinatorial effect of microRNAs in pathways. Nucleic Acids Res 2012; 40(web server issue): W498–504. [DOI] [PMC free article] [PubMed] [Google Scholar]
- 25. Lee G, Rodriguez C, Madabhushi A. Investigating the efficacy of nonlinear dimensionality reduction schemes in classifying gene and protein expression studies. IEEE/ACM Trans Comput Biol Bioinf 2008; 5: 368–84. [DOI] [PMC free article] [PubMed] [Google Scholar]
- 26. Pigati L, Yaddanapudi SC, Iyengar R et al Selective release of microRNA species from normal and malignant mammary epithelial cells. PLoS One 2010; 5: e13515. [DOI] [PMC free article] [PubMed] [Google Scholar]
- 27. Yunokawa M, Koizumi F, Kitamura Y et al Efficacy of everolimus, a novel mTOR inhibitor, against basal‐like triple‐negative breast cancer cells. Cancer Sci 2012; 103: 1665–71. [DOI] [PMC free article] [PubMed] [Google Scholar]
Associated Data
This section collects any data citations, data availability statements, or supplementary materials included in this article.
Supplementary Materials
Fig. S1. Expression levels of serum miR‐1246, miR‐1307‐3p and miR‐6875‐5p analyzed using quantitative RT‐PCR (qRT‐PCR).
Table S1. Discriminant analysis for breast cancer with all possible combinations of the five miRNA markers.