

Abstract
Objective
To determine the association between adiposity, hormones, and cognition in young men with abdominal obesity.
Design and Methods
In this cross-sectional observational study, 53 non-diabetic men with abdominal obesity (mean BMI: 37.3 kg/m2; ages 22–45 years) and normal intelligence underwent detailed measures of body composition, hormonal profiles, and cognition. We examined age- and education-adjusted performance in 5 cognitive domains.
Results
Total fat percentage was negatively associated with visuospatial skills (p=0.002) and visual memory (p=0.012). Insulin resistance (HOMA-IR) was also negatively associated with these domains (p=0.05 and trend, p=0.06, respectively). Total testosterone levels were negatively associated with executive function, and verbal learning and memory (p=0.04 for each), but free testosterone was not. SHBG was also inversely associated with performance in these domains (p=0.015 and trend, p=0.09, respectively). In a stepwise regression model including % fat, HOMA-IR, SHBG and free testosterone, SHBG was the only variable selected for executive function (p=0.05), and showed a trend for verbal learning and memory (p=0.09).
Conclusion
Adiposity and insulin resistance were associated with worse function in visual domains, domains with a relative male advantage. We also report an unexpected negative association between SHBG and cognitive measures, which appeared to be independent of free testosterone levels.
Keywords: sex hormones, cognitive function, insulin resistance, obesity, body composition
INTRODUCTION
The obesity epidemic has had considerable impact on health care expenditures, morbidity and mortality.(1) Over the past decade, obesity has been increasingly associated with cognitive decline, particularly in older individuals. In cross-sectional studies, elevated body mass index (BMI), as well as the metabolic syndrome, have been associated with deficits in memory, executive function, processing speed, semantic fluency, and overall cognitive function.(2, 3, 4) Detailed longitudinal studies have shown that elevated BMI is an independent risk factor for accelerated brain atrophy, and increased risk of cognitive decline, including Alzheimer’s disease.(5, 6) In younger individuals, deficits across many cognitive domains have been associated with increasing BMI (7, 8, 9, 10, 11). However, most of these studies have focused either on adolescents or adults closer to age 50, describe patients seeking treatment for their obesity, and use limited measures of either cognition or body composition.
The association between obesity and cognitive impairment may not result solely from such known risk factors (such as dyslipidemia, hypertension, and endothelial dysfunction).(10) In fact, the hormonal milieu associated with obesity may modulate cognitive changes. An elevated risk of dementia in the elderly has been reported with insulin resistance (12, 13, 14) and with lower insulin-like growth factor 1 (IGF-1) levels.(15) However, little is known about hormonal determinants of cognitive function in young, otherwise healthy, men with obesity.
In men, obesity is associated with decreased levels of testosterone,(16) whereas estrogen production is increased by adipocytes in proportion to body weight.(17) Testosterone is one gonadal hormone regulating sex differences in structural neuroanatomy, functional connectivity (18) and cognitive function throughout the life span, beginning during development (19) and adolescence,(20) with relative male strengths in visuospatial function (21) and relative female strengths in verbal learning and memory noted.(22, 23) Studies of testosterone in older men have suggested that testosterone treatment may have protective effects on cognitive decline(24) at optimal levels,(25) and it is being explored as a preventive agent against dementia. However, in mid-life, a more variable (or absent) relationship between testosterone levels and cognition has been reported (e.g.(26)).
In this cross-sectional study of 53 otherwise healthy young men with abdominal adiposity, we tested three hypotheses. First, we hypothesized that adiposity is associated with worse cognitive function. Second, given the relationship between adiposity and glucose homeostasis, we hypothesized that markers of impaired glucose homeostasis are associated with worse cognitive function. Third, we hypothesized that low testosterone levels are associated with worse cognitive function.
METHODS AND PROCEDURES
Subjects
Subjects were recruited from the community through advertisements, to participate in a longitudinal study examining the effects of growth hormone replacement on abdominal obesity.(27, 28) Inclusion criteria were: ages 18–45 years, male sex, BMI ≥ 25 kg/m2, waist circumference >102 cm, stable weight (≤ 5 pounds weight change in preceding 3 months).(28) Exclusion criteria included English as a second language, smoking, hypothalamic or pituitary disorders, diabetes mellitus (by history, or: screening visit fasting glucose ≥ 126 mg/dl or 75-g, 2-hour oral glucose tolerance test (OGTT) glucose ≥ 200 mg/dl), alanine aminotransferase (ALT) levels elevated above 3 times the upper limit of normal, or other chronic illnesses, testosterone or glucocorticoid use, use of statins, anti-hypertensives or regular aspirin use.
Protocol
The study was approved by the Partners HealthCare Inc. institutional review board and written informed consent was obtained from all subjects after full explanation of the purpose and nature of all procedures used. Subjects were admitted to the Clinical Research Center at Massachusetts General Hospital for outpatient testing. Fasting serum was drawn and tested for insulin, glucose, lipids and gonadal hormones (see Endocrine Testing), followed by a 75-g, 2-hour oral glucose tolerance test (OGTT). Glucose and insulin area under the curve (AUC) were calculated. Serum samples were collected and stored at −80° C. Dual-energy x-ray absorptiometry (DXA) was performed to measure body composition (see Body Composition).
Endocrine testing (serum)
IGF-I was measured using an Immulite 2000 Immunoassay System (Siemens Medical Systems, Erlangen, Germany) by a solid-phase enzyme-labeled chemiluminescent immunometric assay with a coefficient of variation (CV) below 5%. Total testosterone was measured by electrochemiluminescence immunoassay (Roche Diagnostics GmbH, Mannheim, Germany) with a within-run CV of 1.2–10.2% for concentrations of 4.5–1450 ng/dL. Sex hormone-binding globulin (SHBG) and estradiol were measured using a chemiluminescent microparticle immunoassay kit from Architect (Abbott Laboratories, Abbott Park, IL) with a within-run CV of 4.78–5.24% and an analytical sensitivity no greater than 0.1 nmol/liter for SHBG and a within-run CV of 1.5–6.4% for concentrations of 45–192 pg/ml and a functional sensitivity no greater than 25 pg/ml for estradiol. 25-hydroxyvitamin D was measured by liquid chromatography/tandem mass spectrometry with a minimum detection limit of 2 ng/ml and a between-run CV of 7.5%.
Homeostatic model assessment of insulin resistance (HOMA-IR) was calculated using the following formula: [glucose (mg/dL)*insulin (mg/dL)/405]. Free testosterone was calculated from total testosterone and SHBG by the laws of mass action.(29) Free estradiol was calculated from total estradiol and SHBG by the laws of mass action.
Body Composition Analysis
Height and weight were measured and BMI (kg/m2) was calculated. Total percentage body fat, lean mass and trunk fat were determined with DXA using a Hologic scanner (Hologic Inc., Waltham, MA).
Cognitive testing
A detailed battery of cognitive tests was administered. Scoring of all cognitive tests was performed at the Massachusetts General Hospital Psychology Assessment Center by a neuropsychologist (JS) and trained psychometrician (SM). Additionally, participants completed the Beck Depression Inventory (BDI-II), a 21-item self-report rating inventory measuring symptoms of depression. All subjects were administered a battery of standardized neuropsychological tests (as detailed in (30) and summarized in Supplementary Table 1).
Statistical analysis
Data were analyzed using the SAS-based software program JMP, version 8.0.1 (Cary, N.C.). We first log-transformed the following body composition and hormonal variables due to non-normal distributions: BMI, HOMA-IR and SHBG.
We converted raw cognitive test results to standard scores scaled to each test’s norming population. We then grouped tests into five cognitive domains, as follows:
Executive function: Delis-Kaplan Executive Function System (D-KEFS) Verbal Fluency (Category Fluency, Category Switching), D-KEFS Color-Word Interference Condition 3 (Inhibition), Trails B
Verbal Learning and Memory: California Verbal Learning Test, Second Edition
Processing Speed: Digit Symbol Test, D-KEFS Color-Word Interference Condition 1 (Color Naming) and Condition 2 (Word Reading), Trails A
Visual Memory: Rey Complex Figure Test (RCFT), Immediate and Delayed Recall)
Visuospatial skills: RCFT Copy
Cognitive domain summary scores for each subject were calculated by first summing the standard scores for each of the test scores within the domain subscales, then dividing by the number of tests included in that domain. For the visuospatial skills domain, RCFT copy performance was scored according to Meyers and Meyers (31) and percentiles were assigned based on the test’s norming population. Given the small number of subjects, performances were categorized into whether they scored above the 5th percentile (“normal” or “low average”) or below (“impaired” and “borderline”). If an individual was missing a score for a given test, then the cognitive domain for that individual was not calculated.
First, we examined the association between body composition parameters and cognitive outcomes. Our primary parameter of interest was % total body fat. We constructed multivariate standard least squares regressions between each cognitive domain score (except for visuospatial skills, when we used logistic regression) and individual body composition (BMI, % total fat, lean mass) measure, adjusting for age and education. Second, using a similar model, we examined the association between insulin resistance (HOMA-IR) and cognitive outcomes. We then added BMI into the models. Third, we examined the association between gonadal hormones and cognitive outcomes. Our primary hormone of interest was total testosterone. Again, we then added BMI into the models. For illustrative purposes, in alternate analyses, for body composition or hormonal measures that were significantly associated with cognitive domains, we additionally categorized these measures as lying below or above the median for the group, and compared the mean performance of subjects in each group using t-tests. We further repeated these analyses, adjusting for baseline IQ using the Wechsler Test of Adult Reading (WTAR).
Given the known strong correlations between body composition, gonadal hormones and glucose homeostasis markers, we sought to determine which associations with cognitive outcomes were independent after adjusting for other measures. To accomplish this, we performed stepwise multivariate regression analyses (forward direction and minimum BIC stopping rule), using measures that were significantly associated with cognitive outcomes. We also included age and education. We reported the relative contribution of each selected variable to the R2 for each cognitive outcome.
RESULTS
Subject characteristics (Table 1)
Table 1.
Demographic and hormonal profiles (N=53)
| Mean (SD) | Median | Range | |
|---|---|---|---|
| DEMOGRAPHIC FEATURES | |||
| Age, years | 33 (6) | 32 | 22–45 |
| Education, years | 15 (2) | 16 | 18–30 |
| BMI, kg/m2 | 37.3 (6.2) | 37.1 | 27.9–53.7 |
| Race | |||
| White | 79% | ||
| Black/African American | 19% | ||
| Other | 2% | ||
| English as primary language | 100% | ||
| Depression scale (BDI) | |||
| Minimal (score 0–9) | 96% | ||
| Moderate (score 19–29) | 4% | ||
| HORMONES | |||
| Glucose homeostasis | |||
| Fasting glucose (mg/dL) | 83.7 (6.2) | 85 | 72–99 |
| Fasting insulin (uU/mL) | 13.6 (8.4) | 13.5 | 2.5–52.2 |
| HOMA-IR | 2.8 (1.7) | 2.6 | 0.5–10.0 |
| IGF-1 z-score | −1.83 (0.45) | −1.88 | −2.57 – −0.68 |
| Gonadal steroids | |||
| Total testosterone (ng/dL) | 380 (124) | 395 | 147 – 634 |
| Free testosterone (ng/dL) | 8.9 (2.6) | 8.9 | 2.9 – 14.4 |
| Total estradiol (pg/mL)* | 33 (10) | 32 | 15 – 58 |
| Free estradiol (pg/mL) | 0.7 (0.2) | 0.6 | 0.3 – 1.2 |
| SHBG (nmol/L) | 26 (10) | 26 | 10–49 |
Abbreviations: BMI, body mass index; BDI, Beck Depression Inventory; HOMA-IR, homeostasis model assessment-insulin resistance; IGF-1, insulin-like growth factor-1; SD, standard deviation; SHBG, sex hormone binding globulin.
Estradiol levels were available for 36 subjects.
Fifty-three subjects were studied and had a mean age of 33 years, a mean BMI of 37.3 kg/m2, and had completed on average 15 years of education. Ninety percent were right-handed. The mean WTAR score was 107 (a score that falls in the average range), and standard deviation (SD) was 15 (standard score centered on mean of 100 and SD of 15), and no subjects scored “extremely low”. Two subjects were “moderately” depressed on BDI. Since there was no correlation between BDI scores and either WTAR or any composite domain score (all p>0.05), these subjects contributed to our analyses. Seventeen men (33%) were hypogonadal (Testosterone levels <300ng/dl, or 10.4 nmol/L). The distribution of body composition and endocrine parameters is presented in Table 1.
Association between metabolic and hormonal variables and cognitive function (Table 2)
Table 2.
Associations between cognitive function and individual body composition and hormonal measures (N=53)
| Executive Function |
Verbal Learning and Memory |
Processing Speed |
Visual Memory |
Visuospatial Skills# |
||||||
|---|---|---|---|---|---|---|---|---|---|---|
| partial correlation coefficient |
p-value | partial correlation coefficient |
p-value | partial correlation coefficient |
p-value | partial correlation coefficient |
p-value | partial correlation coefficient |
p-value | |
| BODY COMPOSITION | ||||||||||
| BMI (log) | −0.09 | 0.56 | −0.05 | 0.73 | 0.03 | 0.86 | −0.25 | 0.08 | −0.27 | 0.055 |
| Total fat % (DXA) | −0.17 | 0.24 | −0.00 | 0.98 | −0.05 | 0.74 | −0.36 | 0.012 | −0.48 | 0.0005* |
| Total Lean mass (DXA) | −0.05 | 0.72 | −0.05 | 0.65 | 0.00 | 0.96 | 0.03 | 0.82 | −0.07 | 0.61 |
| HORMONES | ||||||||||
| Glucose homeostasis | ||||||||||
| HOMA-IR (log) | −0.12 | 0.40 | −0.07 | 0.63 | −0.09 | 0.54 | −0.26 | 0.06 | −0.27 | 0.05 |
| Gonadal steroids | ||||||||||
| Total testosterone | −0.29 | 0.043* | −0.29 | 0.042* | −0.10 | 0.51 | −0.06 | 0.69 | 0.17 | 0.24 |
| Free testosterone | −0.05 | 0.71 | −0.12 | 0.39 | −0.01 | 0.92 | 0.06 | 0.68 | 0.22 | 0.14 |
| SHBG (log) | −0.34 | 0.015* | −0.24 | 0.09 | −0.10 | 0.52 | −0.15 | 0.29 | 0.03 | 0.86 |
Model: Regression models adjusting for age and education. Primary outcomes are underlined. Partial correlation coefficients and p-values are reported. Standard scores were analyzed for the first 4 domains, and raw scores for visuospatial skills domain.
Bolded values represent associations for which the p-value was ≤ 0.05.
- Estimate for 1% increase in total fat: −0.22, p=0.002
- Estimate for 1 log increase in HOMA-IR: −1.10, p=0.05.
Association remains significant (p<0.05) when model further adjusted for BMI.
Abbreviations: AUC, area under the curve; BMI, body mass index; DXA, dual-energy X-ray absorptiometry; HOMA-IR, homeostasis model assessment – insulin resistance; SHBG, sex hormone binding globulin.
Body composition
Total fat percentage was inversely associated with both visual memory and visuospatial skills cognitive domains, in analyses adjusted for age and education. In contrast, BMI and lean mass showed no associations. The association between visual memory and fat percentage is illustrated in Figure 1 Panel A, where the domain means are compared according to whether their % fat measures were below or above the sample median. Adjusting for BMI in the regression models, the association between fat percentage and visuospatial skills remained significant (p<0.05), and with visual memory showed a trend towards significance (p=0.07). Adjusting for WTAR, the associations remained significant.
Figure 1.
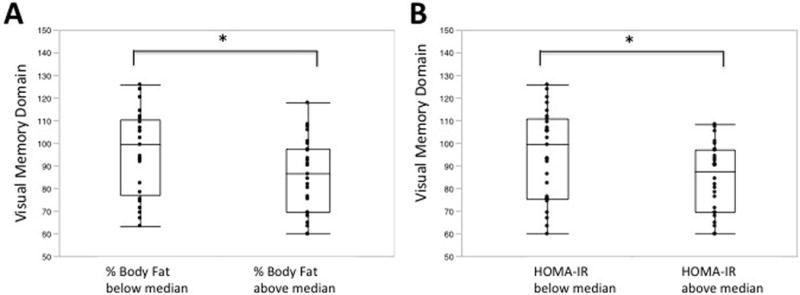
Higher body fat and higher HOMA-IR are associated with lower performance in visual memory. Percentage body fat (Panel A) and HOMA-IR levels (Panel B) were categorized according to the sample median values. * p<0.05.
In secondary analyses, in these subjects with abdominal obesity we also examined DXA trunk fat and found a similar association for visuospatial skills as total fat percentage (p<0.005).
Insulin resistance
HOMA-IR showed a negative association with visuospatial skills (p=0.05); this association was significant after adjusting for WTAR (p<0.01), but was not significant after adjusting for BMI. The association between HOMA-IR and visual memory also showed a trend (p=0.06). When the means for each domain were compared according to whether HOMA-IR was below or above the sample median, significant differences in visual memory (Figure 1 Panel B; p<0.05), as well as executive function, domains were noted.
Gonadal steroids
Total testosterone levels, but not free testosterone levels, were inversely associated with executive function and verbal learning and memory in analyses adjusted for age and education. Adjusting for BMI, these associations remained significant. Adjusting separately for WTAR, these associations remained significant for executive function (p=0.05) and suggestive for verbal learning and memory (p=0.07).
As free testosterone did not demonstrate any significant associations with cognitive domains, we examined the associations between SHBG itself and cognitive measures. SHBG also showed a significant inverse association with executive function, and a trend with verbal learning and memory (p=0.09). Adjusting for BMI, and separately for WTAR, the association with executive function remained significant. The associations between gonadal steroids and cognitive domains are illustrated in Figure 2.
Figure 2.
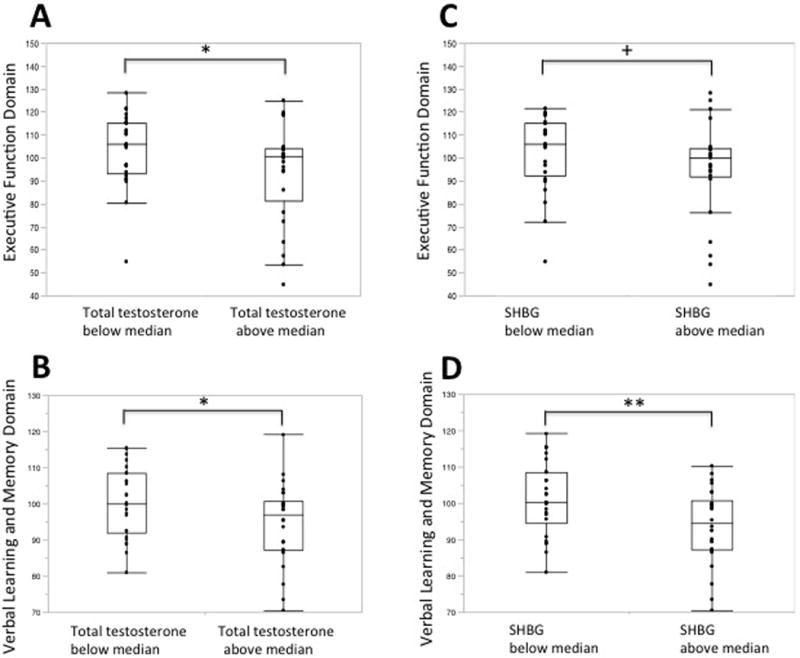
Higher total testosterone and SHBG levels, but not free testosterone, are associated with lower performance in executive function and in verbal learning and memory domains. Total testosterone (Panels A and B), SHBG (Panels C and D) and free testosterone (Panels E and F) levels were categorized according to the sample median values.* p<0.05, ** p<0.01, + p=0.07, not significant.
Given the known inverse association between HOMA-IR and SHBG, adjusting for HOMA-IR, these associations were both strengthened (greater partial correlations) and more statistically significant (p=0.0033 for executive function, 0.04 for verbal learning and memory). Additionally, given that fatty liver could result in impaired SHBG function, we also included serum lipids sequentially in the model; these did not modify the magnitude of the association between SHBG and cognitive outcomes.
Other hormones
No other hormones (2-hour glucose and insulin after OGTT, vitamin D, leptin, IGF-1, total or free estradiol) showed significant associations with cognition.
Multivariate modeling of effects of body composition and hormonal mediators on cognition
Finally, to examine the independent associations of these various, inter-related endocrine measures and cognitive outcomes, we performed stepwise multivariate analysis including the variables that showed significant associations with cognitive domains (% total body fat, HOMA-IR and SHBG), free testosterone as it is the biologically active form of testosterone, as well as age and education. We found that % body fat explained 13% of the variability in visual memory (R2=0.13, p=0.012) and 12% of the variability in visuospatial skills (R2=0.12, p<0.005). SHBG explained 9% (R2=0.09, p=0.0047) of the variability in executive function, with an additional 6% explained by HOMA-IR (R2=0.06, p=0.05). SHBG only showed a trend towards explaining verbal learning and memory in the stepwise model (R2=0.06, p=0.09).
DISCUSSION
In this study of young ambulatory men with abdominal obesity who underwent detailed characterization of body composition, hormonal profiles and cognitive function, we report three main findings. First, higher levels of both SHBG (as well as total, but not free, testosterone) were associated with worse cognitive function. Second, this association appeared to be independent of insulin resistance, which was also associated with cognitive function. Third, adiposity was associated with relative deficits in visual memory and visuospatial ability, domains in which men typically have a relative advantage. In most domains, our biomarkers were associated with relative, rather than absolute, cognitive deficits. In the visuospatial skills domain, where more individuals showed impairment, % fat and HOMA-IR were significantly different between individuals with and without impairment.
By including detailed measures of adiposity and cognition and focusing on young, ambulatory, otherwise healthy men with abdominal obesity, our findings extend previously reported associations between increasing BMI and relative deficits in cognitive performance (7, 8, 10). Most of these prior studies focus either on adolescents (11) or middle-aged adults (e.g. mean age 49 (10)), describe patients specifically presenting for treatment of their obesity (e.g.(11, 32)), and use limited measures of either cognitive outcome (e.g. executive function (8)) or body composition (e.g. BMI (10)). In young, otherwise healthy women with abdominal adiposity, we recently reported that higher BMI and fat mass were associated with relative deficits in the domains of verbal learning and memory, executive function, and processing speed.(33) Our current findings suggest that adiposity may also impact young men. Interestingly, adiposity appeared to be associated with relative deficits in cognitive domains in which each sex may have relative strengths (visual function in men, verbal function in women).
Insulin resistance is one hormonal mechanism through which adiposity might impact cognitive in elderly (12, 13) and older middle aged (2, 34) individuals. Here, HOMA-IR was associated with visual domains, and, taken together with our report of insulin resistance and relative cognitive deficits in women,(33) our findings suggest that insulin resistance may begin to adversely impact cognition in young adulthood.
While we had initially hypothesized that testosterone levels would be positively associated with cognition, we found the opposite. Others have noted a similar inverse relationship between testosterone levels and cognitive performance, suggesting complex gonadal effects on brain function (e.g.(26)). Further, in the current study, this association appeared to be partially driven by SHBG, and not reflective of free testosterone. In men with obesity, reduction in total testosterone generally occurs secondary to decreased SHBG levels, while free testosterone is generally preserved, except in men with morbid obesity.(35) SHBG is produced in hepatocytes and is decreased in adiposity, particularly in men with fatty liver. Interestingly, higher levels of SHBG, including through genetic mutations, have been associated with reduced risk of diabetes mellitus type 2 in two large studies.(36, 37) It is controversial whether this association suggests an effect of SHBG or reflects the known association between states of high insulin resistance and both lower SHBG levels as well as a higher risk of diabetes mellitus type 2.(38) In our study, if SHBG associations with cognitive function arose mainly through a shared mechanism of insulin resistance, it would be expected that lower and not higher levels of SHBG were associated with worse cognition. We specifically assessed whether SHBG plays a role in cognitive function that is independent of insulin resistance, by adjusting for HOMA-IR, and the SHBG relationship with cognition was only strengthened. Additionally, because we excluded individuals with signficant elevations of ALT or known liver disease, it is unlikely that effects of liver disease on SHBG account for the relationship between SHBG and cognitive outcomes. Generally, a physiologic role for SHBG, independent of its known regulation of free hormone access to cells has not been widely recognized; but there is modest evidence that elevated SHBG represents a risk for cognitive decline and Alzheimer’s disease, independent of BMI and gonadal hormones.(39) Further, a recent paper reported an association between higher SHBG levels and lower delayed verbal memory scores in a cohort of 112 men with mean age of 61 years.(40) Putative mechanisms in humans, including effects of SHBG on gonadal steroid delivery to the brain, remain to be elucidated.
While this study included detailed measures of cognitive function, body composition and hormonal profiles, there were four main limitations. First, the cross-sectional nature of the data preclude inferring causality. Thus, we cannot ascertain whether relative cognitive dysfunction results in behaviors leading to weight gain, or whether obesity causes relative cognitive dysfunction. Second, there were small numbers overall in this exploratory study. Third, when we assessed that the findings relating to testosterone and SHBG were not driven by estrogenic effects, estradiol levels were only available for a subset of men. Fourth, while the members of our cohort were included because of their abdominal obesity, and we found associations between abdominal obesity and cognition, we could not differentiate here between the relative contributions of different adipose depots; a future study examining this would be worthwhile. Finally, as no individuals with normal weight were included, it is not possible to determine whether in healthy weight ranges, there is a similar association between % body fat or hormonal measures, and cognitive outcomes.
In conclusion, we found associations between adiposity measures and insulin resistance, and cognitive function in young otherwise healthy men with abdominal adiposity; however, it was not possible to determine causality. Additionally, SHBG, as well as total testosterone, was inversely associated with executive function independently of glucose homeostasis. A potential role for SHBG in mediating cognition, independent of its association with insulin resistance, should be further assessed.
Supplementary Material
WHAT IS ALREADY KNOWN ABOUT THIS SUBJECT
Adiposity in midlife is associated with greater longitudinal cognitive decline; in young adults, adiposity has been associated with lower cross-sectional cognitive performance.
The hormonal milieu associated with adiposity may influence cognitive performance.
In young women with adiposity, we previously reported an association between body composition and verbal learning and memory; as well as a negative association between the degree of insulin resistance and executive function.
WHAT THIS STUDY ADDS
In this cohort of young men with obesity, total fat percentage was negatively associated with performance in visual domains, domains in which men may have relative advantages.
Higher levels of sex hormone binding globulin levels, as well as of total but not free testosterone, were associated with worse executive function, and verbal learning and memory.
Insulin resistance showed additional, independent negative associations with cognitive outcomes.
Acknowledgments
We thank the study participants for their participation in the study, the study coordinators, and the Clinical Research Staff for their contributions.
Research support
This research was supported by R01 HL-077674, K23 RR-23090, K24 HL092902-03, and UL1 RR-025758.
This work was conducted with support from Harvard Catalyst | The Harvard Clinical and Translational Science Center (National Center for Research Resources and the National Center for Advancing Translational Sciences, National Institutes of Health Award UL1 TR001102) and financial contributions from Harvard University and its affiliated academic healthcare centers. The content is solely the responsibility of the authors and does not necessarily represent the official views of Harvard Catalyst, Harvard University and its affiliated academic healthcare centers, or the National Institutes of Health.
Footnotes
CONFLICTS OF INTEREST STATEMENT
Disclosures
None of the manuscript authors have any conflicts of interest relative to this manuscript to declare.
Author Contributions. RB, JS, MB and KKM contributed to the design of the study, interpretation of data, and manuscript preparation. AVG contributed to the acquisition of data. SMM contributed to the interpretation of cognitive data. All authors were involved in writing the paper and had final approval of the submitted and published versions.
References
- 1.Hedley AA, Ogden CL, Johnson CL, Carroll MD, Curtin LR, Flegal KM. Prevalence of overweight and obesity among US children, adolescents, and adults, 1999–2002. Jama. 2004;291:2847–2850. doi: 10.1001/jama.291.23.2847. [DOI] [PubMed] [Google Scholar]
- 2.Schuur M, Henneman P, van Swieten JC, Zillikens MC, de Koning I, Janssens AC, et al. Insulin-resistance and metabolic syndrome are related to executive function in women in a large family-based study. European journal of epidemiology. 2010;25:561–568. doi: 10.1007/s10654-010-9476-y. [DOI] [PMC free article] [PubMed] [Google Scholar]
- 3.Segura B, Jurado MA, Freixenet N, Albuin C, Muniesa J, Junque C. Mental slowness and executive dysfunctions in patients with metabolic syndrome. Neurosci Lett. 2009;462:49–53. doi: 10.1016/j.neulet.2009.06.071. [DOI] [PubMed] [Google Scholar]
- 4.Hassenstab JJ, Sweat V, Bruehl H, Convit A. Metabolic syndrome is associated with learning and recall impairment in middle age. Dement Geriatr Cogn Disord. 2010;29:356–362. doi: 10.1159/000296071. [DOI] [PMC free article] [PubMed] [Google Scholar]
- 5.Gunstad J, Lhotsky A, Wendell CR, Ferrucci L, Zonderman AB. Longitudinal examination of obesity and cognitive function: results from the Baltimore longitudinal study of aging. Neuroepidemiology. 2010;34:222–229. doi: 10.1159/000297742. [DOI] [PMC free article] [PubMed] [Google Scholar]
- 6.Gustafson D, Lissner L, Bengtsson C, Bjorkelund C, Skoog I. A 24-year follow-up of body mass index and cerebral atrophy. Neurology. 2004;63:1876–1881. doi: 10.1212/01.wnl.0000141850.47773.5f. [DOI] [PubMed] [Google Scholar]
- 7.Gunstad J, Paul RH, Cohen RA, Tate DF, Spitznagel MB, Gordon E. Elevated body mass index is associated with executive dysfunction in otherwise healthy adults. Comprehensive psychiatry. 2007;48:57–61. doi: 10.1016/j.comppsych.2006.05.001. [DOI] [PubMed] [Google Scholar]
- 8.Fergenbaum JH, Bruce S, Lou W, Hanley AJ, Greenwood C, Young TK. Obesity and lowered cognitive performance in a Canadian First Nations population. Obesity (Silver Spring) 2009;17:1957–1963. doi: 10.1038/oby.2009.161. [DOI] [PubMed] [Google Scholar]
- 9.Etou H, Sakata T, Fujimoto K, Kurata K, Terada K, Fukagawa K, et al. Characteristics of psychomotor performance and time cognition in moderately obese patients. Physiology & behavior. 1989;45:985–988. doi: 10.1016/0031-9384(89)90225-4. [DOI] [PubMed] [Google Scholar]
- 10.Nilsson LG, Nilsson E. Overweight and cognition. Scandinavian journal of psychology. 2009;50:660–667. doi: 10.1111/j.1467-9450.2009.00777.x. [DOI] [PubMed] [Google Scholar]
- 11.Lokken KL, Boeka AG, Austin HM, Gunstad J, Harmon CM. Evidence of executive dysfunction in extremely obese adolescents: a pilot study. Surgery for obesity and related diseases: official journal of the American Society for Bariatric Surgery. 2009;5:547–552. doi: 10.1016/j.soard.2009.05.008. [DOI] [PubMed] [Google Scholar]
- 12.Cholerton B, Baker LD, Craft S. Insulin resistance and pathological brain ageing. Diabetic medicine: a journal of the British Diabetic Association. 2011;28:1463–1475. doi: 10.1111/j.1464-5491.2011.03464.x. [DOI] [PubMed] [Google Scholar]
- 13.Crichton GE, Elias MF, Buckley J, Murphy KJ, Bryan J, Frisardi V. Metabolic Syndrome, Cognitive Performance, and Dementia. J Alzheimers Dis. 2011;30:S77–87. doi: 10.3233/JAD-2011-111022. [DOI] [PubMed] [Google Scholar]
- 14.Benedict C, Brooks SJ, Kullberg J, Burgos J, Kempton MJ, Nordenskjold R, et al. Impaired insulin sensitivity as indexed by the HOMA score is associated with deficits in verbal fluency and temporal lobe gray matter volume in the elderly. Diabetes Care. 2012;35:488–494. doi: 10.2337/dc11-2075. [DOI] [PMC free article] [PubMed] [Google Scholar]
- 15.Okereke O, Kang JH, Ma J, Hankinson SE, Pollak MN, Grodstein F. Plasma IGF-I levels and cognitive performance in older women. Neurobiol Aging. 2007;28:135–142. doi: 10.1016/j.neurobiolaging.2005.10.012. [DOI] [PubMed] [Google Scholar]
- 16.Pasquali R. Obesity and androgens: facts and perspectives. Fertil Steril. 2006;85:1319–1340. doi: 10.1016/j.fertnstert.2005.10.054. [DOI] [PubMed] [Google Scholar]
- 17.Kokkoris P, Pi-Sunyer FX. Obesity and endocrine disease. Endocrinol Metab Clin North Am. 2003;32:895–914. doi: 10.1016/s0889-8529(03)00078-1. [DOI] [PubMed] [Google Scholar]
- 18.Peper JS, van den Heuvel MP, Mandl RC, Hulshoff Pol HE, van Honk J. Sex steroids and connectivity in the human brain: a review of neuroimaging studies. Psychoneuroendocrinology. 2011;36:1101–1113. doi: 10.1016/j.psyneuen.2011.05.004. [DOI] [PubMed] [Google Scholar]
- 19.Nugent BM, McCarthy MM. Epigenetic underpinnings of developmental sex differences in the brain. Neuroendocrinology. 2011;93:150–158. doi: 10.1159/000325264. [DOI] [PMC free article] [PubMed] [Google Scholar]
- 20.Koolschijn PC, Peper JS, Crone EA. The influence of sex steroids on structural brain maturation in adolescence. PLoS One. 2014;9:e83929. doi: 10.1371/journal.pone.0083929. [DOI] [PMC free article] [PubMed] [Google Scholar]
- 21.Clint EK, Sober E, Garland T, Jr, Rhodes JS. Male superiority in spatial navigation: adaptation or side effect? Q Rev Biol. 2012;87:289–313. doi: 10.1086/668168. [DOI] [PubMed] [Google Scholar]
- 22.Maccoby E, Jacklin C. The Psychology of Sex Differences. Stanford University Press; 1974. [Google Scholar]
- 23.Andreano JM, Cahill L. Sex influences on the neurobiology of learning and memory. Learn Mem. 2009;16:248–266. doi: 10.1101/lm.918309. [DOI] [PubMed] [Google Scholar]
- 24.Rosario ER, Chang L, Stanczyk FZ, Pike CJ. Age-related testosterone depletion and the development of Alzheimer disease. Jama. 2004;292:1431–1432. doi: 10.1001/jama.292.12.1431-b. [DOI] [PubMed] [Google Scholar]
- 25.Holland J, Bandelow S, Hogervorst E. Testosterone levels and cognition in elderly men: A review. Maturitas. 2011;69:322–337. doi: 10.1016/j.maturitas.2011.05.012. [DOI] [PubMed] [Google Scholar]
- 26.Yonker JE, Eriksson E, Nilsson LG, Herlitz A. Negative association of testosterone on spatial visualization in 35 to 80 year old men. Cortex. 2006;42:376–386. doi: 10.1016/s0010-9452(08)70364-2. [DOI] [PubMed] [Google Scholar]
- 27.Bredella MA, Lin E, Brick DJ, Gerweck AV, Harrington LM, Torriani M, et al. Effects of GH in women with abdominal adiposity: a 6-month randomized, double-blind, placebo-controlled trial. Eur J Endocrinol. 2012;166:601–611. doi: 10.1530/EJE-11-1068. [DOI] [PMC free article] [PubMed] [Google Scholar]
- 28.Bredella MA, Gerweck AV, Lin E, Landa MG, Torriani M, Schoenfeld DA, et al. Effects of GH on body composition and cardiovascular risk markers in young men with abdominal obesity. J Clin Endocrinol Metab. 2013;98:3864–3872. doi: 10.1210/jc.2013-2063. [DOI] [PMC free article] [PubMed] [Google Scholar]
- 29.Vermeulen A, Verdonck L, Kaufman JM. A critical evaluation of simple methods for the estimation of free testosterone in serum. J Clin Endocrinol Metab. 1999;84:3666–3672. doi: 10.1210/jcem.84.10.6079. [DOI] [PubMed] [Google Scholar]
- 30.Strauss E, Sherman EMS, Spreen O. A Compendium of Neuropsychological Tests: Administration, Norms and Commentary Third Edition. Oxford University Press; Oxford: 2006. [Google Scholar]
- 31.Meyers JE, Meyers KR. Rey complex figure test and recognition trial: Professional manual. Psychological Assessment Resources; Lutz, FL: 1995. [Google Scholar]
- 32.Chelune G OD, Linton J, Boustany M. Personality and cognitive findings among patients electing gastroplasty for morbid obesity. Int J Eat Disord. 1986;5:701–712. [Google Scholar]
- 33.Bove RM, Brick DJ, Healy BC, Mancuso SM, Gerweck AV, Bredella MA, et al. Metabolic and endocrine correlates of cognitive function in healthy young women. Obesity (Silver Spring) 2013;21:1343–1349. doi: 10.1002/oby.20212. [DOI] [PMC free article] [PubMed] [Google Scholar]
- 34.Gonzales MM, Tarumi T, Miles SC, Tanaka H, Shah F, Haley AP. Insulin sensitivity as a mediator of the relationship between BMI and working memory-related brain activation. Obesity (Silver Spring) 2010;18:2131–2137. doi: 10.1038/oby.2010.183. [DOI] [PubMed] [Google Scholar]
- 35.Teerds KJ, de Rooij DG, Keijer J. Functional relationship between obesity and male reproduction: from humans to animal models. Hum Reprod Update. 2011;17:667–683. doi: 10.1093/humupd/dmr017. [DOI] [PubMed] [Google Scholar]
- 36.Ding EL, Song Y, Manson JE, Hunter DJ, Lee CC, Rifai N, et al. Sex hormone-binding globulin and risk of type 2 diabetes in women and men. N Engl J Med. 2009;361:1152–1163. doi: 10.1056/NEJMoa0804381. [DOI] [PMC free article] [PubMed] [Google Scholar]
- 37.Perry JR, Weedon MN, Langenberg C, Jackson AU, Lyssenko V, Sparso T, et al. Genetic evidence that raised sex hormone binding globulin (SHBG) levels reduce the risk of type 2 diabetes. Hum Mol Genet. 2010;19:535–544. doi: 10.1093/hmg/ddp522. [DOI] [PMC free article] [PubMed] [Google Scholar]
- 38.Semple R, Savage DB, O’Rahilly S. Sex hormone-binding globulin and risk of type 2 diabetes. N Engl J Med. 2009;361:2677. author reply 2677–2678. [PubMed] [Google Scholar]
- 39.Muller M, Schupf N, Manly JJ, Mayeux R, Luchsinger JA. Sex hormone binding globulin and incident Alzheimer’s disease in elderly men and women. Neurobiol Aging. 2010;31:1758–1765. doi: 10.1016/j.neurobiolaging.2008.10.001. [DOI] [PMC free article] [PubMed] [Google Scholar]
- 40.Takayanagi Y, Spira A, McIntyre R, Eaton W. Sex hormone binding globulin and verbal memory in older men. American Journal of Geriatric Psychiatry. 2015;23:253–260. doi: 10.1016/j.jagp.2013.02.003. [DOI] [PMC free article] [PubMed] [Google Scholar]
Associated Data
This section collects any data citations, data availability statements, or supplementary materials included in this article.