

Abstract
KDIGO guidelines recommend dietary phosphate restriction to lower serum phosphate levels in CKD stage 3-5. Recent studies suggest that dietary phosphate intake is only weakly linked to its serum concentration, and the relationship of phosphate intake with adverse outcomes is uncertain. To further evaluate this, we used Cox proportional hazards models to assess associations of baseline 24 hour urine phosphate excretion with risk of end stage renal disease (ESRD), all-cause mortality, and mortality subtypes (cardiovascular disease (CVD) and non-CVD) using the Modification of Diet in Renal Disease data. Models were adjusted for demographics, CVD risk factors, iothalamate GFR, and urine protein and nitrogen excretion. Phosphate excretion was modestly inversely correlated with serum phosphate concentrations. There was no association of 24 hour urinary phosphate excretion with risk of ESRD, CVD-, non-CVD- or all-cause mortality. For comparison, higher serum phosphate concentrations were associated with all-cause mortality (hazard ratio per 0.7 mg/dL higher, 1.15 [95% CI 1.01, 1.30]). Thus, phosphate intake is not tightly linked with serum phosphate concentrations in CKD stage 3-5, and there was no evidence that greater phosphate intake, assessed by 24 hour phosphate excretion, is associated with ESRD, CVD-, non CVD-, or all-cause mortality in CKD stage 3-5. Hence, factors other than dietary intake may be key determinants of serum phosphate concentrations and require additional investigation.
Keywords: Mineral metabolism, cardiovascular disease, nutrition, USRDS
Introduction
In patients with kidney failure receiving maintenance dialysis, higher serum phosphate concentrations are associated with mortality and cardiovascular disease (CVD) events.(1) Experimental studies demonstrate that higher extra-cellular phosphate induces transformation of vascular smooth muscle cells into osteoblast-like cells, and promotes deposition of calcium in the vascular wall,(2) potentially exacerbating vascular stiffness and cardiac afterload. In patients on dialysis, dietary phosphate intake is a key determinant of serum phosphate concentrations, and conversely limiting phosphate intake significantly reduces serum phosphate concentrations.(3)
More recently, higher serum phosphate concentrations have been linked with risk of death, CVD, and progression to ESRD in patients with earlier stages of CKD,(4) and even among persons with ostensibly normal kidney function.(5, 6) In 2009, Kidney Disease: Improving Global Outcomes (KDIGO) international consensus guidelines work-group recommended maintenance of serum phosphate concentrations within the normal laboratory range in persons with CKD stage 3-5. KDIGO recommended use of intestinal phosphate binders and limiting dietary phosphate intake as methods to accomplish this goal.(7) Thus, a key tenet of the KDIGO recommendations was that intestinal phosphate absorption is a key determinant of serum phosphate concentrations in patients with CKD stage 3-5, similar to dialysis patients, and that methods used to lower phosphate in dialysis would be effective in CKD stage 3-5. However, in 2009, there were little data demonstrating the effects of alterations in intestinal phosphate absorption on serum phosphate concentrations in earlier stages of CKD. Since that time, several new lines of evidence question that assumption. Several studies have demonstrated only modest or altogether absent correlations between dietary phosphate intake and serum phosphate concentrations.(8, 9) For example, using 24 hour urine phosphate excretion (UPE) as the clinical gold standard for assessing intestinal phosphate absorption, randomized clinical trials evaluating high doses of intestinal phosphate binders in CKD stage 3-5 have shown marked reductions in 24 hour UPE, but only minimally altered serum phosphate concentrations.(10) Several smaller randomized trials found no effect of binders on serum phosphate concentrations.(9, 11, 12) In the Modification of Diet in Renal Disease (MDRD) Study, we previously demonstrated that randomization to a low protein / low phosphate diet substantially lowered 24 hour UPE but had minimal effects on serum phosphate concentrations.(13) These findings suggest that factors other than intestinal phosphate absorption may be the major determinants of serum phosphate concentrations in CKD stage 3-5. If so, then use of intestinal phosphate binders or dietary phosphate restriction may not significantly lower serum phosphate concentrations, leaving it unclear if these interventions would translate into improvements in clinical outcomes in CKD stage 3-5. However, data evaluating relationships of dietary phosphate intake with clinically meaningful outcomes in CKD stage 3-5 are lacking.
Participants in the MDRD study provided 24 hour urine collections at baseline prior to randomization which were measured for phosphate content, providing a reliable marker of intestinal phosphate absorption. Iothalamate measures of glomerular filtration rate (GFR), proteinuria, and 24 hour urine urea nitrogen excretion (a marker of dietary protein intake) were measured concurrently. Long-term follow-up is available in MDRD to evaluate associations with ESRD, cardiovascular-, non-cardiovascular-, and all-cause mortality. As prior studies in CKD stage 3-5 evaluating the strength of association of intestinal phosphate absorption with serum phosphate, and the association of intestinal phosphate absorption with clinical endpoints are lacking, we set forth to assess the relationship of 24 hour UPE with ESRD, cardiovascular-, non-cardiovascular- and all-cause mortality in patients with CKD stage 3-5 in the MDRD Study.
Results
Participant Characteristics
Among the 795 participants in this study, the mean age ± standard deviation (SD) was 52 ± 12 years, 60% were male, 15% were non-white. The mean iothalamate GFR ± SD was 33 ± 12 ml/min/1.73m2, mean serum phosphate ± SD was 3.8 ± 0.7 mg/dL, and mean 24-hour UPE ± SD was 821 ± 285 mg/day. Baseline characteristics by quartiles of 24-hour UPE are shown in Table 1 (Data stratified by MDRD Study A and Study B are provided in Supplemental Table 1). Compared to those with lower UPE, participants in higher UPE quartiles were more frequently male and white, were more likely to be in the usual protein arm, had higher BMI, GFR, serum albumin, total caloric intake, and urine creatinine, and urea nitrogen excretion rates, and lower serum phosphorus and HDL concentrations. Participants with higher UPE were also less likely to be taking intestinal phosphate binders. When evaluated as continuous variables, the Pearson correlation of 24 hour UPE with serum phosphate was inverse and statistically significant, but quite modest (ρ = -0.12 [95% CI -0.18, -0.05]). When this association was adjusted for iothalamate GFR, the inverse association was attenuated and rendered no longer statistically significant (Figure 1).
Table 1. Baseline Characteristics of MDRD Study Participants by Quartiles of 24-hour Urine Phosphate Excretion.
| Variable | Total | UPE Q1 | UPE Q2 | UPE Q3 | UPE Q4 | p value |
|---|---|---|---|---|---|---|
| 24-Hr UPE range of quartiles (mg/day) | 100-608 | 609-790 | 791-1009 | 1010-2211 | ||
| Participants, n (%) | 795 | 198 (25%) | 200 (25%) | 199 (25%) | 198 (25%) | |
|
| ||||||
| Age (years ± SD) | 51.8 ± 12.4 | 51.7 ± 12.1 | 50.7 ± 13.1 | 53.8 ± 12.8 | 50.9 ± 11.6 | 0.95 |
| Male, n (%) | 479 (60%) | 61 (31%) | 102 (51%) | 139 (70%) | 177 (89%) | <0.001 |
| Non-white, n (%) | 117 (15%) | 48 (24%) | 33 (17%) | 23 (12%) | 13 (7%) | <0.001 |
| Current smoker, n (%) | 78 (10%) | 13 (7%) | 17 (9%) | 30 (15%) | 18 (9%) | 0.13 |
| Diabetes mellitus, n (%) | 40 (5%) | 7 (4%) | 12 (6%) | 9 (5%) | 12 (6%) | 0.38 |
| Prevalent CVD, n (%) | 102 (13%) | 21 (11%) | 20 (10%) | 39 (20%) | 22 (11%) | 0.29 |
| Causes of CKD | 0.53 | |||||
| Polycystic kidney disease, n (%) | 191 (24%) | 51 (26%) | 47 (24%) | 51 (26%) | 42 (21%) | |
| Glomerulonephritis, n (%) | 247 (31%) | 59 (30%) | 58 (29%) | 63 (32%) | 67 (34%) | |
| Other, n (%) | 357 (45%) | 88 (44%) | 95 (48%) | 85 (43%) | 89 (45%) | |
| Diet group | 0.001 | |||||
| Very low protein diet n (%) | 121 (15%) | 37 (19%) | 33 (17%) | 31 (16%) | 20 (10%) | |
| Low protein diet n (%) | 395 (50%) | 107 (54%) | 103 (52%) | 90 (45%) | 95 (48%) | |
| Usual protein diet n (%) | 279 (35%) | 54 (27%) | 64 (32%) | 78 (39%) | 83 (42%) | |
| Blood pressure strata | 0.06 | |||||
| Usual blood pressure target n (%) | 390 (49%) | 89 (45%) | 91 (46%) | 107 (54%) | 103 (52%) | |
| Low blood pressure target n (%) | 405 (51%) | 109 (55%) | 109 (55%) | 92 (46%) | 95 (48%) | |
| Systolic blood pressure (mmHg ± SD) | 132 ± 17 | 132 ± 19 | 132 ± 18 | 133 ± 17 | 131 ± 16 | 0.88 |
| Body mass index (kg/m2 ± SD) | 27.1 ± 4.5 | 25.2 ± 4.3 | 26.6 ± 4.3 | 27.9 ± 4.2 | 29.0 ± 4.3 | <0.001 |
| Phosphate binder use n (%) | 60 (8%) | 22 (11%) | 15 (8%) | 16 (8%) | 7 (4%) | <0.01 |
| Baseline mGFR (mL/min/1.73m2 ± SD) | 33 ± 12 | 30 ± 12 | 31 ± 12 | 33 ± 12 | 36 ± 12 | <0.001 |
| CKD Stage | <0.001 | |||||
| 3a n (%) | 154 (19%) | 26 (13%) | 32 (16%) | 40 (20%) | 56 (28%) | |
| 3b n (%) | 275 (35%) | 55 (28%) | 63 (32%) | 79 (40%) | 78 (39%) | |
| 4 n (%) | 317 (40%) | 100 (51%) | 85 (43%) | 73 (37%) | 59 (30%) | |
| 5 n (%) | 49 (6%) | 17 (9%) | 20 (10%) | 7 (4%) | 5 (3%) | |
| Serum phosphorus (mg/dL ± SD) | 3.8 ± 0.7 | 3.8 ± 0.6 | 3.8 ± 0.8 | 3.7 ± 0.7 | 3.7 ± 0.7 | <0.001 |
| Serum albumin (g/dL ± SD) | 4.0 ± 0.3 | 4.0 ± 0.3 | 4.0 ± 3.0 | 4.0 ± 0.3 | 4.1 ± 0.4 | <0.01 |
| Transferrin (mg/dL ± SD) | 274 ± 46 | 270 ± 46 | 277 ± 49 | 275 ± 43 | 273 ± 46 | 0.54 |
| HDL cholesterol (mg/dL ± SD) | 40 ± 14 | 46 ± 16 | 42 ± 15 | 38 ± 14 | 34 ± 10 | <0.001 |
| Total caloric intake (kcal/kg/day ± SD) | 26.3 ± 7.6 | 25.2 ± 7.3 | 25.4 ± 6.9 | 26.8 ± 7.2 | 27.9 ± 8.5 | <0.001 |
| 24-Hr urine creatinine excretion (mg/day ± SD) | 1406 ± 415 | 1087 ± 285 | 1283 ± 328 | 1451 ± 317 | 1805 ± 351 | <0.001 |
| 24-Hr urine urea nitrogen excretion (g/day ± SD) | 9.7 ± 2.8 | 8.3 ± 2.5 | 9.0 ± 2.6 | 10.1 ± 2.6 | 11.4 ± 2.6 | <0.001 |
| 24-Hr urine protein excretion (g/day median (25th, 75th)) | 0.3 (0.1, 1.4) | 0.3 (0.1, 1.2) | 0.3 (0.1, 1.2) | 0.2 (0.1, 1.5) | 0.5 (0.1, 2.0) | 0.56 |
Abbreviations: SD= standard deviation; UPE Q= 24-Hour urine phosphorus excretion quartile; CVD= cardiovascular disease; CKD=chronic kidney disease; GFR=glomerular filtration rate; HDL=high density lipoprotein
Figure 1. Scatter Plot of 24 Hour Urine Phosphate Excretion with Serum Phosphate in the MDRD Study.
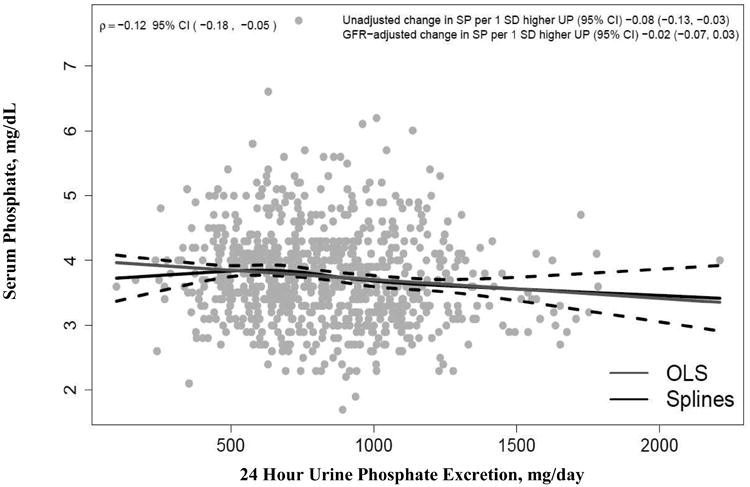
Data show the relationship of baseline 24 hour urine phosphate excretion with fasting morning serum phosphate concentrations in the 795 MDRD study participants. The Pearson correlation (ρ) was -0.12 (95% confidence interval -0.18, -0.05). The weak association between serum phosphate and 24 hour urine phosphate excretion disappears after adjustment for GFR (unadjusted change in serum phosphate per 1 SD higher 24 hour urine phosphate excretion is -0.08 with 95% confidence interval -0.13, -0.03, and GFR adjusted change in serum phosphate per 1SD higher 24 hour urine phosphate excretion is -0.02 with 95% confidence interval -0.07, 0.03). OLS shows the ordinal least squares regression line (blue). The restricted cubic spline function shows the best fit line (solid black line) and 95% confidence intervals (dashed black lines).
Associations of 24 hour Urine Phosphate Excretion with Risk of ESRD, Cardiovascular-, Non-Cardiovascular-, and All-Cause Mortality
The mean follow-up was 16 years (range 0.25-22), during which 589 of the 795 participants progressed to ESRD (incidence rate 9.04 per 100 person-years [PYs]), 191 participants died due to CVD (1.55 per 100 PYs), and 228 participants died due to non-CVD causes (1.85 per 100 PYs) constituting 419 deaths from all causes (3.40 per 100 PYs). Table 2 shows the relationships of 24 hour UPE with each of these outcomes. An initial model adjusted for demographics, a second added measured GFR, proteinuria, and urea nitrogen excretion, and a final model additionally added CVD risk factors, total caloric intake, phosphate binder use, and randomized diet and blood pressure strata. When evaluated by UPE quartiles, we observed fairly linear relationships with each outcome and therefore we focus on the continuous analysis evaluating associations per 1 SD unit (285 mg/d) higher 24 hour UPE. We observed no statistically significant associations of 24 hour UPE with any of the four outcomes, in either minimally adjusted or fully adjusted models. There were no interactions by randomized treatment arm for any of the 4 outcomes in the fully adjusted model (p interactions all > 0.05). Similar results were observed when we evaluated individuals in Study A and Study B separately (Supplemental Table 2).
Table 2. Association of 24 hour Urine Phosphate Excretion with Incident ESRD, CVD-, Non-CVD-, and All-Cause Mortality in the MDRD Study.
| 24-Hr UPE range of (mg/day)quartiles | Q1 100-608 | Q2 609-788 | Q3 791-1008 | Q4 1010-2211 | Continuous (per SD higher) | p-value |
|---|---|---|---|---|---|---|
| ESRD | ||||||
| #Events/# at Risk | 145/198 | 153/200 | 144/199 | 147/198 | 589/795 | |
| Event rate (per 100 PY) | 9.62 | 8.97 | 9.06 | 8.58 | 9.04 | |
| Model 1: HR (95% CI) | 1.00 (Reference) | 0.93 (0.74, 1.17) | 0.91 (0.71, 1.16) | 0.85 (0.65, 1.10) | 0.93 (0.85, 1.02) | 0.13 |
| Model 2: HR (95% CI) | 1.00 (Reference) | 0.93 (0.73, 1.17) | 1.03 (0.81, 1.32) | 1.05 (0.80, 1.38) | 1.02 (0.93, 1.13) | 0.64 |
| Model 3: HR (95% CI) | 1.00 (Reference) | 0.98 (0.77, 1.24) | 1.03 (0.79, 1.33) | 1.10 (0.82, 1.46) | 1.04 (0.94, 1.15) | 0.48 |
| CVD Mortality | ||||||
| #Events/# at Risk | 43/198 | 50/200 | 54/199 | 44/198 | 191/795 | |
| Event rate (per 100 PY) | 1.39 | 1.56 | 1.84 | 1.42 | 1.55 | |
| Model 1: HR (95% CI) | 1.00 (Reference) | 1.03 (0.68, 1.57) | 1.02 (0.67, 1.56) | 0.80 (0.50, 1.27) | 0.93 (0.79, 1.10) | 0.40 |
| Model 2: HR (95% CI) | 1.00 (Reference) | 1.08 (0.71, 1.65) | 1.12 (0.73, 1.72) | 0.94 (0.57, 1.53) | 1.00 (0.84, 1.20) | 0.99 |
| Model 3: HR (95% CI) | 1.00 (Reference) | 1.12 (0.73, 1.72) | 1.08 (0.69, 1.70) | 0.93 (0.56, 1,56) | 1.00 (0.82, 1.21) | 0.97 |
| Non-CVD Mortality | ||||||
| #Events/# at Risk | 57/198 | 51/200 | 55/199 | 65/198 | 228/795 | |
| Event rate (per 100 PY) | 1.84 | 1.59 | 1.87 | 2.10 | 1.85 | |
| Model 1: HR (95% CI) | 1.00 (Reference) | 0.92 (0.63, 1.36) | 0.95 (0.64, 1.41) | 1.17 (0.78, 1.75) | 1.05 (0.90, 1.21) | 0.54 |
| Model 2: HR (95% CI) | 1.00 (Reference) | 0.96 (0.65, 1.42) | 1.04 (0.70, 1.55) | 1.39 (0.90, 2.13) | 1.13 (0.96,1.32) | 0.13 |
| Model 3: HR (95% CI) | 1.00 (Reference) | 0.91 (0.61, 1.35) | 0.83 (0.55, 1.27) | 1.09 (0.69, 1.72) | 1.03 (0.87, 1.22) | 0.73 |
| All-Cause Mortality | ||||||
| #Events/# at Risk | 100/198 | 101/200 | 109/199 | 109/198 | 419/795 | |
| Event rate (per 100 PY) | 3.23 | 3.15 | 3.71 | 3.52 | 3.40 | |
| Model 1: HR (95% CI) | 1.00 (Reference) | 0.97 (0.73, 1.29) | 0.98 (0.74, 1.31) | 0.98 (0.72, 1.33) | 0.99 (0.89, 1.11) | 0.90 |
| Model 2: HR (95% CI) | 1.00 (Reference) | 1.01 (0.76, 1.35) | 1.08 (0.81, 1.45) | 1.16 (0.84, 1.61) | 1.07 (0.95, 1.20) | 0.26 |
| Model 3: HR (95% CI) | 1.00 (Reference) | 1.00 (0.75, 1.33) | 0.94 (0.69, 1.27) | 1.02 (0.73, 1.44) | 1.02 (0.90, 1.16) | 0.76 |
Abbreviations: ESRD=end stage renal disease; CVD=cardiovascular disease; UPE=urine phosphate excretion; Q=Quartile; SD=standard deviation; PY=person-years; HR=hazard ratio; CI=confidence interval;
Model 1: Adjusted for age, sex, race, and cause of CKD
Model 2: Adjusted for model 1 variables plus GFR, log 24 Hr urine protein excretion, and 24 Hr urine urea nitrogen excretion.
Model 3: Adjusted for model 2 variables plus total caloric intake, phosphate binder use, diabetes, CVD, smoking, BMI, HDL cholesterol, transferrin, randomized blood pressure strata, and randomized diet strata.
To evaluate the possibility that under- or over-collection of urines may have influenced our results, we conducted a sensitivity analysis in which we limited the study sample to those individuals who had measured creatinine excretion rates within 30% of that expected by a validated creatinine excretion rate prediction equation. This resulted in exclusion of 8% (n=63) of individuals. Among the remaining 732 participants, results were similar. We again observed no association of 24 hour UPE with any of the outcomes in the fully adjusted model (Supplemental Table 3). We also evaluated the association of dietary phosphate intake measured by 3-day dietary recall rather than 24 hour UPE. The Pearson correlation between 24 hour UPE and dietary phosphate intake based on the 3 day dietary recall was weak (ρ=0.25). We observed no association of dietary phosphate intake by this measure with any of the outcomes in models adjusted for demographics or kidney function. In the fully adjusted model, a modest direct association emerged for all-cause mortality (HR per SD higher 1.19 [95% CI 1.03, 1.37], p = 0.02) but not for the other outcomes. (Supplemental Table 4).
Associations of Serum Phosphate with Risk of ESRD, Cardiovascular-, Non-Cardiovascular-, and All-Cause Mortality
For comparison, we evaluated the association of serum phosphate concentrations with each of the 4 outcomes. Each SD (0.7 mg/dL) higher serum phosphate was statistically significantly associated with 22% higher risk of non-CVD mortality and 15% higher risk of all-cause mortality independent of GFR, proteinuria, or other risk factors (Table 3). Each SD higher serum phosphate was also associated higher risk of ESRD and CVD mortality in demographic adjusted models, however these associations were rendered not statistically significant in fully adjusted models.
Table 3. Association of Serum Phosphate Concentrations with Incident ESRD, CVD-, Non-CVD-. and All-Cause Mortality in the MDRD Study.
| Serum Phosphate Quartiles (mg/day) | Q1 1.7-3.2 | Q2 3.3-3.7 | Q3 3.8-4.1 | Q4 4.2-7.7 | Continuous (per SD higher) | p-value |
|---|---|---|---|---|---|---|
| ESRD | ||||||
| #Events/# at Risk | 118/191 | 156/221 | 143/183 | 172/200 | 589/795 | |
| Event rate (per 100 PY) | 6.23 | 7.22 | 10.25 | 16.14 | 9.04 | |
| Model 1: HR (95% CI) | 1.00 (Reference) | 1.22 (0.96, 1.55) | 1.63 (1.27, 2.09) | 2.77 (2.17, 3.54) | 1.41 (1.30, 1.52) | <0.001 |
| Model 2: HR (95% CI) | 1.00 (Reference) | 1.03 (0.81, 1.31) | 1.27 (0.99, 1.63) | 1.55 (1.19, 2.01) | 1.12 (1.03, 1.22) | 0.01 |
| Model 3: HR (95% CI) | 1.00 (Reference) | 0.95 (0.75, 1.22) | 1.14 (0.88, 1.48) | 1.40 (1.08, 1.83) | 1.08 (0.99,1.19) | 0.08 |
| CVD Mortality | ||||||
| #Events/# at Risk | 57/191 | 47/221 | 36/183 | 51/200 | 191/795 | |
| Event rate (per 100 PY) | 1.92 | 1.32 | 1.28 | 1.71 | 1.55 | |
| Model 1: HR (95% CI) | 1.00 (Reference) | 0.69 (0.47, 1.02) | 0.90 (0.58, 1.38) | 1.46 (0.98, 2.18) | 1.29 (1.09, 1.52) | <0.01 |
| Model 2: HR (95% CI) | 1.00 (Reference) | 0.62 (0.42, 0.92) | 0.72 (0.46, 1.12) | 0.96 (0.63, 1.48) | 1.09 (0.92, 1.30) | 0.32 |
| Model 3: HR (95% CI) | 1.00 (Reference) | 0.59 (0.39, 0.89) | 0.64 (0.41, 1.01) | 0.85 (0.54, 1.33) | 1.06 (0.88, 1.28) | 0.52 |
| Non-CVD Mortality | ||||||
| #Events/# at Risk | 44/191 | 60/221 | 69/183 | 55/200 | 228/795 | |
| Event rate (per 100 PY) | 1.48 | 1.68 | 2.46 | 1.84 | 1.85 | |
| Model 1: HR (95% CI) | 1.00 (Reference) | 1.14 (0.77, 1.69) | 2.17 (1.47, 3.21) | 1.94 (1.28, 2.92) | 1.39 (1.20, 1.60) | <0.001 |
| Model 2: HR (95% CI) | 1.00 (Reference) | 1.05 (0.71, 1.57) | 1.91 (1.28, 2.84) | 1.43 (0.92, 2.23) | 1.25 (1.06, 1.46) | <0.01 |
| Model 3: HR (95% CI) | 1.00 (Reference) | 1.02 (0.68, 1.52) | 1.84 (1.22, 2.76) | 1.32 (0.84, 2.09) | 1.22 (1.03, 1.44) | 0.02 |
| All-Cause Mortality | ||||||
| #Events/# at Risk | 101/191 | 107/221 | 105/183 | 106/200 | 419/795 | |
| Event rate (per 100 PY) | 3.40 | 3.00 | 3.74 | 3.54 | 3.40 | |
| Model 1: HR (95% CI) | 1.00 (Reference) | 0.89 (0.67, 1.17) | 1.46 (1.10, 1.94) | 1.67 (1.25, 2.21) | 1.34 (1.20, 1.50) | <0.001 |
| Model 2: HR (95% CI) | 1.00 (Reference) | 0.81 (0.61, 1.07) | 1.23 (0.92, 1,64) | 1.17 (0.86, 1.59) | 1.17 (1.04, 1.32) | <0.01 |
| Model 3: HR (95% CI) | 1.00 (Reference) | 0.78 (0.59, 1.03) | 1.13 (0.84, 1.52) | 1.06 (0.77, 1.46) | 1.15 (1.01, 1,30) | 0.03 |
Abbreviations: ESRD=end stage renal disease; CVD=cardiovascular disease; Q=Quartile; SD=standard deviation; PY=person-years; HR= hazard ratio; CI=confident interval; CKD=chronic kidney disease
Model 1: Adjusted for age, sex, race, and cause of CKD
Model 2: Adjusted for model 1 variables plus GFR, log 24 Hr urine protein excretion, and 24 Hr urine urea nitrogen excretion.
Model 3: Adjusted for model 2 variables plus total caloric intake, phosphate binder use, diabetes, CVD, smoking, BMI, HDL cholesterol, transferrin, randomized blood pressure strata, and randomized diet strata.
Discussion
Among participants with CKD stage 3-5 in the MDRD Study, we observed no statistically significant associations between 24 hour UPE and risk of ESRD, CVD-, non-CVD-, or all-cause mortality. The correlation of UPE with serum phosphate concentration was quite modest and inverse in direction in unadjusted analysis, and no relationship was evident once adjusted for GFR. In contrast to UPE, higher serum phosphate concentrations were associated with statistically significant higher risk of all-cause mortality, with similar albeit not statistically significant associations with ESRD and CVD mortality. These findings have important implications for current KDIGO guidelines and for treatment of mineral bone disorders in patients with CKD stage 3-5.
The KDIGO guidelines recommend maintenance of serum phosphate concentrations in the normal reference range in CKD stage 3-5, and suggest using binders or limiting phosphate intake to accomplish this goal. However, multiple prior studies demonstrate that these strategies only minimally lower serum phosphate concentrations,(10) or do not impact serum phosphate at all.(9, 11, 12) Some have argued that limiting phosphate intake may nonetheless be beneficial, since it may decrease concentrations of phosphate counter-regulatory hormones including fibroblast growth factor 23 (FGF23) and parathyroid hormone (PTH), or because serum phosphate may not reliably reflect phosphate balance. Regardless of mechanisms, though, these arguments would suggest that greater dietary phosphate intake itself would be associated with adverse outcomes in CKD stage 3-5; a testable hypothesis. In this study, we assessed intestinal phosphate absorption using 24 hour UPE, which is linearly related to intestinal absorption across a wide range of phosphate intakes.(8-10, 14) Using this measure, we found no evidence to support this hypothesis in this study.
In contrast to UPE, we found that higher serum phosphate concentrations were associated with non-CVD and all-cause mortality. We observed similar point estimates for ESRD and CVD mortality, but these did not reach statistical significance. The serum phosphate findings are consistent with many other studies and meta-analyses in patients with CKD.(15-18) We also observed that 24 hour UPE and serum phosphate was only weakly correlated with one another, a finding also consistent with several prior studies.(9, 13) In aggregate, these data suggest that factors other than intestinal phosphate absorption may be the main determinants of serum phosphate concentrations in CKD stage 3-5. While dietary intake clearly influences serum phosphate concentrations in dialysis patients, these patients are largely anephric.(3) The relationship may be much weaker in persons with CKD who may have sufficient residual renal function to respond to alterations in phosphate absorption without significant fluctuations in serum phosphate concentrations. There are mechanisms other than diet that might influence serum phosphate concentrations, yet these have received little investigation. Such factors may include altered renal tubule phosphate handling,(19) altered phosphate buffering by bone or muscle, effects of sex hormones,(20, 21) or altered shifts of phosphate between the intra- and extra-cellular compartments. We believe the contribution of such pathways should be further investigated as they may give new insights linking serum phosphate concentrations with adverse outcomes without necessarily implicating the diet.
To our knowledge, this is the first study to evaluate the association of UPE with adverse clinical outcomes in a population with CKD stage 3-5. However, prior studies support our findings and raise additional questions about the efficacy and safety of dietary phosphate restriction. Murtaugh et al. examined the associations of dietary phosphate intake, estimated from 24hr dietary recall, with mortality in individuals with eGFR < 60 ml/min/1.73m2 in National Health and Nutrition Examination Survey (NHANES) III.(22) In line with the weak correlation of UPE with serum phosphate reported here, the low and high phosphate intake quartiles had similar serum phosphate concentrations in their study. The investigators also reported no association of phosphate intake with all-cause mortality (hazard ratio 0.98 per 100 mg/d higher intake, 95% CI 0.93-1.03). The precision of 24 hour diet recall to assess phosphate intake and the possibility of missed phosphate additives were limitations raised by the investigators, both of which should be overcome by using 24 hour UPE. In a prior study, we investigated 880 patients with stable CVD who provided 24 hour urine collections for UPE measurement and had long-term follow-up for CVD events and death. The participants had mean eGFR of 71 ± 22 mL/min/1.73m2 and only 31% had stage 3 or greater CKD. Similar to findings reported here, the correlation of 24 hour UPE with serum phosphate concentrations was weak (ρ=0.03). Moreover, lower, rather than higher, 24 hour UPE was associated with greater risk for CVD events.10 Thus, the major contributions of the current analysis are to confirm findings reported in these prior studies, and to extend them by using 24 hour UPE and evaluating individuals with moderate to advanced CKD who are targets of the current KDIGO guidelines. We also examine the association of 24 hour UPE with risk of ESRD for the first time.
We also evaluated dietary phosphate intake using 3 day dietary recalls. In the fully adjusted model only, a modest direct association emerged with all-cause mortality, which contrasts with data evaluating 24 hour UPE. We primarily focus the interpretation of our results on the 24 hour UPE data for several reasons. First, we set 24 hour UPE as our primary predictor variable a priori, and assessed the dietary recall data only post hoc. In addition, detailed feeding studies using diets of known phosphate content have shown strong linear relationships with 24 hour UPE in both healthy controls and CKD patients,(23) and 24 hour UPE has been used as the main marker of phosphate balance in detailed feeding studies by other investigators.(23) While great effort was invested to provide high quality data from the dietary recalls in MDRD,(24) more recent studies have demonstrated marked variations in the estimated content of phosphate in foods using USDA nutrient databases (upon which the 3 day dietary recalls were based) compared to phosphate measured by ashing, likely reflecting use of phosphate additives and changes in manufacturing by food producers.(25) These factors may have resulted in the relatively weak correlation of phosphate intake by dietary recall vs. the 24 hour UPE reported here (ρ=0.25). Last, we evaluated 4 different end-points, and prior studies have failed to find relationships of phosphate intake when measured by food frequency questionnaire with all-cause mortality,(22) raising the possibility that the association reported here may have been a chance finding.
In feeding studies in controlled settings, with diets prepared by nutritionists and ashed to determine micro-nutrient content, it is possible to lower the amount phosphate absorbed from the diet without influencing protein content.(8) However, dietary protein is the predominant source of phosphate in the diet, and current food labeling does not indicate the quantity of phosphate contained within foods. Thus, in clinical and public health practice, advice to lower phosphate intake will likely result in lowering protein intake as well. Low protein intake, in turn, has been associated with higher mortality in patients with CKD.(26) Thus, rather than just finding a lack of benefit in this study, advice to lower phosphate intake may potentially cause harm, particularly when applied to CKD patients world-wide through international consensus guidelines.
Strengths of the current study include the availability of 24 hour urine phosphate measurements in a large sample of participants with CKD stage 3-5, and long-term follow-up for clinically meaningful end-points. Participants had GFR measured at baseline, allowing us to accurately capture stage and severity of CKD at baseline. We also had 24 hour urine urea nitrogen measurements allowing us to isolate the putative effects of phosphate within the diet while accounting for protein intake.
Despite these and other strengths, the study also has important limitations. This study was an observational study which may be influenced by residual confounding. For example, greater dietary phosphate intake may be a surrogate marker of good health. While we adjusted for age and other co-morbidities, these measures may not have completely captured the health status of participants. Second, 24 hour UPE was measured at the beginning of the MDRD trial in 1989-93. Phosphate additives are used increasingly in the food supply, so the food environment experienced by contemporary CKD patients may differ. Regarding the correlation of 24 hour UPE with serum phosphate at baseline, serum phosphate was measured on morning specimens in MDRD, and prior studies have demonstrated that time-averaged serum phosphate measurements across the day are more strongly related to 24 hour UPE.(27, 28) The correlations may have differed had we had multiple measurements of serum phosphate across the day. Timed urine collections were obtained after providing detailed instructions and in a research setting. Nonetheless, systematic under- or over-collection of urines may have introduced bias. We conducted sensitivity analyses in the subset of individuals whose expected and measured creatinine excretion rates were highly correlated to identify a subset in which we have high confidence in the accuracy of the timed urine collections. Results were similar within this subset. Participants were enrolling in the MDRD Study, and trial participants may not be representative of the larger population of CKD patients. For example, patients with diabetes requiring insulin were excluded from MDRD and many participants had poly-cystic kidney disease. The study also tested two dietary interventions and participants may have been particularly educated and concerned about their diets. We used 24 hour urine collections obtained at the baseline visit before participants were exposed to run-in diets or randomized to higher vs. lower protein diets. Thus, all measurements were made at one time-point and the influence of longitudinal trajectories in 24 hour UPE, serum phosphate, or other measures were not evaluated. As with any null study, we may have missed an association due to insufficient statistical power. However, the relatively large sample size and number of events provided substantial statistical power. The magnitude of any missed association should be within the confines of the 95% confidence intervals, which suggest that any missed association is likely to be modest, at best. The consistency of these findings to analyses in our prior work10 provide additional reassurance.
In conclusion, in this analysis of individuals with CKD stage 3-5, we found that 24 hour UPE – a validated measure of intestinal phosphate absorption - is not associated with risk of ESRD, cardiovascular-, non-cardiovascular-, or all-cause mortality. The correlation of 24 hour UPE with serum phosphate was very modest and inverse in direction, and altogether absent when adjusted for GFR. These results suggest that dietary phosphorus intake may not be a major determinant of serum phosphate concentrations in patients with CKD, and raise questions about the efficacy of limiting dietary phosphate intake to prevent adverse health outcomes in CKD stage 3-5. Because protein and phosphate intake are linked, and limiting protein intake may have other health consequences, these findings suggest that caution should be used in advising alterations in dietary phosphate intake to CKD patients until further studies can confirm or refute the findings reported here.
Methods
Study Population
The MDRD Study is a randomized, multicenter clinical trial conducted from 1989 to 1993 to study the effect of dietary protein restriction on progression of CKD. Details of the study design(29) and primary outcomes(30) have been published previously. Briefly, eligibility criteria included age of 18 to 70 years, serum creatinine level within one year of screening of 1.2 to 7.0 mg/dL in women, 1.4 to 7.0 mg/dL in men, and mean arterial pressure of 125 mmHg or less. Exclusion criteria included insulin requiring diabetes, class III or IV heart failure, urine protein excretion exceeding 10g/day, kidney transplantation, or frequent hospitalizations. Two studies were conducted in parallel; 585 patients with GFR 25-55 mL/min/1.73m2 were randomized into study A, and 255 patients with GFR 13- 24 mL/min/1.73m2 were randomized into study B. Participants in Study A were randomly assigned to either a usual (1.3 g/kg/d) or low-protein diet (0.58 g/kg/d), whereas participants in Study B were randomly assigned to either low- (0.58 g/kg/d) or a very low-protein diet (0.28 g/kg/d) supplemented with a mixture of keto and amino acids. A priori, we evaluated associations of 24 hour UPE with outcomes separately in Study A and Study B, and found similar results and found no interactions by treatment assignment. Thus, to maximize statistical power, we combined the data from Study A and Study B. Among the total of 840 individuals, we excluded 45 individuals with missing baseline 24 hour UPE measurements or covariates, resulting in a final analytic sample of 795 individuals. The Cleveland Clinic (Cleveland, OH) and Tufts-New England Medical Center (Boston, MA) Institutional Review Boards approved the data collection procedures.
24 Hour Urine Phosphate Excretion
Participants completed a 4 month run-in period to determine their ability to comply with the study diets. At the baseline visit preceding the run-in, participants provided 24 hour urine collections. We used this collection to evaluate participants' usual dietary intake thereby avoiding the influence of randomization and run-in diets. Urine samples were analyzed at the Central Biochemistry Laboratory (Department of Biochemistry, Cleveland Clinic Foundation, Cleveland, OH) by a Beckman Astra-8 analyzer. Urinary phosphate, urea nitrogen, creatinine, protein, and volume were measured. We multiplied urine phosphate concentration by urine volume produced in 24 hours to derive 24 hour UPE measurements.
ESRD, Cardiovascular Mortality, Non-Cardiovascular Mortality, and All-Cause Mortality
We evaluated time to ESRD, cardiovascular disease (CVD) related mortality, non-CVD mortality and all-cause mortality using Cox proportional hazards models. Date of ESRD was defined through linkage with the United States Renal Data System (USRDS), conducted through December 31, 2010. The data reported were thereby supplied by the USRDS but the interpretation and reporting of these data are the responsibility of the authors and in no way should be seen as official policy or interpretation of the US government. Survival status, date and cause of death were ascertained from the National Death Index. A death was ascribed to CVD if the primary cause was International Classification of Diseases, Ninth Revision (ICD-9) codes 390 to 459 or kidney disease was listed as the primary cause of death and CVD was the secondary cause. Deaths due to other causes constituted non-CVD mortality. Survival time was defined as time from randomization to the specific outcome or end of follow-up (December 31, 2010).
Other Measures
Demographic information was obtained by interviews at the baseline visit. Hypertension was assessed by study physicians at baseline and was subsequently finalized after further review of the medical records of the participants who were on anti-hypertensive medications at baseline. Renal diagnoses were defined by medical records review including renal biopsy reports and review of historical information. The diagnoses were classified in to 10 categories: 1) glomerular disease; 2) polycystic disease; 3) hypertensive nephrosclerosis; 4) tubulointerstitial diseases; 5) urinary tract diseases; 6) absence of one kidney; 7) diabetic nephropathy; 8) hereditary nephritis; 9) other or unknown with a urinary protein level of 1 to 3 g/day; 10) other or unknown with a urinary protein level of <1g/day. For this analysis, we collapsed these categories into polycystic kidney disease, glomerulonephritis, and other causes. Serum concentrations of electrolytes, glucose, phosphate, ferritin, urea nitrogen, and cholesterol were measured at the central lab at the Cleveland Clinic. Although measurements were made repeatedly during the MDRD study protocol, all measurements used in this analysis are from the baseline examination and reflect one-time measurements unless otherwise specified. GFR was measured at baseline with the renal clearance of iothalamate after its subcutaneous injection without epinephrine. The Central GFR Laboratory (Department of Hypertension and Nephrology, Cleveland Clinic Foundation) received urine and serum samples from the clinical centers to count iothalamate. GFR was calculated as the ratio of time weighted averages of urine excretion rates of the iothalamate marker and the serum concentrations of the marker over three to four consecutive collection periods. Dietary phosphate intake was also measured by a 3-day food record carried out by dieticians.(24) The frequency of intake and portion size was estimated by participants and matched with a food database of approximately 3,800 food items. The phosphate content was estimated using the USDA nutrient database from 1986 and 1987 and missing data were imputed (4% for dietary phosphate intake).
Statistical Analysis
We categorized participants into quartiles based on 24 hour UPE, and compared the distribution of baseline characteristics across quartiles using ANOVA or the Kruskal- Wallis test for continuous variables, or Chi square or Fisher's exact tests for categorical variables, as appropriate. Pearson correlations were used to determine the correlation of 24 hour UPE with serum phosphate concentrations at baseline.
We next evaluated the associations of 24 hour UPE with time to ESRD, CVD-, non-CVD- and all-cause mortality using Cox proportional hazards models. In models evaluating ESRD, we censored for death. To assess the functional form, we evaluated associations by UPE quartiles, setting the lowest quartile as the reference category. As associations were fairly linear, we also evaluated UPE as a continuous predictor variable (per SD higher) to maximize statistical power. Models were sequentially adjusted. Model 1 was adjusted for age, sex, race, and cause of CKD. Model 2 additionally adjusted for measured GFR, 24 hour urine protein, and urea nitrogen excretion. Given right-skewed distribution, 24 hour urine protein excretion was log transformed and the logged variable was used in Cox models. Finally, model 3 additionally adjusted for, total caloric intake, phosphate binder, diabetes, CVD, smoking status, body mass index, blood pressure strata, diet strata, high density lipoprotein (HDL) cholesterol, and transferrin concentrations, as HDL cholesterol and transferrin had been linked with CKD progression in MDRD in prior analyses.(31) As the MDRD study was a randomized trial, we tested interactions of both UPE * randomization arm and serum phosphate * randomization arm in the final models. No significant interactions were detected. In companion analyses, we examined the association of serum phosphate concentrations with each of the 4 outcomes, adjusting for the same series of covariates as summarized above.
Participants were provided detailed instructions on complete bladder emptying before initiation, and methods for complete collection of 24 hour urines. Nonetheless, systematic over-or under-collection of urine may introduce bias. Twenty-four hour urine creatinine excretion rate (CER) is a reliable marker of urine collection accuracy. We used a validated equation to estimate CER (eCER) in each individual.(32)
eCER = 879.89 + 12.51 × weight (kg) - 6.19 × age + (34.51 if black) - (379.42 if female) We then compared each individual's eCER with the measured CER in their 24 hour urine collections. In a sensitivity analysis aimed at identifying a subgroup wherein we had additional confidence in the accuracy of participants' 24 hour urine collections, we excluded participants whose measured CER was either 30% more than or less than their eCER.(33-35) Models evaluating the association of 24 hour UPE with each of the 3 outcomes were repeated within this subset.
All analyses were conducted using statistical package SAS, version 9.4. P values < 0.05 were considered statistically significant for all analyses including interaction terms.
Supplementary Material
Supplemental Table 1. Baseline Characteristics of MDRD Study A and B by Quartiles of 24 hour Urine Phosphate Excretion
Supplemental Table 2: Adjusted Association of 24 hour Urine Phosphate Excretion with Incident ESRD, CVD-, Non-CVD-, and All-Cause Mortality Stratified by MDRD Study A and Study B
Supplemental Table 3: Sensitivity Analysis Evaluating Associations of 24 hour Urine Phosphate Excretion with Incident ESRD, CVD-, Non-CVD-, and All-Cause Mortality in the Subset with mCER within 30% of eCER
Supplemental Table 4: Association of Phosphate Intake by 3-Day Dietary Recall with Incident ESRD, CVD-, Non-CVD-, and All-Cause Mortality in the MDRD Study
Acknowledgments
This study was supported by grants from the National Heart Lung and Blood Institute (NHLBI) T32DK069263 (U.S), and National Institutes of Diabetes, Digestive, and Kidney Diseases (NIDDK) R01DK101720-01 (G.B. and J.H.I.).
Footnotes
Disclosures: None.
References
- 1.Block GA, Klassen PS, Lazarus JM, et al. Mineral metabolism, mortality, and morbidity in maintenance hemodialysis. J Am Soc Nephrol. 2004;15:2208–18. doi: 10.1097/01.ASN.0000133041.27682.A2. [DOI] [PubMed] [Google Scholar]
- 2.Jono S, McKee MD, Murry CE, et al. Phosphate regulation of vascular smooth muscle cell calcification. Circ Res. 2000;87:E10–7. doi: 10.1161/01.res.87.7.e10. [DOI] [PubMed] [Google Scholar]
- 3.Sullivan C, Sayre SS, Leon JB, et al. Effect of food additives on hyperphosphatemia among patients with end-stage renal disease: a randomized controlled trial. JAMA. 2009;301:629–35. doi: 10.1001/jama.2009.96. [DOI] [PubMed] [Google Scholar]
- 4.Kestenbaum B. Phosphate metabolism in the setting of chronic kidney disease: significance and recommendations for treatment. Semin Dial. 2007;20:286–94. doi: 10.1111/j.1525-139X.2007.00303.x. [DOI] [PubMed] [Google Scholar]
- 5.Foley RN, Collins AJ, Ishani A, et al. Calcium-phosphate levels and cardiovascular disease in community-dwelling adults: the Atherosclerosis Risk in Communities (ARIC) Study. Am Heart J. 2008;156:556–63. doi: 10.1016/j.ahj.2008.05.016. [DOI] [PubMed] [Google Scholar]
- 6.Dhingra R, Sullivan LM, Fox CS, et al. Relations of serum phosphorus and calcium levels to the incidence of cardiovascular disease in the community. Arch Intern Med. 2007;167:879–85. doi: 10.1001/archinte.167.9.879. [DOI] [PubMed] [Google Scholar]
- 7.KDIGO clinical practice guideline for the diagnosis, evaluation, prevention, and treatment of Chronic Kidney Disease-Mineral and Bone Disorder (CKD-MBD) Kidney Int Suppl. 2009:S1–130. doi: 10.1038/ki.2009.188. [DOI] [PubMed] [Google Scholar]
- 8.Moe SM, Zidehsarai MP, Chambers MA, et al. Vegetarian compared with meat dietary protein source and phosphorus homeostasis in chronic kidney disease. Clin J Am Soc Nephrol. 2011;6:257–64. doi: 10.2215/CJN.05040610. [DOI] [PMC free article] [PubMed] [Google Scholar]
- 9.Isakova T, Gutierrez OM, Smith K, et al. Pilot study of dietary phosphorus restriction and phosphorus binders to target fibroblast growth factor 23 in patients with chronic kidney disease. Nephrol Dial Transplant. 2011;26:584–91. doi: 10.1093/ndt/gfq419. [DOI] [PMC free article] [PubMed] [Google Scholar]
- 10.Block GA, Wheeler DC, Persky MS, et al. Effects of phosphate binders in moderate CKD. J Am Soc Nephrol. 2012;23:1407–15. doi: 10.1681/ASN.2012030223. [DOI] [PMC free article] [PubMed] [Google Scholar]
- 11.Oliveira RB, Cancela AL, Graciolli FG, et al. Early control of PTH and FGF23 in normophosphatemic CKD patients: a new target in CKD-MBD therapy? Clin J Am Soc Nephrol. 2010;5:286–91. doi: 10.2215/CJN.05420709. [DOI] [PMC free article] [PubMed] [Google Scholar]
- 12.Seifert ME, de las Fuentes L, Rothstein M, et al. Effects of phosphate binder therapy on vascular stiffness in early-stage chronic kidney disease. Am J Nephrol. 2013;38:158–67. doi: 10.1159/000353569. [DOI] [PMC free article] [PubMed] [Google Scholar]
- 13.Newsome B, Ix JH, Tighiouart H, et al. Effect of Protein Restriction on Serum and Urine Phosphate in the Modification of Diet in Renal Disease (MDRD) Study. Am J Kidney Dis. 2013 doi: 10.1053/j.ajkd.2013.01.007. [DOI] [PubMed] [Google Scholar]
- 14.Hill KM, Martin BR, Wastney ME, et al. Oral calcium carbonate affects calcium but not phosphorus balance in stage 3-4 chronic kidney disease. Kidney Int. 2013;83:959–66. doi: 10.1038/ki.2012.403. [DOI] [PMC free article] [PubMed] [Google Scholar]
- 15.Zoccali C, Ruggenenti P, Perna A, et al. Phosphate may promote CKD progression and attenuate renoprotective effect of ACE inhibition. J Am Soc Nephrol. 2011;22:1923–30. doi: 10.1681/ASN.2011020175. [DOI] [PMC free article] [PubMed] [Google Scholar]
- 16.Isakova T, Xie H, Yang W, et al. Fibroblast growth factor 23 and risks of mortality and end-stage renal disease in patients with chronic kidney disease. JAMA. 2011;305:2432–9. doi: 10.1001/jama.2011.826. [DOI] [PMC free article] [PubMed] [Google Scholar]
- 17.Palmer SC, Hayen A, Macaskill P, et al. Serum levels of phosphorus, parathyroid hormone, and calcium and risks of death and cardiovascular disease in individuals with chronic kidney disease: a systematic review and meta-analysis. JAMA. 2011;305:1119–27. doi: 10.1001/jama.2011.308. [DOI] [PubMed] [Google Scholar]
- 18.Kestenbaum B, Sampson JN, Rudser KD, et al. Serum phosphate levels and mortality risk among people with chronic kidney disease. J Am Soc Nephrol. 2005;16:520–8. doi: 10.1681/ASN.2004070602. [DOI] [PubMed] [Google Scholar]
- 19.Dominguez JR, Shlipak MG, Whooley MA, et al. Fractional excretion of phosphorus modifies the association between fibroblast growth factor-23 and outcomes. J Am Soc Nephrol. 2013;24:647–54. doi: 10.1681/ASN.2012090894. [DOI] [PMC free article] [PubMed] [Google Scholar]
- 20.Ix JH, Chonchol M, Laughlin GA, et al. Relation of sex and estrogen therapy to serum fibroblast growth factor 23, serum phosphorus, and urine phosphorus: the heart and soul study. Am J Kidney Dis. 2011;58:737–45. doi: 10.1053/j.ajkd.2011.06.011. [DOI] [PMC free article] [PubMed] [Google Scholar]
- 21.Meng J, Ohlsson C, Laughlin GA, et al. Associations of estradiol and testosterone with serum phosphorus in older men: the Osteoporotic Fractures in Men study. Kidney Int. 2010;78:415–22. doi: 10.1038/ki.2010.161. [DOI] [PMC free article] [PubMed] [Google Scholar]
- 22.Murtaugh MA, Filipowicz R, Baird BC, et al. Dietary phosphorus intake and mortality in moderate chronic kidney disease: NHANES III. Nephrol Dial Transplant. 2012;27:990–6. doi: 10.1093/ndt/gfr367. [DOI] [PMC free article] [PubMed] [Google Scholar]
- 23.Sigrist M, Tang M, Beaulieu M, et al. Responsiveness of FGF-23 and mineral metabolism to altered dietary phosphate intake in chronic kidney disease (CKD): results of a randomized trial. Nephrol Dial Transplant. 2013;28:161–9. doi: 10.1093/ndt/gfs405. [DOI] [PubMed] [Google Scholar]
- 24.Gillis BP, Averbach FM, Caggiula AW, et al. Features of the nutrient database and analysis system for the Modification of Diet in Renal Disease Study. Control Clin Trials. 1994;15:44–58. doi: 10.1016/0197-2456(94)90027-2. [DOI] [PubMed] [Google Scholar]
- 25.Moser M, White K, Henry B, et al. Phosphorus content of popular beverages. Am J Kidney Dis. 2015;65:969–71. doi: 10.1053/j.ajkd.2015.02.330. [DOI] [PubMed] [Google Scholar]
- 26.Menon V, Kopple JD, Wang X, et al. Effect of a very low-protein diet on outcomes: long-term follow-up of the Modification of Diet in Renal Disease (MDRD) Study. Am J Kidney Dis. 2009;53:208–17. doi: 10.1053/j.ajkd.2008.08.009. [DOI] [PubMed] [Google Scholar]
- 27.Portale AA, Halloran BP, Morris RC., Jr Dietary intake of phosphorus modulates the circadian rhythm in serum concentration of phosphorus. Implications for the renal production of 1,25-dihydroxyvitamin D. J Clin Invest. 1987;80:1147–54. doi: 10.1172/JCI113172. [DOI] [PMC free article] [PubMed] [Google Scholar]
- 28.Ix JH, Anderson CA, Smits G, et al. Effect of dietary phosphate intake on the circadian rhythm of serum phosphate concentrations in chronic kidney disease: a crossover study. Am J Clin Nutr. 2014;100:1392–7. doi: 10.3945/ajcn.114.085498. [DOI] [PMC free article] [PubMed] [Google Scholar]
- 29.Beck GJ, Berg RL, Coggins CH, et al. Design and statistical issues of the Modification of Diet in Renal Disease Trial. The Modification of Diet in Renal Disease Study Group. Control Clin Trials. 1991;12:566–86. doi: 10.1016/0197-2456(91)90069-x. [DOI] [PubMed] [Google Scholar]
- 30.Klahr S, Levey AS, Beck GJ, et al. The effects of dietary protein restriction and blood-pressure control on the progression of chronic renal disease. Modification of Diet in Renal Disease Study Group. N Engl J Med. 1994;330:877–84. doi: 10.1056/NEJM199403313301301. [DOI] [PubMed] [Google Scholar]
- 31.Hunsicker LG, Adler S, Caggiula A, et al. Predictors of the progression of renal disease in the Modification of Diet in Renal Disease Study. Kidney Int. 1997;51:1908–19. doi: 10.1038/ki.1997.260. [DOI] [PubMed] [Google Scholar]
- 32.Ix JH, Wassel CL, Stevens LA, et al. Equations to estimate creatinine excretion rate: the CKD epidemiology collaboration. Clin J Am Soc Nephrol. 2011;6:184–91. doi: 10.2215/CJN.05030610. [DOI] [PMC free article] [PubMed] [Google Scholar]
- 33.Palomino HL, Rifkin DE, Anderson C, et al. 24-hour urine phosphorus excretion and mortality and cardiovascular events. Clin J Am Soc Nephrol. 2013;8:1202–10. doi: 10.2215/CJN.11181012. [DOI] [PMC free article] [PubMed] [Google Scholar]
- 34.Ix JH, de Boer IH, Wassel CL, et al. Urinary creatinine excretion rate and mortality in persons with coronary artery disease: the Heart and Soul Study. Circulation. 2010;121:1295–303. doi: 10.1161/CIRCULATIONAHA.109.924266. [DOI] [PMC free article] [PubMed] [Google Scholar]
- 35.Wilson FP, Xie D, Anderson AH, et al. Urinary creatinine excretion, bioelectrical impedance analysis, and clinical outcomes in patients with CKD: the CRIC study. Clin J Am Soc Nephrol. 2014;9:2095–103. doi: 10.2215/CJN.03790414. [DOI] [PMC free article] [PubMed] [Google Scholar]
Associated Data
This section collects any data citations, data availability statements, or supplementary materials included in this article.
Supplementary Materials
Supplemental Table 1. Baseline Characteristics of MDRD Study A and B by Quartiles of 24 hour Urine Phosphate Excretion
Supplemental Table 2: Adjusted Association of 24 hour Urine Phosphate Excretion with Incident ESRD, CVD-, Non-CVD-, and All-Cause Mortality Stratified by MDRD Study A and Study B
Supplemental Table 3: Sensitivity Analysis Evaluating Associations of 24 hour Urine Phosphate Excretion with Incident ESRD, CVD-, Non-CVD-, and All-Cause Mortality in the Subset with mCER within 30% of eCER
Supplemental Table 4: Association of Phosphate Intake by 3-Day Dietary Recall with Incident ESRD, CVD-, Non-CVD-, and All-Cause Mortality in the MDRD Study