Abstract
AIM: To investigate the feasibility of a dual-input two-compartment tracer kinetic model for evaluating tumorous microvascular properties in advanced hepatocellular carcinoma (HCC).
METHODS: From January 2014 to April 2015, we prospectively measured and analyzed pharmacokinetic parameters [transfer constant (Ktrans), plasma flow (Fp), permeability surface area product (PS), efflux rate constant (kep), extravascular extracellular space volume ratio (ve), blood plasma volume ratio (vp), and hepatic perfusion index (HPI)] using dual-input two-compartment tracer kinetic models [a dual-input extended Tofts model and a dual-input 2-compartment exchange model (2CXM)] in 28 consecutive HCC patients. A well-known consensus that HCC is a hypervascular tumor supplied by the hepatic artery and the portal vein was used as a reference standard. A paired Student’s t-test and a nonparametric paired Wilcoxon rank sum test were used to compare the equivalent pharmacokinetic parameters derived from the two models, and Pearson correlation analysis was also applied to observe the correlations among all equivalent parameters. The tumor size and pharmacokinetic parameters were tested by Pearson correlation analysis, while correlations among stage, tumor size and all pharmacokinetic parameters were assessed by Spearman correlation analysis.
RESULTS: The Fp value was greater than the PS value (FP = 1.07 mL/mL per minute, PS = 0.19 mL/mL per minute) in the dual-input 2CXM; HPI was 0.66 and 0.63 in the dual-input extended Tofts model and the dual-input 2CXM, respectively. There were no significant differences in the kep, vp, or HPI between the dual-input extended Tofts model and the dual-input 2CXM (P = 0.524, 0.569, and 0.622, respectively). All equivalent pharmacokinetic parameters, except for ve, were correlated in the two dual-input two-compartment pharmacokinetic models; both Fp and PS in the dual-input 2CXM were correlated with Ktrans derived from the dual-input extended Tofts model (P = 0.002, r = 0.566; P = 0.002, r = 0.570); kep, vp, and HPI between the two kinetic models were positively correlated (P = 0.001, r = 0.594; P = 0.0001, r = 0.686; P = 0.04, r = 0.391, respectively). In the dual input extended Tofts model, ve was significantly less than that in the dual input 2CXM (P = 0.004), and no significant correlation was seen between the two tracer kinetic models (P = 0.156, r = 0.276). Neither tumor size nor tumor stage was significantly correlated with any of the pharmacokinetic parameters obtained from the two models (P > 0.05).
CONCLUSION: A dual-input two-compartment pharmacokinetic model (a dual-input extended Tofts model and a dual-input 2CXM) can be used in assessing the microvascular physiopathological properties before the treatment of advanced HCC. The dual-input extended Tofts model may be more stable in measuring the ve; however, the dual-input 2CXM may be more detailed and accurate in measuring microvascular permeability.
Keywords: Hepatocellular carcinoma, Dynamic contrast-enhanced magnetic resonance imaging, Pharmacokinetics
Core tip: Dynamic contrast-enhanced magnetic resonance imaging provides a more comprehensive assessment of microvascular parameters in tumors; however, selection of a pharmacokinetic model that takes into account actual physiopathological status is an essential component of evaluating tumor microvascular permeability and perfusion. Here, we confirm that a dual-input two-compartment tracer kinetic model is suitable for evaluating microvascular properties in advanced hepatocellular carcinoma.
INTRODUCTION
Hepatocellular carcinoma (HCC) is one of the most common primary malignant tumors and the second leading cause of cancer-related deaths worldwide[1]. Some patients present with advanced disease at the time of diagnosis and are treated with molecular-targeted treatment, transarterial chemoembolization (TACE), and radiofrequency ablation against HCC[2]. Assessing the therapeutic efficacy of these therapy modalities is closely related to the tumorous microvasculature properties that are linked to the angiogenic potential of the tumor[3]. A tracer kinetic model of T1-weighted dynamic contrast-enhanced magnetic resonance imaging (DCE-MRI) has significant potential to obtain information about the tumor microvascular properties by estimating the pharmacokinetic parameters of the microvascular perfusion and permeability[4]. Some studies have shown the value of assessing microvascular properties in monitoring the effects of interventional therapy or antiangiogenic drug treatment of HCC, as well as metastases in the liver, by using single-input single-compartment or two-compartment tracer kinetic models to evaluate tumor pharmacokinetic parameters[3,5-8].
According to the dynamic distribution of the contrast agent, a well-mixed space of contrast agent is defined as a compartment where the contrast agent concentration is spatially uniform[9,10]. The tracer compartment model is divided into a single-compartment model such as the Tofts model, which assumes that the contrast agent is confined to only one compartment (i.e., vascular space), and two-compartment models such as the extended Tofts model and the exchange model, in which the contrast agent transits vascular space to the interstitial space[9]. The tissue under investigation and its underlying microvascular physiology, as well as the temporal resolution and spatial resolution of scanning MRI, are important factors that led us to select a tracer kinetic model. The parenchyma in most tumors consists of two compartments [tumorous intravascular space and extravascular extracellular space (EES)]; thus, a two-compartmental kinetic model may provide a better reflection of the microcirculation of tumor[11]. Moreover, HCC is supplied by both the portal vein and the hepatic artery in different proportions at various stages[12]. Therefore, we hypothesized that a dual-input two-compartment model may accurately evaluate the pharmacokinetic parameters in advanced HCC.
To date, microvascular property assessment by dual-input two-compartment tracer kinetic model with commonly used extracellular gadoliniun contrast agent has not been reported in HCC in a clinical practice setting. Hence, the aim of this study was to prospectively explore whether a dual-input two-compartment tracer kinetic model could evaluate the tumorous microvascular properties in advanced HCC by analyzing perfusion and permeability parameters derived from a dual-input extended Tofts model and a dual-input 2CXM.
MATERIALS AND METHODS
Patient population
This study was approved by the local Institutional Review Board, and informed consent was obtained from all patients. From January 2014 to April 2015, 42 patients with HCC were recruited, all of whom did not receive any antineoplastic treatment before their MRI scan. The inclusion and exclusion criteria are listed in Table 1. We staged Barcelxona-Clínic Liver Cancer classification (BCLC) for all enrolled HCC patients according to the criteria of the 2012 European Association for the Study of the Liver (EASL)[13]. Because microvascular physiologic parameters in tumors are functional biomarkers that could not be measured from the pathological sample in vitro, we looked to a well-known consensus as a reference standard that HCC is a hypervascular tumor supplied by both the portal vein and the hepatic artery in different proportions.
Table 1.
Inclusion and exclusion criteria of the enrolled patients
| Eligibility criteria | Exclusion criteria |
| Histopathology confirmed | MRI examination contraindication |
| Non-invasive diagnosis criteria [(EASL) 2012]1 | Significant renal insufficiency |
| Cirrhotic patients | |
| Hypervascular in the arterial phase | |
| Washout in the portal venous or delayed phase | |
| Non-antineoplaston therapy | Severe motion artifacts on MRI images |
| The largest diameter of lesion ≥ 2 cm | Hepatic vein/portal cancer embolus |
| Age of patients ≥ 18 yr | Inferior vena cava embolus |
| Inability of informed written consent |
European Association for the Study of the Liver suggested non-invasive diagnosis criteria on 4-phase multidetector CT scan[13]. EASL: European Association for the Study of the Liver; MRI: Magnetic resonance imaging.
MRI technique
An MRI scan of the whole liver was performed using a 12-channel phased array body coil on the 3.0-T MRI system (Magnetom Verio, Siemens, Erlangen, Germany) with Syngo 2009B software. The scan protocol consisted of transverse T2-weighted turbo spin-echo images (TR/TE, 1370/81; slice thickness, 6 mm; interslice gap, 1.2 mm;matrix size, 207 × 320; received bandwidth, 220 kHz) and diffusion weighted echoplanar images (TR/TE, 7400/73; slice thickness, 6 mm; interslice gap, 1.2 mm; b value = 0 s/mm², 600 s/mm²; matrix, 99 × 146; received bandwidth, 1802 kHz). Multi-flip angle T1 Mapping and DCE T1-weighted three-dimensional volume interpolated excitation (VIBE) fat-suppression sequence with breath-free (TR/TE, 3.5/1.17 msec; slice thickness, 5 mm; interslice gap, 1 mm; matrix, 288 × 164; field of view, 350 × 284 mm; scan slices were 30 in unenhanced T1WI and enhanced TIWI; flip angle were 5°, 10°, 15° in unenhanced TIWI, flip angle was 10° in enhanced TIWI; temporal resolution, 6 s) were also obtained. DCE-MR imaging data were acquired after a 5-s delay subsequent to the injection of contrast medium through a 20-guage peripheral intravenous line in the medial cubital vein (0.1 mmol/kg body weight of Gadodiamide contrast medium; Omniscan, GE Medical Systems, Amersham, Ireland) at 3.5 mL/s, followed by a saline chase of 20 mL at a rate of 2 mL/s. DCE-MR imaging included 35 acquiring phases and lasted for 227.5 s.
Model design
In this study, a dual-input two-compartment tracer kinetic model was utilized to analyze the perfusion and permeability of tumorous vascularity in HCC. This type of model accounts for the hepatic artery and portal vein input to the HCC and assumes contrast agent in two compartments (tumorous intravascular space and EES). We applied the hepatic perfusion index (HPI) to observe the contribution of arterial flow to the tumor. The tissue that the blood vessels containing contrast agent supply can be measured by Vascular Input Function (VIF) in both the hepatic artery and the portal vein. The definitions of all symbols are listed in Table 2.
Table 2.
Summary of parameter terms used in the dual-input extended Tofts model and 2-compartment exchange model
| Symbol | Definition | Unit |
| Ctiss(t) | Concentration of tracer in the tissue | mmol/L |
| CA(t) | Concentration of tracer in whole blood in a major feeding artery | mmol/L |
| Cv(t) | Concentration of tracer in the portal vein | mmol/L |
| Fa | Arterial fraction of the tissue perfusion | % |
| HLV | Hematocrit in major (large) vessels | none |
| HPI | Hepatic perfusion index | none |
| Fp | Flow rate of the blood plasma through the intravascular plasma space | mL/mL per minute |
| vp | Ratio of blood plasma volume to tissue volume | % |
| ve | Ratio of EES volume to tissue volume | % |
| kep | Efflux rate constant | min-1 |
| Ktrans | Transfer constant | min-1 |
| PS | Endothelial permeability surface area product | mL/mL per minute |
| ⊗ | Convolution operator | None |
EES: Extravascular extracellular space.
The tracer in intravascular space is able to diffuse to the EES through the capillary walls, and Ktrans denotes the tracer transfer constant between blood and EES, which combined the plasma flow (Fp) and the capillary permeability-surface area product (PS). The efflux rate constant (kep) is the ratio of the transfer constant from EES to blood plasma. vp and ve are the volume fraction in the vascular space and EES, respectively[14].
An extended Tofts model evaluates Ktrans, ve, vp, and kep[14]. This model assumes that a neglect of plasma mean transit time results in a situation where the concentration of contrast agent within the plasma compartment is equal to the concentration in the supplying artery[15]; therefore, the concentration of contrast agent in the tissue, Ctiss(t) in this model, can be written as follows:
Ctiss(t) = vpCA(t)/(1-HLV) + KtransCA(t)/(1-HLV)⊗exp(-kept) (Eq. 1A)
The equation (Eq. 1A) is the formulation of a single-input extended Tofts model; thus, we insert a dual inlet equation (Eq. 2) to produce the equation of the dual-input extended Tofts model (Eq. 1B).
CA(t)→faCA(t) + (1-fa)Cv(t)
(Eq. 2)
Ctiss(t) = vp[faCA(t) + (1-fa)Cv(t)]/(1 - HLV) + Ktrans[faCA(t) + (1-fa)Cv(t)]/(1 - HLV)⊗exp(-kept)
(Eq. 1B)
The 2CXM is the most common exchange model and can separately evaluate Fp and PS, in addition to Vp, Ve, and Kep[10,14]. As for a single-input 2CXM, the concentration of the contrast agent in the tissue, Ctiss(t), can be written as follows:
Ctiss(t) = FpCA(t)/(1 - HLV)⊗A.exp(-αt) + (1-A).exp(-βt) (Eq. 3A)
We also insert a dual-inlet equation (Eq. 2) into the equation (Eq. 3A) to obtain the final equation of the dual-input 2CXM as follows:
Ctiss(t) = Fp[faCA(t) + (1 - fa)Cv(t)]/(1 - HLV⊗A.exp(-αt) + (1 - A).exp(-βt) (Eq. 3B)
where A, α, and β can be obtained from the model parameters vp, ve, and PS, respectively:
A = PS/vp; α = PS/ve; β = Fp/vp
Data postprocessing and analysis
Because there were more than 2 lesions of HCC in the liver in some patients, we measured the one with the largest diameter and also measured the mass volume. Each data set was measured by the same radiologist (who has 17 years of abdominal diagnosis experience), who kept the approach consistent at each time point of the procedure. All data were postprocessed using Omni Kinetics software (GE Healthcare, China). After data loading, we registered all acquired data using 3D non-rigid registration to relieve the motion artifact caused by breath and heart beating (Figure 1); then, we extracted an average signal-time course of the tumor and converted the signal-time curve to a concentration-time curve. The signal intensity of all pixels in the image was converted to contrast agent concentration using the precontrast T1 value of 1600 ms for blood and 1580 ms for tissue, and an assumed hematocrit of 0.42 was used to convert from whole blood concentration to plasma concentration for all patients. Before calculating the pharmacokinetic parameters, we drew the ROI on both the portal vein and the hepatic artery, which was replaced by the abdominal aorta near the entrance of celiac trunk as a dual-input model to fit the VIF (Figure 2). The size and location of the ROI drawn on the lesion in the same patient are consentaneous in both models. We drew the ROI (by hand) on the parenchyma of the HCC at its largest diameter on the T1WI images in each patient, avoiding necrosis, hemorrhage, steatosis, and peripheral blood vessels, and then, we used the dual-input extended Tofts model and the dual-input 2CXM, respectively, to fit the data and calculate tumorous perfusion and permeability parameters: Ktrans in the dual-input extended Tofts model, Fp and PS in the dual-input 2CXM, and vp, ve, kep, and HPI in both models (Figure 3). All measurements were performed three times, and the mean value is presented.
Figure 1.
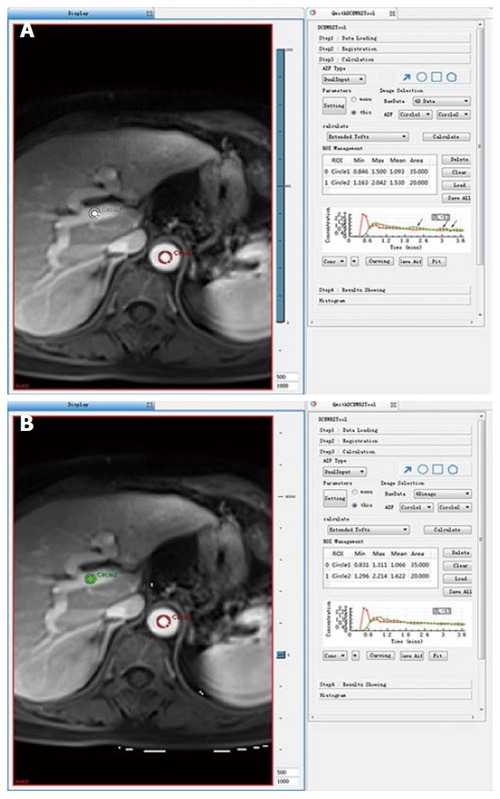
Concentration-time curve of the portal vein was an inferior fit (arrow) compared to that of the abdominal aorta without non-rigid registration (A); however, the concentration-time curve of the portal vein was a better fit after non-rigid registration (B).
Figure 2.
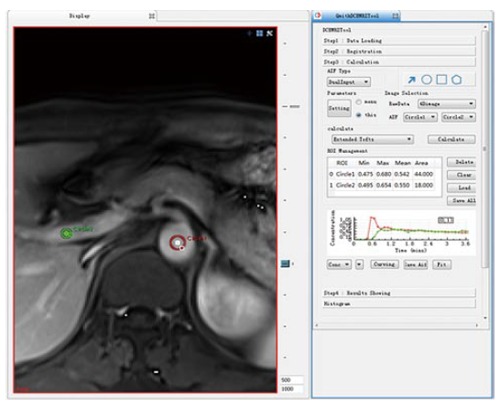
ROI 1 was placed on the abdominal aorta near the entrance of the celiac trunk, replacing the hepatic artery, and ROI 2 was placed on the portal vein as a dual input model to fit the vascular input function; the concentration-time curve maps of the ROI 1 and ROI 2 are shown to the right.
Figure 3.
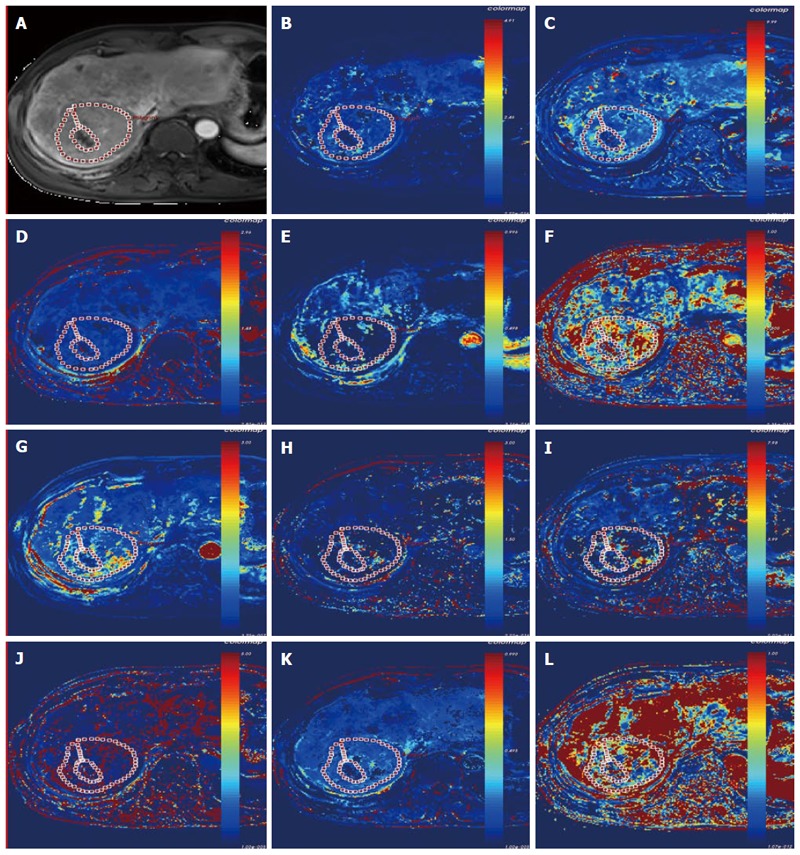
Lesion of the hepatocellular carcinoma in a 68-year-old man on dynamic contrast-enhanced T1WI (A); pharmacokinetic parameter map (Ktrans, kep, ve, vp, and hepatic perfusion index) derived from the dual-input extended Tofts model (B-F), and the pharmacokinetic parameter maps (Fp, PS, kep, ve, vp, and hepatic perfusion index) derived from the dual-input 2-compartment exchange model (G-L).
Statistical analysis
Statistical analyses were performed with the SPSS statistical software package (version 19.0; SPSS Inc, Chicago, IL, United States). Tumor size and pharmacokinetic parameters were assessed by Pearson correlation analysis. Correlation between stage, tumor size and all pharmacokinetic parameters was assessed by Spearman correlation analysis. We compared all equivalent parameters obtained from the dual-input extended Tofts model and dual-input 2CXM using a paired Student’s t-test or a nonparametric paired Wilcoxon rank sum test for non-normal distribution data to confirm the consistency of these two models. Pearson correlation analysis was also performed to analyze the correlation between all parameters. A P-value < 0.05 was considered statistically significant.
The statistical methods of this study were reviewed by Hai-yang Xing from Shaoxing University.
RESULTS
In this prospective study, 42 HCC patients based on pathological diagnosis and non-invasive criteria underwent T1WI DCE-MRI. However, 14 patients were excluded because of portal or hepatic vein/inferior vena cava embolus (6 patients), severe motion artifacts (4 patients), MRI examination failure because of claustrophobia (1 patient), or different contrast agent injection rates (3 patients). In total, 28 patients were enrolled. Patients’ demographic characteristics, tumor volume and the tumor stage are shown in Table 3. A significant correlation was found between tumor size and stage (P = 0.013, r = 0.463). Neither tumor size nor tumor stage significantly correlated with any of the pharmacokinetic parameters obtained in any of the models.
Table 3.
Patients’ demographic characteristics, tumor volume, and tumor stage
| Age (yr) | Gender | Diagnosis criteria | Size (cm³) | Stage (BCLC)1 |
| 64.857 ± 10.384 | Female 5 | Confirmed by histology 8 | 409.588 | A2 (2) |
| Male 23 | Diagnosed by EASL 20 | A3 (3) | ||
| A4 (1) | ||||
| B (11) | ||||
| C (11) |
Barcelona-Clínic Liver Cancer classification[13]. EASL: European Association for the Study of the Liver.
DCE-MRI microvascular physiopathological parameters obtained with the dual-input two-compartment tracer kinetic model are shown in Table 4. There were no significant differences in the kep, vp, or HPI between the dual-input extended Tofts model and the dual-input 2CXM (P = 0.524, P = 0.569, P = 0.622, respectively). Except for ve, all equivalent pharmacokinetic parameters derived from the two tracer kinetic models are correlated: both Fp and PS in the dual-input 2CXM are correlated with Ktrans in the dual-input extended Tofts model (P =0.002, r = 0.566; P =0.002, r = 0.570, respectively; Figure 4); kep, vp, and HPI were positively correlated (P = 0.001, r = 0.594; P = 0.0001, r = 0.686; P = 0.04, r = 0.391, respectively; Figures 5, 6 and 7). ve was significantly less in the dual-input extended Tofts model than in the dual-input 2CXM (P = 0.004), and there was no significant correlation between the two proposed tracer kinetics models (P = 0.156, r = 0.276; Table 4, Figure 8). The value of Fp was larger than that of PS in the dual-input 2CXM (FP = 1.07 mL/mL per minute, PS = 0.19 mL/mL per minute); Ktrans derived from the dual-input extended Tofts model was 0.29 min-1; HPI was 0.66 and 0.63 in the dual-input extended Tofts model and the dual-input 2CXM, respectively (Table 4).
Table 4.
Comparison of tumor dynamic contrast-enhanced-magnetic resonance imaging pharmacokinetic parameters from 28 scanned patients using two models [Median (IQR)]
| ktrans (min-1) | PS (mL/mL ・min-1) | Fp (mL/mL ・min-1) | kep (min-1) | ve | vp | HPI | |
| Dual-Input Extended Tofts model | 0.29 ± 0.38 | - | - | 1.35 ± 1.42 | 0.51 ± 1.16 | 0.12 ± 0.21 | 0.66 ± 0.24 |
| Dual-Input Exchange model | - | 0.19 ± 0.36 | 1.07 ± 1.73 | 0.95 ± 1.60 | 1.22 ± 1.19 | 0.14 ± 0.17 | 0.63 ± 0.29 |
| Z/t value | NA | NA | NA | -0.638 | -2.869 | -0.568 | 0.4991 |
| P value | NA | NA | NA | 0.524 | 0.004 | 0.569 | 0.6221 |
Paired t-test. NA: Not available; HPI: Hepatic perfusion index.
Figure 4.
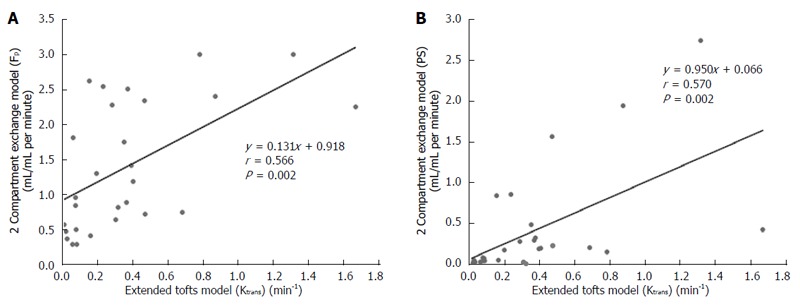
Scatterplots showing the correlation between Ktrans (min-1) obtained with the extended Tofts model and Fp (A) and PS (B) obtained with the 2-compartment exchange model.
Figure 5.
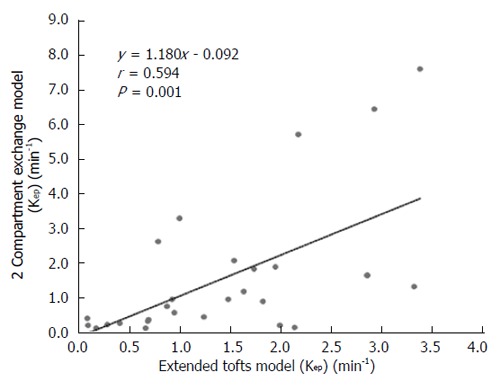
Scatterplot showing the significant correlation of Kep estimated with the extended Tofts model and the 2-compartment exchange model.
Figure 6.
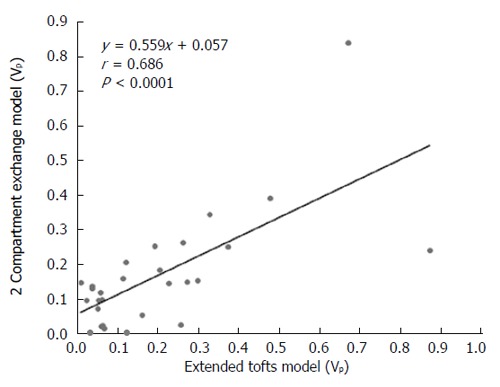
Scatterplot showing that vp values are correlated between the extended Tofts model and the 2-compartment exchange model.
Figure 7.
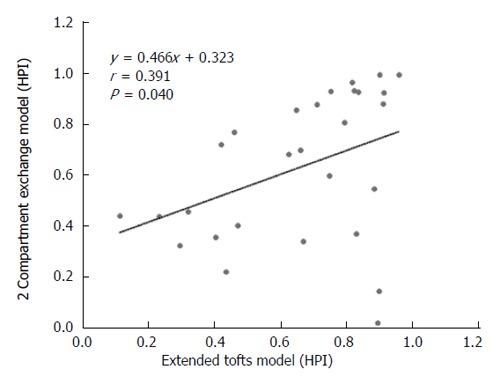
Scatterplot showing the correlation of hepatic perfusion index estimated with the extended Tofts model and the 2-compartment exchange model.
Figure 8.
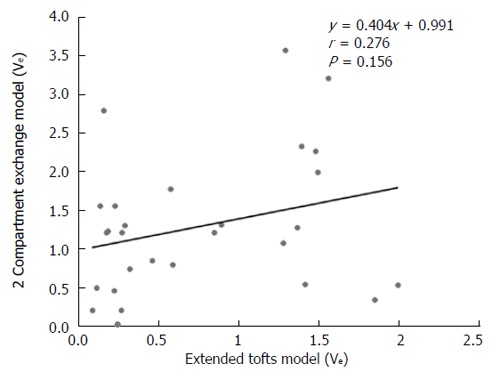
Scatterplot showing that ve is not correlated in the extended Tofts model and the 2-compartment exchange model.
DISCUSSION
In recent decades, non-surgical therapies, such as antiangiogenic targeted drugs, radiofrequency ablation, and TACE, play an important role in the HCC therapy regime, and the therapeutic efficacy evaluation of these therapy methods has become an important issue. Response Evaluation Criteria In Solid Tumors (RECIST) or modified RECIST (mRECIST) are common criteria in evaluating a therapeutic effect. Specifically, mRECIST takes into account the contrast enhancement in the arterial phase to evaluate the viable tumor component[16,17]. These modified evaluation criteria imply that the assessment of tumor vascular properties not only contributes to HCC diagnosis but also is helpful in evaluating the therapeutic efficacy of treatments for this tumor. Recently, research has suggested that DCE-MRI allows the quantitative measurement of pharmacokinetic parameters related to perfusion and permeability and provides a more comprehensive assessment of a tumor’s physiologic properties[7]. However, finding a suitable tracer kinetic model that takes into account the actual physiopathological status to evaluate the tumor microvascular parameters under the condition of sufficient MRI temporal resolution and spatial resolution is critical.
Several studies have assessed the microvascular properties of HCC using single-input, single-compartment or two-compartment tracer kinetic models in monitoring the therapeutic response to interventional therapy or antiangiogenic drug treatment[7,8,18]. However, according to Thng et al[11] and Van et al[12], the parenchyma in HCC consists of the vascular space and the interstitial space and is supplied by both the portal vein and the hepatic artery in different proportions. We assume that the dual-input two-compartment tracer kinetic model may be suitable for evaluating the microvascular properties of HCC under the conditions of a high field strength MR machine. The purpose of this prospective study was to investigate the feasibility of a dual-input extended Tofts model and a dual-input 2CXM for evaluating microvasculature properties in advanced HCC.
The liver is a hypervascular organ supplied by the portal vein (75%) and the hepatic artery (25%)[19]. However, neovascularization in HCC is predominantly supplied by the hepatic artery, but it is supplemented by the portal vein[20]. HPI describes the relative contribution of arterial vs portovenous flow to the total liver perfusion, which is a semi-quantitative descriptor of liver vascularity[11]. In this study, we applied this perfusion parameter to observe the contribution of arterial flow to the HCC in order to verify the assumption that a dual-input model is appropriate in evaluating the pharmacokinetic parameters in most cases of HCC. Our study shows that HPI was 0.66 and 0.63 in the dual-input extended Tofts model and dual-input 2CXM, respectively. This finding is consistent with the assumption that a dual input is a realistic blood supply model in most cases of HCC and also shows that hepatic artery blood flow accounts for the majority but not all of total blood flow to advanced HCC.
Ktrans is an important pharmacokinetic parameter to assess vascular permeability and therapeutic effects after non-operation treatment in HCC. Previous studies have suggested that a larger drop of Ktrans is correlated with favorable clinical outcomes after sunitinib or Floxuridine therapy[7,8]. Depending on the balance between PS and Fp in the tissue of interest, Ktrans has three physiologic interpretations: in a high PS status (PS >> Fp), Ktrans is approximately equal to Fp; conversely, in high Fp situations (Fp >> PS), Ktrans is approximately equal to PS; and under mixed flow and permeability limited conditions, Ktrans is the product (EFp) of the initial extraction fraction (E) and Fp[21]. Tofts et al[21] and Bergamino et al[22] noted that the extended Tofts model provides accurate permeability values for only tissues that are weakly vascularized or highly perfused with a relatively high Fp. Our study results show that Fp is greater than PS in the dual-input 2CXM, and the value of Ktrans in the dual-input extended Tofts model is close to that of PS. Moreover, both Fp and PS are correlated with Ktrans. These findings are consistent with the second interpretation of the relationship among Ktrans, Fp, and PS proposed by Tofts et al[21] and demonstrate that the dual-input two-compartment tracer kinetic model conforms to the physiologic properties in cases of HCC (high perfusion with relative high Fp) and could be applied to evaluate the perfusion and permeability of pre-therapeutic HCC.
However, the most important role of quantitative DCE-MRI is the assessment of treatment efficacy in advanced HCC after non-surgical methods. These treatments may not produce a change in Ktrans because Fp and PS may change in opposite directions. On the other hand, Fp and PS may be changed in varying proportions. In these types of situations, it is important to understand which part of the vasculature is affected by the treatment. The dual-input 2CXM is able to provide a separate evaluation of PS and Fp, while the extended Tofts model only provides an assessment of Ktrans, which reflects a combination of these two parameters; therefore, the dual-input 2CXM may have an advantage over the dual-input extended Tofts model.
kep is the reflux ratio of the transfer constant between EES and blood plasma. The amounts of kep in the two models are much larger than the Ktrans or PS in our study, which also shows no significant difference but certain correlation between the two models with respect to this parameter. As a hypervascular tumor, the contrast agent in the tumor vasculature leaks into EES, and, with the hemodynamics progress, the contrast agent concentration in the EES increases but the tracer in the tumor vasculature decreases because the tracer is not only leaking into EES but also being eliminated from the plasma, which may cause a relative larger kep. Like Ktrans, kep is an important predictable biomarker, and research has shown that a decrease in kep is correlated with favorable clinical outcomes after antiangiogenic drug treatment[8].
Theoretically, hypervascular tumors are usually composed of a larger vascular space (vp) relative to the interstitial space (ve) and show a pattern of rapid arterial enhancement followed by washout, whereas a hypovascular tumor usually consists of a larger ve relative to the vp and shows progressive enhancement[10]. However, our study shows that median ve is far greater than vp in both the extended Tofts model and the 2CXM model. This result seems contradictory. The possible reasons for this result are that high blood flow in tumor vasculature results in great hydrodynamic pressure, the contrast agent enters into EES, and the available amount of extracellular space for this tracer to leak into increases; meanwhile, HCC, as a malignant tumor, usually contains a relatively larger EES. An additional reason may be the technology field. One animal DCE-MRI study assessing rat HCC shows that ve is significantly larger than vp in the extended Tofts model (also called the extended Kety model). The authors believe that kep and the sum of vp and ve are relatively invariant, and the underestimation of vp leads to overestimations of ve which are most severe in the Tofts (Kety) model because vp is not considered in that model[23]. However, more studies are needed to elucidate the relationship between ve and vp.
In this study, ve is significantly larger in the 2CXM than in the extended Tofts model, with no correlation between the two models. We believed that the relatively lower temporal resolution applied in the 2CXM may have caused this outcome. The 2CXM is more complicated and requires a higher temporal resolution than the extended Tofts model[22]. We acquired data for the 2CXM and the extended Tofts model using the same temporal resolution (6 second), which may have caused the ve derived from the 2CXM to be overestimated.
There is no significant correlation between tumor size and stage and the microvascular perfusion and permeability in HCC. We believe the main reason for this result is the component we selected to measure the microvascular properties in HCC because we avoid the necrosis, hemorrhage, and adipose degeneration in the tumors, and these pathologic changes are usually relative to the tumor size and stage.
Some limitations of our study should be noted. First, no standard reference was used for any of the parameters. The perfusion and permeability parameters are functional biomarkers, and these parameters could not be measured from the pathological sample in vitro. We unavoidably used a well-known consensus as a reference standard that advanced HCC is supplied by the hepatic artery and portal vein with relatively high perfusion. We did not obtain histopathologic confirmation in the 18 HCC patients diagnosed by EASL criteria, as we did not know the grade of the tumor and the degree of cirrhosis around the mass. HCC grade may have influenced the parameters of perfusion and permeability. To date, most research related to HCC has not mentioned the relationship between the grade and the microvascular properties, and we believe it is worthy of future study. Second, the sample size is relatively small, and the relationship between ve and vp must be further validated in larger prospective studies. In addition, the temporal resolution of the acquired image data in this study is 6 s. This resolution may not be high enough for the 2CXM model to measure the tumor interstitial parameter ve. Finally, patients were instructed to freely breathe during imaging acquisition; this operation method and the patients’ heart beat may together result in movement artifacts. We used non-rigid registration as much as possible to diminish the influence of imaging quality caused by movement artifacts.
In conclusion, all of the results derived from this prospective study indicate that the dual-input two-compartment tracer kinetic model could reflect the microvascular properties before the treatment of advanced HCC. Additionally, the dual-input extended Tofts model is more stable in measuring the ve due to the suitable temporal resolution. Considering the therapeutic efficacy assessment of HCC treated by the antiangiogenic targeted drug, TACE, and radiofrequency ablation, the dual-input 2CXM may be more detailed and accurate than the dual-input extended Tofts model because the dual-input 2CXM can separately evaluate Fp and PS. This function is especially important if Fp and PS may change in opposite directions because Ktrans cannot reflect this change in the extended Tofts model. However, this assumption needs to be adequately verified by comparing microvasculature parameters derived from the two tracer kinetic models in advanced HCC after antiangiogenic-targeted drug treatment or TACE and is also one of the major purposes of our next study.
ACKNOWLEDGMENTS
The authors thank Dr. Xiao Xu, Dr. Zihua Su and Dr. Ning Wang, GE Healthcare (China), for their assistance in DCE-MRI analysis.
COMMENTS
Background
The parenchyma in hepatocellular carcinoma (HCC) consists of the vascular and interstitial space and is supplied by both the portal vein and the hepatic artery in different proportions; however, to date, the assessment of microvascular properties using a dual-input two-compartment tracer kinetic model with commonly used extracellular gadoliniun contrast agent has not been reported in HCC in a clinical practice setting.
Research frontiers
Some studies have shown the value of assessing microvascular properties in monitoring the effects of interventional therapy or antiangiogenic drug treatment of HCC, as well as metastases in the liver, using single-input single compartment, single-input two-compartment or dual-input single-compartment tracer kinetic models to evaluate a tumor’s pharmacokinetic parameters. This study was designed to confirm that a dual-input two-compartment tracer kinetic model could be applied in advanced HCC.
Innovations and breakthroughs
This is the first study to explore and confirm that the dual-input two-compartment tracer kinetic model is suitable to evaluate microvascular physiologic properties in advanced HCC.
Applications
A dual-input two-compartment tracer kinetic model should be applied in assessing tumor microvascular pharmacokinetic parameters in advanced HCC.
Terminology
Dynamic contrast-enhanced-magnetic resonance imaging (MRI) is one of the functional imaging methods of MRI and is used to evaluate microvascular perfusion and permeability in lesions by observing pharmacokinetic parameters.
Peer-review
Although this manuscript is quite “technical”, it is interesting to read (also from the clinical point of view). Potential shortcomings (e.g., the rather small sample size) of the study are duly mentioned by the authors at the end of the “discussion”.
Footnotes
Supported by Public Welfare Projects of Science Technology Department of Zhejiang Province, No. 2014C33151; Medical Research Programs of Zhejiang province, No. 2014KYA215, No. 2015KYB398, No. 2015RCA024 and No. 2015KYB403; and Research Projects of Public Technology Application of Science and Technology of Shaoxing City, No. 2013D10039.
Institutional review board statement: The study was reviewed and approved by the Ethics Committee of Shaoxing People’s Hospital (Shaoxing Hospital of Zhejiang University).
Informed consent statement: All study participants, or their legal guardian, provided informed written consent prior to study enrollment.
Conflict-of-interest statement: The authors declare that there is no conflict of interest.
Data sharing statement: No additional data are available.
Open-Access: This article is an open-access article which was selected by an in-house editor and fully peer-reviewed by external reviewers. It is distributed in accordance with the Creative Commons Attribution Non Commercial (CC BY-NC 4.0) license, which permits others to distribute, remix, adapt, build upon this work non-commercially, and license their derivative works on different terms, provided the original work is properly cited and the use is non-commercial. See: http://creativecommons.org/licenses/by-nc/4.0/
Peer-review started: October 27, 2015
First decision: December 11, 2015
Article in press: December 30, 2015
P- Reviewer: Cerwenka HR S- Editor: Ma YJ L- Editor: Wang TQ E- Editor: Zhang DN
References
- 1.Pang TC, Lam VW. Surgical management of hepatocellular carcinoma. World J Hepatol. 2015;7:245–252. doi: 10.4254/wjh.v7.i2.245. [DOI] [PMC free article] [PubMed] [Google Scholar]
- 2.Corona-Villalobos CP, Halappa VG, Geschwind JF, Bonekamp S, Reyes D, Cosgrove D, Pawlik TM, Kamel IR. Volumetric assessment of tumour response using functional MR imaging in patients with hepatocellular carcinoma treated with a combination of doxorubicin-eluting beads and sorafenib. Eur Radiol. 2015;25:380–390. doi: 10.1007/s00330-014-3412-6. [DOI] [PMC free article] [PubMed] [Google Scholar]
- 3.O’Connor JP, Rose CJ, Jackson A, Watson Y, Cheung S, Maders F, Whitcher BJ, Roberts C, Buonaccorsi GA, Thompson G, et al. DCE-MRI biomarkers of tumour heterogeneity predict CRC liver metastasis shrinkage following bevacizumab and FOLFOX-6. Br J Cancer. 2011;105:139–145. doi: 10.1038/bjc.2011.191. [DOI] [PMC free article] [PubMed] [Google Scholar]
- 4.Teo QQ, Thng CH, Koh TS, Ng QS. Dynamic contrast-enhanced magnetic resonance imaging: applications in oncology. Clin Oncol (R Coll Radiol) 2014;26:e9–20. doi: 10.1016/j.clon.2014.05.014. [DOI] [PubMed] [Google Scholar]
- 5.Hirashima Y, Yamada Y, Tateishi U, Kato K, Miyake M, Horita Y, Akiyoshi K, Takashima A, Okita N, Takahari D, et al. Pharmacokinetic parameters from 3-Tesla DCE-MRI as surrogate biomarkers of antitumor effects of bevacizumab plus FOLFIRI in colorectal cancer with liver metastasis. Int J Cancer. 2012;130:2359–2365. doi: 10.1002/ijc.26282. [DOI] [PubMed] [Google Scholar]
- 6.De Bruyne S, Van Damme N, Smeets P, Ferdinande L, Ceelen W, Mertens J, Van de Wiele C, Troisi R, Libbrecht L, Laurent S, et al. Value of DCE-MRI and FDG-PET/CT in the prediction of response to preoperative chemotherapy with bevacizumab for colorectal liver metastases. Br J Cancer. 2012;106:1926–1933. doi: 10.1038/bjc.2012.184. [DOI] [PMC free article] [PubMed] [Google Scholar]
- 7.Jarnagin WR, Schwartz LH, Gultekin DH, Gönen M, Haviland D, Shia J, D’Angelica M, Fong Y, Dematteo R, Tse A, et al. Regional chemotherapy for unresectable primary liver cancer: results of a phase II clinical trial and assessment of DCE-MRI as a biomarker of survival. Ann Oncol. 2009;20:1589–1595. doi: 10.1093/annonc/mdp029. [DOI] [PMC free article] [PubMed] [Google Scholar]
- 8.Sahani DV, Jiang T, Hayano K, Duda DG, Catalano OA, Ancukiewicz M, Jain RK, Zhu AX. Magnetic resonance imaging biomarkers in hepatocellular carcinoma: association with response and circulating biomarkers after sunitinib therapy. J Hematol Oncol. 2013;6:51. doi: 10.1186/1756-8722-6-51. [DOI] [PMC free article] [PubMed] [Google Scholar]
- 9.Khalifa F, Soliman A, El-Baz A, Abou El-Ghar M, El-Diasty T, Gimel’farb G, Ouseph R, Dwyer AC. Models and methods for analyzing DCE-MRI: a review. Med Phys. 2014;41:124301. doi: 10.1118/1.4898202. [DOI] [PubMed] [Google Scholar]
- 10.Sourbron SP, Buckley DL. Tracer kinetic modelling in MRI: estimating perfusion and capillary permeability. Phys Med Biol. 2012;57:R1–33. doi: 10.1088/0031-9155/57/2/R1. [DOI] [PubMed] [Google Scholar]
- 11.Thng CH, Koh TS, Collins DJ, Koh DM. Perfusion magnetic resonance imaging of the liver. World J Gastroenterol. 2010;16:1598–1609. doi: 10.3748/wjg.v16.i13.1598. [DOI] [PMC free article] [PubMed] [Google Scholar]
- 12.Van Beers BE, Daire JL, Garteiser P. New imaging techniques for liver diseases. J Hepatol. 2015;62:690–700. doi: 10.1016/j.jhep.2014.10.014. [DOI] [PubMed] [Google Scholar]
- 13.European Association For The Study Of The Liver; European Organisation For Research And Treatment Of Cancer. EASL-EORTC clinical practice guidelines: management of hepatocellular carcinoma. J Hepatol. 2012;56:908–943. doi: 10.1016/j.jhep.2011.12.001. [DOI] [PubMed] [Google Scholar]
- 14.Donaldson SB, West CM, Davidson SE, Carrington BM, Hutchison G, Jones AP, Sourbron SP, Buckley DL. A comparison of tracer kinetic models for T1-weighted dynamic contrast-enhanced MRI: application in carcinoma of the cervix. Magn Reson Med. 2010;63:691–700. doi: 10.1002/mrm.22217. [DOI] [PubMed] [Google Scholar]
- 15.Tofts PS. Modeling tracer kinetics in dynamic Gd-DTPA MR imaging. J Magn Reson Imaging. 1997;7:91–101. doi: 10.1002/jmri.1880070113. [DOI] [PubMed] [Google Scholar]
- 16.Bruix J, Sherman M, Llovet JM, Beaugrand M, Lencioni R, Burroughs AK, Christensen E, Pagliaro L, Colombo M, Rodés J. Clinical management of hepatocellular carcinoma. Conclusions of the Barcelona-2000 EASL conference. European Association for the Study of the Liver. J Hepatol. 2001;35:421–430. doi: 10.1016/s0168-8278(01)00130-1. [DOI] [PubMed] [Google Scholar]
- 17.Llovet JM, Di Bisceglie AM, Bruix J, Kramer BS, Lencioni R, Zhu AX, Sherman M, Schwartz M, Lotze M, Talwalkar J, et al. Design and endpoints of clinical trials in hepatocellular carcinoma. J Natl Cancer Inst. 2008;100:698–711. doi: 10.1093/jnci/djn134. [DOI] [PubMed] [Google Scholar]
- 18.Lee SH, Hayano K, Zhu AX, Sahani DV, Yoshida H. Dynamic Contrast-Enhanced MRI Kinetic Parameters as Prognostic Biomarkers for Prediction of Survival of Patient with Advanced Hepatocellular Carcinoma: A Pilot Comparative Study. Acad Radiol. 2015;22:1344–1360. doi: 10.1016/j.acra.2015.05.012. [DOI] [PubMed] [Google Scholar]
- 19.Chiandussi L, Greco F, Sardi G, Vaccarino A, Ferraris CM, Curti B. Estimation of hepatic arterial and portal venous blood flow by direct catheterization of the vena porta through the umbilical cord in man. Preliminary results. Acta Hepatosplenol. 1968;15:166–171. [PubMed] [Google Scholar]
- 20.Hayashi M, Matsui O, Ueda K, Kawamori Y, Gabata T, Kadoya M. Progression to hypervascular hepatocellular carcinoma: correlation with intranodular blood supply evaluated with CT during intraarterial injection of contrast material. Radiology. 2002;225:143–149. doi: 10.1148/radiol.2251011298. [DOI] [PubMed] [Google Scholar]
- 21.Tofts PS, Brix G, Buckley DL, Evelhoch JL, Henderson E, Knopp MV, Larsson HB, Lee TY, Mayr NA, Parker GJ, et al. Estimating kinetic parameters from dynamic contrast-enhanced T(1)-weighted MRI of a diffusable tracer: standardized quantities and symbols. J Magn Reson Imaging. 1999;10:223–232. doi: 10.1002/(sici)1522-2586(199909)10:3<223::aid-jmri2>3.0.co;2-s. [DOI] [PubMed] [Google Scholar]
- 22.Bergamino M, Bonzano L, Levrero F, Mancardi GL, Roccatagliata L. A review of technical aspects of T1-weighted dynamic contrast-enhanced magnetic resonance imaging (DCE-MRI) in human brain tumors. Phys Med. 2014;30:635–643. doi: 10.1016/j.ejmp.2014.04.005. [DOI] [PubMed] [Google Scholar]
- 23.Michoux N, Huwart L, Abarca-Quinones J, Dorvillius M, Annet L, Peeters F, Van Beers BE. Transvascular and interstitial transport in rat hepatocellular carcinomas: dynamic contrast-enhanced MRI assessment with low- and high-molecular weight agents. J Magn Reson Imaging. 2008;28:906–914. doi: 10.1002/jmri.21524. [DOI] [PubMed] [Google Scholar]


