

Abstract
Background and Purpose. Regulatory T cells (Tregs) have been suggested to modulate stroke-induced immune responses. However, analyses of Tregs in patients and in experimental stroke have yielded contradictory findings. We performed the current study to assess the regulation and function of Tregs in peripheral blood of stroke patients. Age dependent expression of CD39 on Tregs was quantified in mice and men. Methods. Total FoxP3+ Tregs and CD39+FoxP3+ Tregs were quantified by flow cytometry in controls and stroke patients on admission and on days 1, 3, 5, and 7 thereafter. Treg function was assessed by quantifying the inhibition of activation-induced expression of CD69 and CD154 on T effector cells (Teffs). Results. Total Tregs accounted for 5.0% of CD4+ T cells in controls and <2.8% in stroke patients on admission. They remained below control values until day 7. CD39+ Tregs were most strongly reduced in stroke patients. On day 3 the Treg-mediated inhibition of CD154 upregulation on CD4+ Teff was impaired in stroke patients. CD39 expression on Treg increased with age in peripheral blood of mice and men. Conclusion. We demonstrate a loss of active FoxP3+CD39+ Tregs from stroke patient's peripheral blood. The suppressive Treg function of remaining Tregs is impaired after stroke.
1. Introduction
Ischemic stroke-induced immune alterations (SIIA) are thought to affect the outcome of stroke patients, in part by enhancing their susceptibility to bacterial infection. This has been shown in experimental stroke models and in patients [1–3]. The alterations in the immune system are thought to be mediated by rapid activation of the autonomic nervous system and the hypothalamic-pituitary-adrenal (HPA) axis. In stroke patients, plasma levels of stress hormones correlate with the extent of immune alterations [4, 5].
In addition to the systemic immune-suppressive alterations observed in the peripheral blood, a local inflammatory immune response also develops. Within 24 h, leukocytes accumulate in the ischemic brain region [6, 7]. Recent observations suggest that lymphocytes but not granulocytes can trespass the blood brain barrier and infiltrate the ischemic lesion and the penumbra [8–10]. To date, the mechanisms that regulate this local inflammatory response and the role of the leukocyte subtypes involved are only partially understood. In experimental stroke models, T cells sensitized to CNS antigens have been transferred into mice lacking B and T cells. These autoreactive T cells were found in the stroke lesion, and their transfer enhanced the severity of stroke [11]. Furthermore, immunological tolerization of T cells to CNS autoantigens has beneficial effects on experimental stroke outcome [12]. Together, these data suggest that local inflammation following stroke has some autoimmune properties.
Regulatory T cells (Tregs) are modulators of adaptive immune responses and play an important role in maintaining tolerance to self-antigens. Depletion of murine CD25+CD4+ Tregs or abrogation of their function exacerbates various autoimmune diseases, including autoimmune gastritis, thyroiditis, and type 1 diabetes [13]. Thus, it has been hypothesized that, in stroke, Tregs may dampen the immunological cascades that result in secondary brain damage, which is not directly caused by ischemia. This concept is supported by the findings of Liesz et al., who used antibody-mediated depletion of CD25+ cells to eliminate Tregs and reported worse outcome in an experimental stroke model [14]. In contrast, Kleinschnitz et al. have reported that depleting FoxP3+ Tregs with an inducible diphtheria toxin receptor construct under the control of the FoxP3 promoter decreased brain damage [15]. Additional conflicting data have been reported, wherein Treg depletion using a similar mouse model in a different experimental stroke model did not alter the infarct volume within the initial 4 days after stroke [16]. More recently, controversial data continue to be reported from experimental stroke models. Boosting Treg function with a superagonistic anti-CD28 antibody (CD28SA) 3 h after middle cerebral artery occlusion (MCAO) reduced brain damage and improved outcome, while pretreatment with the same CD28SA antibody worsened clinical outcome and treatment immediately after MCAO had no effect on the ischemic brain volume in another study [17, 18]. In humans, Treg enumeration and function in peripheral blood have also yielded contradictory results. While Hug et al. were unable to detect changes in Treg function in patients with ischemic stroke [5], Yan et al. reported impaired function, but an increased percentage of Tregs [19].
In part, these contradictory findings could result from the fact that even FoxP3+ Tregs are not a homogenous population; instead, they can be divided into several subgroups that differ in function and can be distinguished by surface antigen expression [20]. CD45RA is expressed on naive FoxP3+ cells. Even in adulthood, some naive FoxP3+ cells can be found in the circulation. Upon antigen stimulation, CD45RA+ Tregs lose their CD45RA expression, start to proliferate, and differentiate to a more-suppressive Treg phenotype [13, 20]. CD39 is a rate-limiting ectonucleotidase that cleaves the proinflammatory extracellular adenosine triphosphate (ATP) [21, 22] to inhibitory and antiproliferative adenosine monophosphate [23]. Indeed, expression of CD39 has been shown to identify functionally active, suppressive Tregs in rodents and humans [24].
We performed the current study to determine the regulation of Treg subsets and Treg function in the peripheral blood of human stroke patients.
2. Methods
2.1. Human Studies
2.1.1. Patients and Controls
Patients (age: >18 y) with acute middle cerebral artery infarction were eligible for the study within 12 h of disease onset. They were recruited at the Department of Neurology of the University Medicine Greifswald if their National Institutes of Health Stroke Scale (NIHSS) score was ≥6, they had no signs of infection on admission, and their plasma levels of C-reactive protein (CRP) were ≤50 mg/L and of procalcitonin (PCT) ≤0.5 ng/mL. Patients were excluded if they took immune-suppressive drugs, suffered from known malignancies, or had an NIHSS score of <6. Treatment complied with best medical care standards and took place in a dedicated stroke unit. Recombinant tissue plasminogen activator administration and thrombectomy took place as clinically indicated. Control subjects were either healthy or recruited from the Ophthalmology Clinics at the University Medicine Greifswald. Control subjects were of similar age and had no known neurological or immunological disorders and fulfilled the same criteria for CRP and PCT as stroke patients. Patient and control characteristics are listed in Table 1(a). In addition a cohort of 32 younger healthy controls (age 21–79 years) was recruited to analyze age dependency of CD39 expression on Treg.
Table 1.
(a) Subjects characteristics, Treg phenotyping. (b) Participants characteristics of patients (SAI+) suffering from an infection and patients (SAI−) who remained uninfected after stroke.
(a).
| Total number | Age† | NIHSS‡ | Lesion volume (mm3)§ | Localization of infarction | Thrombolysis/ thrombectomy |
Male | Female | |
|---|---|---|---|---|---|---|---|---|
| Control subjects |
26 | 69,5 (51–88) | NA | NA | NA | NA | 12 | 14 |
|
| ||||||||
| Stroke patients |
48 | 77 (55–93) | 13 (23–6) | 71,5 (4,99–1022) | 45 MCA 3 MCA + anterior |
17 | 16 | 32 |
(b).
| Total number | Age† | NIHSS‡ | Lesion volume (mm3)§ | Localization of infarction | Thrombolysis/ thrombectomy |
Male | Female | |
|---|---|---|---|---|---|---|---|---|
| Noninfected cohort (SAI−) |
15 | 77 (62–93) | 8 (6–23) | 44,05 (4,99–1022) | 15 MCA 1 MCA + anterior |
4 | 5 | 10 |
|
| ||||||||
| Infected cohort (SAI+) |
7 | 74 (55–87) | 17,5 (13–19) | 174,24 (18,52–318,27) | 7 MCA | 2 | 4 | 3 |
†Mean (range); ‡median (range); §median (range); NA: not applicable; MCA: middle cerebral artery; SAI: stroke associated infection.
Patients were allocated into the stroke associated infection (SAI+) cohort if they had developed (a) clinical signs of infection (pneumonia, urinary tract infections, and fever of unknown origin); (b) serum concentrations of CRP >50 mg/L; and (c) PCT serum concentrations >0.5 ng/mL. Only patients that matched none of the criteria throughout the whole study period were considered free of infection (SAI−). Patients who fulfilled some criteria but not all were excluded from the comparison of stroke patients with and without SAI. These criteria were designed to identify two distinct populations of patients as published previously [3]. Details on SAI+ and SAI− patients are given in Table 1(b).
2.1.2. Ethics Statement
The study protocol was approved by the ethics committee of the Medical Faculty, University of Greifswald (No. III UV 30/01). All patients gave written informed consent directly or through a surrogate where appropriate.
2.1.3. CT Imaging
Routine cerebral CT images (sequential cCT native, 4.5 mm slice thickness, and supra- and infratentorial; mAs = 50; kV = 120) were acquired on a 16-row multislice CT scanner (Somatom 16; Siemens Medical Systems, Erlangen, Germany). To calculate lesion size, images were analyzed with OSIRIX 5.6. Regions of interest were defined manually, and the lesion volume was calculated semiautomatically.
2.1.4. Blood Sampling
Blood samples were obtained immediately upon admission and then between 6:00 a.m. and 8:00 a.m. on days 1, 3, 5, and 7. Investigators were not blinded for control and stroke patient samples, but they were unaware of stroke severity.
2.1.5. Phenotyping of Human Tregs
Aliquots of 200 μL of whole blood, anticoagulated with ethylenediaminetetraacetic acid (EDTA), were incubated with appropriate combinations of fluorescence-conjugated monoclonal antibodies to stain surface molecules. After lysing of erythrocytes (Buffer A; Human FoxP3 Buffer Set, BD Biosciences, Heidelberg, Germany), cells were washed twice and prepared for intracellular staining without further stimulation. After 30 min incubation with anti-FoxP3-antibodies coupled with Alexa Fluor 647 (BioLegend, San Diego, CA, USA) and an additional washing step, cells were measured on a BD Canto II or BD LSR II flow cytometer (BD Biosciences, San Jose, CA, USA).
The monoclonal antibodies used to determine expression of cell surface molecules were CD25-PE-Cy7, CD49d-FITC, and CD4-V500 (BD Biosciences, Heidelberg, Germany) and CD45RA-PerCP-Cy5.5 and CD39-PE (BioLegend, San Diego, CA, USA). Isotype control antibodies coupled to PE, PerCP-Cy5.5, and Alexa Fluor 647 were from BioLegend and those coupled to FITC, PE-Cy7, and V500 were from BD Biosciences.
For each stroke patient or control sample six appropriate fluorescence minus one (FMO) controls were prepared to identify positive events by flow cytometry. To account for any nonspecific binding of the epitope-specific antibody the appropriate isotype control was added to each FMO control.
Tregs were quantified as CD4+CD49d−FoxP3+ cells. Human proinflammatory effector cells can be transiently FoxP3+ but bear CD49d. Therefore, CD49+ cells were excluded from the FoxP3+ population [27]. Within this population of Tregs, expression of CD45RA was used to identify naive Tregs, while CD39 surface expression was used to detect activated Tregs. There were no CD39+CD45RA+ cells; however, there was a consistent population of CD39+CD45RA− Tregs. Flow cytometry results were evaluated by FlowJo software 7.6.5 (Tree Star Inc., Ashland, OR, USA).
2.1.6. Isolation of Human Tregs
Tregs were isolated with the CD4+CD25+highCD127−/dim Regulatory T Cell Isolation Kit II (human) (Miltenyi Biotec GmbH, Bergisch Gladbach, Germany) according to the manufacturer's instructions. In brief, peripheral blood mononuclear cells (PBMCs) were isolated with a Ficoll gradient (Biochrom AG, Berlin, Germany). The CD4+CD25+CD127− T Cell Biotin-Antibody Cocktail II was used to negatively enrich for CD4+CD127− cells followed by a positive selection of CD25+ cells.
To assess the purity of these CD4+CD25+highCD127−/dim cells, samples and PBMCs were tested by flow cytometry. Hence, cells were incubated with the appropriate amount of extracellular antibody and prepared for intracellular staining with FoxP3-Alexa Fluor 647 (BioLegend) using the Human FoxP3 Buffer Set (BD Biosciences). For extracellular staining, CD25-PE-Cy7, CD4-FITC (both BD Biosciences), and CD127-Pacific Blue (BioLegend) were used. In all experiments, the purity of CD4+CD25+highCD127−/dimFoxP3+ cells was ≥95%.
2.1.7. Suppression Assay
Once the Tregs were isolated, they were incubated with 100 000/well PBMCs in different ratios (Treg : PBMC: 1 : 1, 1 : 2, and 1 : 4) in a flat-bottomed plate. In accordance with the instructions of the BD FastImmune Human Regulatory T Cell Function Kit (BD Biosciences), cells were activated with an appropriate amount of CD3/CD28 beads (Dynabeads Human T Activator CD3/CD28; Invitrogen, Carlsbad, CA, USA) and incubated with CD154-APC antibodies. After 7 h of incubation at 37°C and 5–7% CO2, cells were additionally stained with CD69-PE-Cy7, CD4-FITC, CD25-PE, and CD3-PerCP-Cy5.5 (BD FastImmune Human Regulatory T Cell Function Kit; BD Biosciences). Hence, CD25 served to discriminate Tregs from Teffs in this assay, since the molecule is constitutively expressed on the former but not yet induced within the 7 h activation period in the latter.
Samples were measured by flow cytometry on a BD LSR II (BD Biosciences) in accordance with the company's advice. T cell activation was evaluated on two T effector cell (Teff) populations, on CD25−CD3+CD4+ T helper cells and on CD25−CD3+CD4− cells, which are mainly CD8+ T cells and are therefore referred to as cytotoxic T cells within this paper. The suppressive capacity of the added CD4+CD25+highCD127−/dim Tregs was determined as inhibition of CD69 and CD154 expression on the Teff populations.
2.2. Animal Studies
2.2.1. Animals
All animal experiments were approved by the local government authorities (Landesamt für Landwirtschaft, Lebensmittelsicherheit und Fischerei (LALLF), Mecklenburg-Vorpommern). DEREG (Depletion of regulatory T cells) mice were bred in our animal facility (Zentrale Service- und Forschungseinrichtung für Versuchstiere (ZSFV), Greifswald). DEREG mice carry a DTR-eGFP (DTR: diphtheria toxin receptor, GFP: green fluorescent protein) transgene under the control of an additional FoxP3 promoter allowing Treg depletion by low dose diphtheria toxin injection [25]. Here, we only took advantage of the eGFP expression of Treg for the identification of the subset and did not deplete Treg cells.
2.2.2. Ischemia Model
Male undepleted DEREG mice of different ages (8–46 weeks) underwent left MCAO using the filament model. Anesthesia was induced at 2.5% isoflurane with 70% N2O/30%O2 and maintained at 2% isoflurane with 70% N2O/30%O2 during surgery. Body temperature was measured with a rectal probe and maintained using a feedback-controlled heating pad for a body temperature of 37°C ± 0.5°C. Briefly, the common carotid artery and the external carotid artery were dissected and ligated. A silicon-coated filament (Doccol Corporation, MA, USA) was introduced into the common carotid artery and advanced into the internal carotid artery until the origin of the middle cerebral artery. The surgery time for ischemia induction did not exceed 15 minutes. The filament was withdrawn after 45 min occlusion time. Body weight and body temperature were measured according to protocol.
2.2.3. Mouse MRI
For 7T-animal MRI (ClinScan, Bruker Biospin, Ettlingen, Germany) mice were anesthetized with 1-2% isoflurane and 1 L/min oxygen. During brain scans respiration was monitored and animals were kept warm using an external water bath. For brain scans at day 1 after MCAO a 3D-T2 weighted imaging (mouse brain coil, TR = 2000 ms, TE = 37 ms, FoV 19 × 25 mm, thickness 0.45 mm) and additional diffusion weighted imaging for visualization of the acute infarct were performed. For evaluation of T2 lesion volume of the brain MRI data were analyzed by two independent investigators with respect to lesion location and size. Regions of interest were selected manually and the volume was calculated semiautomatically using OsiriX software.
2.2.4. Flow Cytometry of CD39 Expression on Murine Treg
CD39 expression was determined on FoxP3 expressing Treg of naive (8–48 weeks old) and stroked undepleted DEREG mice. Transient MCAO was described before. Similar to naive mice, on d3 following stroke blood was withdrawn directly from the heart and anticoagulated with EDTA. Spleens were then collected after transcardial perfusion with ice-cold 0.9% saline in deeply anesthetized mice. After homogenization and hypotonic lysis of red blood cells, the single cell suspension was used for flow cytometric analysis of CD39 expression on CD4+ FoxP3+ Treg. Unwanted Fc receptor staining was blocked by initial incubation of cell suspensions with TruStainFcX13 (anti-mouse CD16/32, BioLegend, San Diego, CA, USA). Tregs were identified by anti-CD4-Brilliant Violet 605 antibody (BioLegend, San Diego, CA, USA) and the transgenic expression of eGFP under control of the FoxP3 promotor. CD39 surface expression was determined on CD4+FoxP3+ lymphocytes by staining of CD39 with an anti-CD39-PE antibody (BioLegend) and its isotype control IgG2a PE (BioLegend, San Diego, CA, USA). Flow cytometry was performed on a Becton Dickinson LSRII. Data were analyzed using FlowJo (Tree Star Inc., OR, USA).
2.3. Statistical Analysis
All datasets were tested for deviations from Gaussian distribution with the Kolmogorov-Smirnov test. Data that passed the test were analyzed by repeated-measures analysis of variance (ANOVA), with Bonferroni's multiple-comparison test as a posttest. Since some of the data in each in vitro experiment failed the normality test, we used nonparametric testing throughout. The Kruskal-Wallis test, with Dunn's multiple-comparison test as a posttest, was used as appropriate. Posttests were only performed if the initial testing revealed significant differences between the groups. Correlations were determined by Pearson correlation analysis. Tests were performed with 95% confidence intervals (two tailed). All analyses were carried out with the software GraphPad-PRISM 5.0 (GraphPad Software Inc., San Diego, CA, USA). A p value of <0.05 was regarded as significant.
3. Results
3.1. CD39 Expression on Tregs Increases with Age
Since it is not known how age affects the CD39 subset of Tregs we determined the age dependent expression of CD39 on CD49−FoxP3+ Tregs. In our population the percentage of Tregs of CD4+ T cells did not change significantly, while the percentage of CD45RA expressing naive Tregs declined with age (r = −0.8422; p < 0.0001) (Supplemental Figure S1) (see Supplementary Material available online at http://dx.doi.org/10.1155/2016/2974605). CD39 expression increased with age (r = 0.6612; p < 0.0001) (Figure 1(a)).
Figure 1.

CD39 expression on Treg correlates positively with age in man and mice. (a) Human, peripheral blood: the percentage of CD39 expression was determined on CD4+CD25+CD49d−FoxP3+ Treg and correlated to age for a total of 45 healthy controls (age from 21 to 88 years). Pearson r = 0.6612, p < 0.0001, and R squared = 0.4372. (b) Mice, blood: the percentage of CD39 expression was determined on CD4+CD25+CD49d−FoxP3+ Treg and correlated to age for a total of 15 naive animals (age from 8 to 48 weeks). Pearson r = 0.7895, p < 0.0005, and R squared = 0.6233.
3.2. Tregs Are Reduced in the Peripheral Blood of Stroke Patients
Flow cytometric analysis confirmed the well-described loss of lymphocytes in the peripheral blood of stroke patients, which was highly significant on all days (p = 0.0035). The proportion of CD4+ T cells to total lymphocytes was not significantly altered in this stroke patient cohort, indicating that CD4+ T cells are lost in a similar quantity from peripheral blood as CD4− lymphocytes (Figure 2). Total Tregs, which accounted for 5.0% (median) (range 1.3–10.2%) of CD4+ T cells in healthy controls, were reduced in stroke patients to 2.8% (median) (range 0.03–8.1%) on admission and remained below control values until day 7 (p = 0.0095). This reduction was due to a loss of CD39+ activated Tregs (p = 0.0335), which reached a minimum of 1.2% (median) (range 0.2–7.1%) of all CD4+ T cells on day 5. Naive Tregs, which express CD45RA, remained largely unchanged (Figure 2(c)). In controls, 92.1% median (range 71.0–98.3%) of Tregs expressed the activation marker CD25. In stroke patients, CD25 expression was not significantly altered (p = 0.0600) (Supplemental Figure S2A).
Figure 2.

T helper cells and Tregs and their subpopulations. Cytometric analysis of nonstroke controls (white bars) and stroke patients (dark grey bars) was performed for (a) lymphocytes (n control,d0,1,3,5,7 = 15, 35, 35, 35, 32, 30, resp.), shown as the percentage of leukocytes. ∗ p < 0.05, ∗∗ p < 0.01, and ∗∗∗ p < 0.001. (b) CD4+ T helper cells (n control,d0,1,3,5,7 = 15, 35, 35, 35, 32, 29, resp.), shown as the percentage of lymphocytes. (c) Total Tregs (n control,d0,1,3,5,7 = 15, 35, 35, 34, 32, 27, resp.) combined with their subpopulations. Naive Tregs (n control,d0,1,3,5,7 = 15, 34, 35, 33, 31, 27, resp.) are shown by dark grey bars and activated Tregs (n control,d0,1,3,5,7 = 14, 35, 34, 33, 32, 27, resp.) by light grey bars. Patient samples were obtained on admission (d0), the next morning (d1), and on days 3, 5, and 7 (d3, d5, and d7, resp.). ∗∗ p < 0.01 for Tregs in stroke patients versus controls; # p < 0.05 and ## p < 0.01 for activated Tregs in patients versus controls. Medians and interquartile ranges (a, b) are provided.
We also assessed the percentage of CD4+CD25+ cells in stroke patients, as this has been used previously as a marker for Tregs; however, activated T cells also upregulate CD25 on their cell surface. Stroke patients had 30.4% (median) (range 4.2–71.6%) CD4+CD25+ cells on the day of admission, which did not differ significantly from control values 41.2% (median) (range 5.1–73.7%) (p = 0.7886) (Supplemental Figure S2B).
No differences were seen when we compared the Treg populations between sexes. There was no robust correlation between percentage of Tregs and their subpopulations with respect to the neurological deficit or stroke size.
3.3. Age Dependent Regulation of CD39+ Treg in Mice
Using nondepleted DEREG animals the GFP expression of FoxP3+ Treg was used to quantify peripheral blood Treg. In aged mice the proportion of CD39 expressing Treg was increased compared to young adult mice (Figure 1(b)). Induction of cerebral ischemia by transient filament MCAO resulted in similar infarct sizes in young and aged mice (Figure 3(a)). Nevertheless CD39 expression on Treg in SIIA differed between young and aged animals. While there was no effect on CD39 expressing Treg in young mice the age related increase in CD39 expression in peripheral blood was reversed by MCAO in aged mice (Figure 3(b)).
Figure 3.

Age dependency of infarct volume and CD39 expression on Treg after experimental stroke in mice. (a) The infarct volume as assessed by MRI in young adult and aged mice was compared on day 1 after transient middle cerebral artery occlusion. (b) The CD39 expression on CD4+CD25+CD49d−FoxP3+ Treg in blood was compared between naive and stroked young adult and naive and stroked aged mice on day 3 after transient middle cerebral artery occlusion. ∗ p < 0.05, ∗∗ p < 0.01. Means and SEM are provided.
3.4. Impaired Treg Function in Stroke Patients
Treg function was quantified by inhibition of the activation-induced upregulation of CD69 and CD154 on the surface of Teffs. We therefore compared this activation marker expression on T helper cells and cytotoxic T cells derived from stroke patients and controls. Directly ex vivo T helper cells from stroke patients expressed more CD69 on their surface (p = 0.0243) compared to controls, while CD154 expression did not differ between the groups (p = 0.4140) (data not shown). There was no difference in the expression of CD69 or CD154 on cytotoxic T cells from control versus stroke patients (CD69, p = 0.2238, and CD154, p = 0.1449). Upon CD3/CD28 activation in vitro, no differences in CD69 or CD154 expression on the cell surface of either CD4+ T cells or CD8+ T cells were seen between stroke patients and controls (data not shown).
Treg-mediated inhibition of T helper cell activation was impaired in stroke patients. At a ratio of 1 : 2 and 1 : 1 Tregs : PBMCs, the inhibition of CD154 expression on CD4+ effector cells was reduced in stroke patients compared to healthy controls (p < 0.0001) (Figure 4(b)). Inhibition of the early-activation marker CD69 on T helper cells remained unaltered (Figure 4(a)). The effect of Tregs on cytotoxic T cells was not altered in stroke patients (Figures 4(c) and 4(d)).
Figure 4.

Suppressive activity of Tregs. Treg function was evaluated by measuring the CD4+CD25+CD127dim/− Treg-mediated inhibition of CD69 (a, c) and CD154 (b, d) induction on T effector cells (Teff) after anti-CD3/anti-CD28 stimulation. Suppression is shown for T helper cells (a, b) and cytotoxic T cells (c, d) in control subjects (white bars) versus stroke patients (dark grey bars) on day 3 with different Treg : PBMC concentrations (Treg : PBMC = 1 : 4; 1 : 2; and 1 : 1). n control,stroke on day 3 = 11 and 10, respectively. ∗ p < 0.05 and ∗∗ p < 0.01 for stroke patients versus controls. Medians and interquartile ranges are provided.
Since Yan et al. detected no changes in Treg in a cohort of stroke patients that remained free of infection throughout the hospital stay, we reanalyzed our data according to infection status [19, 26]. As shown in Figure 5 the effect of stroke on total Treg and subsets was more pronounced in those patients that went on to develop SAI during their hospitalization.
Figure 5.
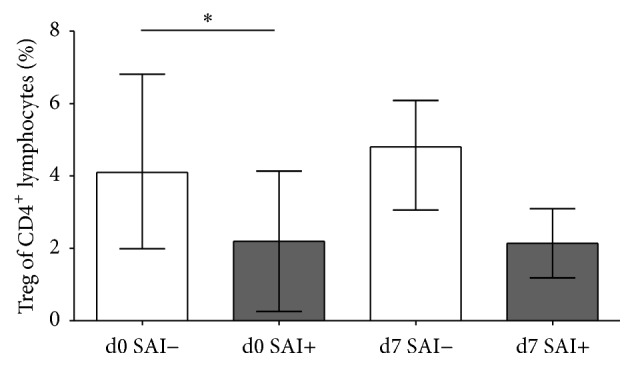
Comparison of SAI− and SAI+ patients. On the day of admission (d0) and day 7 after stroke (d7) the percentage of Treg of CD4+ T helper cells was compared between patients without poststroke infections SAI− (white bars; n d0,d7 = 14, 12, resp.) and patients with poststroke infections SAI+ (grey bars; n d0,d7 = 7, 7, resp.). ∗ p < 0.05. Means and SD are provided.
4. Discussion
In this study, we found decreased numbers and impaired function of Tregs in the peripheral blood of stroke patients. The decrease in Tregs following stroke was detectable upon admission and remained statistically significant through day 5. This reduction in Tregs was not evenly distributed among all FoxP3+ Treg subsets but was most pronounced in the active CD39+ Treg population.
The reduced efficacy of Treg-mediated Teff suppression in stroke patients is in agreement with reports by Yan et al., who found a similar suppression using proliferation as a read-out [19, 26]. However, a study by Hug et al. was unable to detect altered Treg function in stroke patients [5]. In this previous study, no dose-response curve was obtained and the suppression measurable using Tregs and Teffs of control individuals was only 10%. Therefore, the conditions chosen by Hug et al. for the assay may not have been sufficiently sensitive to detect impaired Treg function. We applied an assay that is based on activation marker expression on T responder cells rather than proliferation. The validity of inhibition of CD154 expression on Teff as a marker for Treg suppressive activity has been demonstrated [27]. This approach enabled us to distinguish between the effect of Treg on CD4+ and CD4− Teff.
Since all three studies used autologous Teff cells as responder cells, an enhanced resistance of Teff to Treg-mediated inhibition cannot be excluded. We observed a predominant loss of CD39 expressing Tregs, which represents the functionally active Treg subset, with a concomitant shift in Treg composition toward the naive subset. It is therefore plausible that Treg function rather than Teff susceptibility is impaired in stroke patients.
Our data corroborate recent observations by Li et al., who detected a reduced percentage and suppressive activity of Tregs in stroke patients, and extend their findings by demonstrating that functionally active CD39+ Tregs are predominantly reduced following stroke [28]. Furthermore, to our knowledge, this is the first study to address the inhibition of activation of cytotoxic Teffs in stroke patients. In contrast to the impaired inhibition of T helper cells, reduction of cytotoxic Teff activation was not altered in stroke patients.
Our quantitative findings, however, are in contrast to two reports by Yan et al., who detected an increase in FoxP3+ Tregs following stroke [19, 26]. These differences may be related to the stroke population recruited; in our study all patients had MCA ischemia and an NIHSS ≥6, whereas Yan et al. recruited all ischemic stroke patients, including those who were less severely affected. More importantly, Yan et al. excluded patients with “acute infections after stroke.” Since SAIs are more likely to occur in patients with stroke-induced immunosuppression [2], this approach is likely to exclude patients with the most severe stroke-induced immune alterations. In our study, we also excluded patients with signs of infection on admission; however, patients with subsequent SAIs were not excluded. To evaluate whether this could account for the apparent contradiction, we performed a subanalysis comparing patients with and without subsequent infections. While failing to reach statistical significance, Tregs appeared to be more strongly reduced in patients with SAI compared to those without SAI. This supports our hypothesis that the differences in patient populations may account for the seemingly contradictory findings between our findings and the data reported by Yan et al.
The major limitation of the study is the fact that our analysis is restricted to the peripheral blood as other immune compartments are not readily accessible in patients. Therefore we cannot exclude that the active Tregs have migrated into the tissues. Our animal data indicate that aged mice could provide a suitable model to determine the fate of Treg subsets following stroke. Immunosenescence has been shown to alter the clinical course of diseases and also affect Treg subsets [29–31]. We extend this knowledge by demonstrating that the active Treg population circulating in the peripheral blood increases with age. The role of Treg in regulating SIIA remains disputed and differs between the experimental models [14–18]. Our data suggest that Tregs are regulated differently during immunosenescence, an aspect rarely reflected in current experimental stroke models.
5. Conclusion
Our data demonstrate that CD4+CD49−Foxp3+ Tregs are reduced in the peripheral blood of stroke patients. Among those the active CD39+ Treg subset is the most affected, a finding mirrored in functional studies demonstrating impaired suppressive activity of stroke patient derived Treg in vitro. Whether these alterations contribute to secondary immune-mediated brain damage or whether reduced Treg function is beneficial in stroke remains to be investigated. The observation that the proportion of Treg expressing CD39 increases with age and is differentially regulated in young adult and aged mice highlights the importance to consider immunosenescence in the design of experimental stroke models.
Supplementary Material
The percentage of CD45RA expressing naive Tregs declined with age in humans (r=-0.8422; p<0.0001) (Fig. S1).
In stroke patients, CD25 expression was not significantly altered (p=0.0600) (Fig. S2A).
We also assessed the percentage of CD4+CD25+ cells in stroke patients, as this has been used previously as a marker for Tregs; however, activated T cells also upregulate CD25 on their cell surface. Stroke patients had 30.4% (median) (range 4.2–71.6%) CD4+CD25+ cells on the day of admission, which did not differ significantly from control values 41.2% (median); (range 5.1–73.7%) (p=0.7886) (Fig. S2B).
Acknowledgments
Antje Vogelgesang and Alexander Dressel received funding from the EU grant EnVision (FP7-REGPOT-2010, Grant no. 264143). Johanna Ruhnau and Marie Heinrich were funded by the Gerhard Domagk program of the University Medicine Greifswald. Juliane Schulze was funded by the DFG Graduate School GRK840/1-03. The authors thank Dr. Stefan Clemens, Department of Ophthalmology, University Medicine Greifswald, for providing access to patients scheduled to receive cataract surgery. They also thank Dr. Jens Kühn, Department of Experimental Radiology, University Medicine Greifswald, for support in the animal MRI facility. DEREG mice breeding pairs were kindly provided by Jochen Hühn, Department of Experimental Immunology, Helmholtz Centre for Infection Research, Braunschweig, and Tim Sparwasser, Institute of Infection Immunology, TWINCORE, Centre for Experimental and Clinical Infection Research, a joint venture between the Medical School Hannover and the Helmholtz Centre for Infection Research, Hannover.
Disclosure
The funders had no role in the study design, data collection and the analysis, decision to publish, or preparation of the paper.
Competing Interests
The authors declare that there are no competing interests regarding the publication of this paper.
Authors' Contributions
Johanna Ruhnau and Juliane Schulze have contributed equally. Antje Vogelgesang and Alexander Dressel have contributed equally.
References
- 1.Prass K., Meisel C., Höflich C., et al. Stroke-induced immunodeficiency promotes spontaneous bacterial infections and is mediated by sympathetic activation reversal by poststroke T helper cell type 1–like immunostimulation. The Journal of Experimental Medicine. 2003;198(5):725–736. doi: 10.1084/jem.20021098. [DOI] [PMC free article] [PubMed] [Google Scholar]
- 2.Vogelgesang A., Dressel A. Immunological consequences of ischemic stroke: immunosuppression and autoimmunity. Journal of Neuroimmunology. 2011;231(1-2):105–110. doi: 10.1016/j.jneuroim.2010.09.023. [DOI] [PubMed] [Google Scholar]
- 3.Vogelgesang A., Grunwald U., Langner S., et al. Analysis of lymphocyte subsets in patients with stroke and their influence on infection after stroke. Stroke. 2007;39(1):237–241. doi: 10.1161/strokeaha.107.493635. [DOI] [PubMed] [Google Scholar]
- 4.Chamorro A., Amaro S., Vargas M., et al. Catecholamines, infection, and death in acute ischemic stroke. Journal of the Neurological Sciences. 2007;252(1):29–35. doi: 10.1016/j.jns.2006.10.001. [DOI] [PubMed] [Google Scholar]
- 5.Hug A., Liesz A., Muerle B., et al. Reduced efficacy of circulating costimulatory cells after focal cerebral ischemia. Stroke. 2011;42(12):3580–3586. doi: 10.1161/strokeaha.111.620948. [DOI] [PubMed] [Google Scholar]
- 6.Stubbe T., Ebner F., Richter D., et al. Regulatory T cells accumulate and proliferate in the ischemic hemisphere for up to 30 days after MCAO. Journal of Cerebral Blood Flow and Metabolism. 2013;33(1):37–47. doi: 10.1038/jcbfm.2012.128. [DOI] [PMC free article] [PubMed] [Google Scholar]
- 7.Yilmaz G., Granger D. N. Leukocyte Recruitment and Ischemic Brain Injury. NeuroMolecular Medicine. 2010;12(2):193–204. doi: 10.1007/s12017-009-8074-1. [DOI] [PMC free article] [PubMed] [Google Scholar]
- 8.Enzmann G., Mysiorek C., Gorina R., et al. The neurovascular unit as a selective barrier to polymorphonuclear granulocyte (PMN) infiltration into the brain after ischemic injury. Acta Neuropathologica. 2013;125(3):395–412. doi: 10.1007/s00401-012-1076-3. [DOI] [PMC free article] [PubMed] [Google Scholar]
- 9.Fumagalli S., Coles J. A., Ejlerskov P., et al. In vivo real-time multiphoton imaging of T lymphocytes in the mouse brain after experimental stroke. Stroke. 2011;42(5):1429–1436. doi: 10.1161/STROKEAHA.110.603704. [DOI] [PubMed] [Google Scholar]
- 10.Ortolano F., Maffia P., Dever G., et al. Advances in imaging of new targets for pharmacological intervention in stroke: real-time tracking of T-cells in the ischaemic brain. British Journal of Pharmacology. 2010;159(4):808–811. doi: 10.1111/j.1476-5381.2009.00527.x. [DOI] [PMC free article] [PubMed] [Google Scholar]
- 11.Becker K. J., Kindrick D. L., Lester M. P., Shea C., Ye Z. C. Sensitization to brain antigens after stroke is augmented by lipopolysaccharide. Journal of Cerebral Blood Flow and Metabolism. 2005;25(12):1634–1644. doi: 10.1038/sj.jcbfm.9600160. [DOI] [PMC free article] [PubMed] [Google Scholar]
- 12.Gee J. M., Kalil A., Thullbery M., Becker K. J. Induction of immunologic tolerance to myelin basic protein prevents central nervous system autoimmunity and improves outcome after stroke. Stroke. 2008;39(5):1575–1582. doi: 10.1161/strokeaha.107.501486. [DOI] [PMC free article] [PubMed] [Google Scholar]
- 13.Sakaguchi S., Miyara M., Costantino C. M., Hafler D. A. FOXP3+ regulatory T cells in the human immune system. Nature Reviews Immunology. 2010;10(7):490–500. doi: 10.1038/nri2785. [DOI] [PubMed] [Google Scholar]
- 14.Liesz A., Suri-Payer E., Veltkamp C., et al. Regulatory T cells are key cerebroprotective immunomodulators in acute experimental stroke. Nature Medicine. 2009;15(2):192–199. doi: 10.1038/nm.1927. [DOI] [PubMed] [Google Scholar]
- 15.Kleinschnitz C., Kraft P., Dreykluft A., et al. Regulatory T cells are strong promoters of acute ischemic stroke in mice by inducing dysfunction of the cerebral microvasculature. Blood. 2013;121(4):679–691. doi: 10.1182/blood-2012-04-426734. [DOI] [PMC free article] [PubMed] [Google Scholar]
- 16.Ren X., Akiyoshi K., Vandenbark A. A., Hurn P. D., Offner H. CD4+FoxP3+ regulatory T-cells in cerebral ischemic stroke. Metabolic Brain Disease. 2011;26(1):87–90. doi: 10.1007/s11011-010-9226-6. [DOI] [PMC free article] [PubMed] [Google Scholar]
- 17.Liesz A., Zhou W., Na S.-Y., et al. Boosting regulatory T cells limits neuroinflammation in permanent cortical stroke. The Journal of Neuroscience. 2013;33(44):17350–17362. doi: 10.1523/jneurosci.4901-12.2013. [DOI] [PMC free article] [PubMed] [Google Scholar]
- 18.Schuhmann M. K., Kraft P., Stoll G., et al. CD28 superagonist-mediated boost of regulatory T cells increases thrombo-inflammation and ischemic neurodegeneration during the acute phase of experimental stroke. Journal of Cerebral Blood Flow and Metabolism. 2015;35(1):6–10. doi: 10.1038/jcbfm.2014.175. [DOI] [PMC free article] [PubMed] [Google Scholar]
- 19.Yan J., Read S. J., Henderson R. D., et al. Frequency and function of regulatory T cells after ischaemic stroke in humans. Journal of Neuroimmunology. 2012;243(1-2):89–94. doi: 10.1016/j.jneuroim.2011.12.019. [DOI] [PubMed] [Google Scholar]
- 20.Miyara M., Sakaguchi S. Human FoxP3+ CD4+ regulatory T cells: their knowns and unknowns. Immunology and Cell Biology. 2011;89(3):346–351. doi: 10.1038/icb.2010.137. [DOI] [PubMed] [Google Scholar]
- 21.Gallucci S., Lolkema M., Matzinger P. Natural adjuvants: endogenous activators of dendritic cells. Nature Medicine. 1999;5(11):1249–1255. doi: 10.1038/15200. [DOI] [PubMed] [Google Scholar]
- 22.Matzinger P. The danger model: a renewed sense of self. Science. 2002;296(5566):301–305. doi: 10.1126/science.1071059. [DOI] [PubMed] [Google Scholar]
- 23.Borsellino G., Kleinewietfeld M., Di Mitri D., et al. Expression of ectonucleotidase CD39 by Foxp3+ Treg cells: hydrolysis of extracellular ATP and immune suppression. Blood. 2007;110(4):1225–1232. doi: 10.1182/blood-2006-12-064527. [DOI] [PubMed] [Google Scholar]
- 24.Mandapathil M., Lang S., Gorelik E., Whiteside T. L. Isolation of functional human regulatory T cells (Treg) from the peripheral blood based on the CD39 expression. Journal of Immunological Methods. 2009;346(1-2):55–63. doi: 10.1016/j.jim.2009.05.004. [DOI] [PMC free article] [PubMed] [Google Scholar]
- 25.Lahl K., Loddenkemper C., Drouin C., et al. Selective depletion of Foxp3+ regulatory T cells induces a scurfy-like disease. Journal of Experimental Medicine. 2007;204(1):57–63. doi: 10.1084/jem.20061852. [DOI] [PMC free article] [PubMed] [Google Scholar]
- 26.Yan J., Greer J. M., Etherington K., et al. Immune activation in the peripheral blood of patients with acute ischemic stroke. Journal of Neuroimmunology. 2009;206(1-2):112–117. doi: 10.1016/j.jneuroim.2008.11.001. [DOI] [PubMed] [Google Scholar]
- 27.Hill D., Eastaff-Leung N., Bresatz-Atkins S., et al. Inhibition of activation induced CD154 on CD4+ CD25− cells: a valid surrogate for human Treg suppressor function. Immunology and Cell Biology. 2012;90(8):812–821. doi: 10.1038/icb.2012.18. [DOI] [PubMed] [Google Scholar]
- 28.Li Q., Wang Y., Yu F., et al. Peripheral Th17/Treg imbalance in patients with atherosclerotic cerebral infarction. International Journal of Clinical and Experimental Pathology. 2013;6(6):1015–1027. [PMC free article] [PubMed] [Google Scholar]
- 29.Jagger A., Shimojima Y., Goronzy J. J., Weyand C. M. Regulatory T cells and the immune aging process: a mini-review. Gerontology. 2014;60(2):130–137. doi: 10.1159/000355303. [DOI] [PMC free article] [PubMed] [Google Scholar]
- 30.Murray M. A., Chotirmall S. H. The impact of immunosenescence on pulmonary disease. Mediators of Inflammation. 2015;2015:10. doi: 10.1155/2015/692546.692546 [DOI] [PMC free article] [PubMed] [Google Scholar]
- 31.Pera A., Campos C., López N., et al. Immunosenescence: implications for response to infection and vaccination in older people. Maturitas. 2015;82(1):50–55. doi: 10.1016/j.maturitas.2015.05.004. [DOI] [PubMed] [Google Scholar]
Associated Data
This section collects any data citations, data availability statements, or supplementary materials included in this article.
Supplementary Materials
The percentage of CD45RA expressing naive Tregs declined with age in humans (r=-0.8422; p<0.0001) (Fig. S1).
In stroke patients, CD25 expression was not significantly altered (p=0.0600) (Fig. S2A).
We also assessed the percentage of CD4+CD25+ cells in stroke patients, as this has been used previously as a marker for Tregs; however, activated T cells also upregulate CD25 on their cell surface. Stroke patients had 30.4% (median) (range 4.2–71.6%) CD4+CD25+ cells on the day of admission, which did not differ significantly from control values 41.2% (median); (range 5.1–73.7%) (p=0.7886) (Fig. S2B).