

Abstract
Transient hypoxia in pregnancy stimulates a physiological reflex response that redistributes blood flow and defends oxygen delivery to the fetal brain. We designed the present experiment to test the hypotheses that transient hypoxia produces damage of the cerebral cortex and that ketamine, an antagonist of NMDA receptors and a known anti‐inflammatory agent, reduces the damage. Late gestation, chronically catheterized fetal sheep were subjected to a 30‐min period of ventilatory hypoxia that decreased fetal PaO2 from 17 ± 1 to 10 ± 1 mmHg, or normoxia (PaO2 17 ± 1 mmHg), with or without pretreatment (10 min before hypoxia/normoxia) with ketamine (3 mg/kg, i.v.). One day (24 h) after hypoxia/normoxia, fetal cerebral cortex was removed and mRNA extracted for transcriptomics and systems biology analysis (n = 3–5 per group). Hypoxia stimulated a transcriptomic response consistent with a reduction in cellular metabolism and an increase in inflammation. Ketamine pretreatment reduced both of these responses. The inflammation response modeled with transcriptomic systems biology was validated by immunohistochemistry and showed increased abundance of microglia/macrophages after hypoxia in the cerebral cortical tissue that ketamine significantly reduced. We conclude that transient hypoxia produces inflammation of the fetal cerebral cortex and that ketamine, in a standard clinical dose, reduces the inflammation response.
Keywords: Fetal hypoxia, frontal cortex, immune response, ketamine
Introduction
Physiological responses to transient hypoxia are thought to protect the fetal brain and heart from the damaging effects of temporary interruptions in oxygen delivery. Cardiovascular and neuroendocrine reflex responses redirect the fetal combined ventricular output and increases blood flow toward brain, heart, and adrenals and away from skeletal muscle (Cohn et al. 1974). Severe or prolonged hypoxia produces multiple organ damage as a result of oxygen deprivation and metabolic acidosis. Cerebral cortex, cerebellum, and hippocampus are more susceptible to a hypoxic stimulus compared to other brain regions (Choi and Rothman 1990).
There have been several reports of increased markers of brain inflammation after ischemia or asphyxia in utero (Yafeng et al. 2009; Guo et al. 2010). The fetal inflammatory response is characterized by an increase in proinflammatory mediators such as IL6, IL1β, and TNFα expressed in activated immune cells in hypoxic brain regions (Rees and Inder 2005). Increased fetal brain inflammation and cell death are associated with known morbidities in the offspring premature birth (Rees and Inder 2005), and other disorders such as cerebral palsy (Nelson and Grether 1999), autism (Kinney et al. 2008), or schizophrenia (Stefanis et al. 1999).
NMDA receptor antagonists have been extensively reported to reduce brain damage induced by a hypoxic stimulus (Wieloch 1985; Gill et al. 1988; Hagberg et al. 1994). Among these drugs, ketamine is a U.S. Food and Drug Administration–approved noncompetitive NMDA receptor antagonist that has been shown to have anti‐inflammatory properties by reducing levels of IL6 and TNFα in early postoperative human patients (Beilin et al. 2007) and animals (Shaked et al. 2004; Lankveld et al. 2005). Previous studies also reported that ketamine has neuroprotective effects in vitro and in animal studies for up to 7 days (Himmelseher and Durieux 2005).
The present study was designed to assess the effect of transient maternal ventilatory hypoxia (i.e., not asphyxia and not prolonged hypoxia) on the fetal cerebral cortex, and the study was designed to test the effect of ketamine on these responses. We approached this question using transcriptomics technology, followed by systems biology analysis to broadly determine the tissue responses to hypoxia and modulation of those responses by ketamine. We chose to investigate the “wide‐angle view” of cellular responses at the mRNA level in order to identify interacting molecular pathways (not to identify single biomarkers) that could lead us to a better understanding of the mechanism of the cellular response to hypoxia and the mechanisms involved in modulation of those responses by ketamine.
Materials and Methods
These experiments were approved by the University of Florida Animal Care and Use Committee and were performed in accordance with the Guiding Principles for Use of Animals of the American Physiological Society. Sixteen chronically catheterized singleton (n = 1) or twin (n = 15) ovine fetuses were studied between the gestational age of 122 ± 5 days (full term = 145–147 days).
Fetal surgery
Ewes were fasted for 24 h before surgery, which was performed on 116 ± 3 days of gestation. Using aseptic technique, fetal and maternal femoral arteries and veins were chronically catheterized as described previously (Chang and Wood 2015). Briefly, the ewes were given 750 mg ampicillin (Polyflex®; Boehringer Ingelheim VetMedica, Inc., St. Joseph, MO), then anesthetized and intubated with 0.5–2% isoflurane with oxygen. A set of fetal femoral arterial and venous vascular catheter was surgically placed in the fetal hindlimbs. An amniotic fluid catheter was sutured onto the fetal hindlimb after the vascular catheterization. Before the uterus was sutured closed, 500 mg ampicillin was injected into the amniotic fluid. After catheterization of the fetus(es), catheters were placed into the femoral artery and vein of the ewe, and a nonocclusive catheter was placed in the maternal trachea through the cricoid cartilage as described previously (Chang and Wood 2015). A minimum of 5 days of surgical recovery were allowed before experimentation. Daily postoperative care included monitoring of rectal temperature, administration of antibiotic, and administration of analgesic as needed. All animals, throughout the study, were monitored for anorexia, infection, and other signs of distress.
In vivo experimental procedures
During all experiments, the ewes were conscious and freestanding in their pens with access to food. The 16 fetuses were randomly assigned to one of the four groups (n = 3–5/group): normoxia control, normoxia + ketamine, hypoxia control, and hypoxia + ketamine. In ketamine‐treated groups, ketamine (3 mg/kg) was given intravenously, through the fetal femoral venous catheter, 10 min prior to the hypoxic stimulus (30 min). Hypoxia was induced by infusing nitrogen gas for 30 min directly into the maternal tracheostomy tube as needed to decrease maternal and fetal partial pressures of oxygen (PaO2) by approximately 50%. Blood gas responses to the maternal tracheal nitrogen infusion have been reported elsewhere (Chang and Wood 2015). To closely monitor the changes in blood gas compositions (ABL80 Radiometer, Copenhagen, Denmark), both maternal and fetal arterial blood was drawn anaerobically (1 mL) every 10 min. The ewes and fetuses were humanely sacrificed 24 h after the induction of hypoxia or normoxia. Fetal brain was hemisected, with one half subjected to further dissection, snap frozen, and stored at −80°C until future analysis. The other half of the fetal brain was immersion fixed in 4% buffered paraformaldehyde, then processed for paraffin embedding.
Microarray procedures
Messenger RNA (mRNA) was extracted from fetal frontal cortex using RNeasy Plus Mini Kit (Qiagen, Valencia, CA), with mRNA integrity number (RIN) values between 7.7 and 9.2, were labeled with cyanine 3 CTP with the Quick Amp Labeling Kit (Cat# 5190‐0442; Agilent Technologies, Santa Clara, CA), according to the manufacturer's protocol. The labeled cRNAs ranged from 12.9 to 15.7 pmol Cy3/μg RNA and from 9.4 to 14.4 μg. The cRNA samples were hybridized and processed for one‐channel Sheep Gene Expression Microarray (8 × 15 K slide) – eight arrays with 15,208 oligomers each (Cat# G4813A‐019921; Agilent Technologies) as described earlier (Rabaglino et al. 2012; Wood et al. 2013). The slides were scanned with Microarray Scanner System (G2505‐90021; Agilent) and the measured fluorescence was detected and converted using Agilent Feature Extraction 9.1 software at the Genomics Division of the University of Florida's Interdisciplinary Center for Biotechnology Research. Bioconductor's packages for the R software were employed for raw data import, background correction, data normalization through the quantile method (Smyth and Speed 2003), and statistical analysis of the normalized data. Microarray data have been deposited in the NCBI Gene Expression Omnibus under accession number GSE76110. The functional annotation of gene ontology for significantly up‐ and downregulated genes was analyzed using DAVID Bioinformatics Resources 6.7 (da Huang et al. 2009a, b) and using WEB‐based GEne SeT AnaLysis Toolkit (WebGestalt) (Zhang et al. 2005; Wang et al. 2013). Enrichment analysis was performed using hypergeometric tests, and correction for multiple comparisons was performed according to the method of Benjamini and Hochberg (1995).
Real‐time PCR
The mRNA used for the microarray was also used for qPCR validations. Complementary DNA (cDNA) was synthesized from mRNA using the Applied Biosystems High‐Capacity Reverse Transcription Kit (Foster City, CA) (Cat# 4368814). The primers used were designed based on the known Ovis aries and Bos taurus genomes (Table 1) for SYBR green. As a control (housekeeping gene), ovine β‐actin primers and probe were used as described previously (Wood et al. 2013). The relative mRNA expression was calculated by the difference in threshold cycle (ΔCt) between the triplicate mean Ct for each gene and the triplicate mean Ct for β‐actin mRNA from the same sample.
Table 1.
Primers for real‐time PCR analyses
| Gene | Accession number | Gene name | Forward primer | Reverse primer |
|---|---|---|---|---|
| AKT | FJ943991.1 | V‐Akt murine thymoma viral oncogene homolog 1 | TACGGCGCCGAGATCGT | GTCCCTGTACACCACGTTCTTCT |
| APAF1 | NM_001191507.1 | Apoptotic peptidase activating factor 1 | TTCACTCCAGTGGCCTGTTG | CAAAGCCACCACTGCCAAAT |
| BAD | NM_001035459.2 | BCL2‐associated agonist of cell death | CGATATGGCCGCGAACTC | GCTCTTCGGGCGAGGAA |
| BAX | XM_003585203.3 | BCL2‐associated X protein | TTTCTGACGGCAACTTCAACTG | GGTGCACAGGGCCTTGAG |
| BCL2 | XM_012103831.2 | B‐cell CLL/lymphoma 2 | GGAGCTGTATGGCCCTAGCA | TGAGCAGTGCCTTCAGAGACA |
| CASP3 | XM_015104559.1 | Caspase 3, apoptosis‐related cysteine peptidase | CCATGGTGAAGAAGGAATCATTT | CCCCTCTGAAGAAACTTGCTAATT |
| CASP8 | XM_012142477.2 | Caspase 8, apoptosis‐related cysteine peptidase | TGGCTGCCCTCAAGTTCCT | GGAATAGCATCAAGGCATCCTT |
| CASP9 | XM_015099302.1 | Caspase 9, apoptosis‐related cysteine peptidase | CAGGTTGCCTCGCTTTGG | CTCGATCATGTCGGGAGTGA |
| CD14 | NM_001077209.1 | CD14 molecule | CCTAAAGGACTGCCGACCAA | GCGGCTCCCTGCTTAGCT |
| CXCL10 | NM_001285721.1 | Chemokine (C‐X‐C motif) ligand 10 | TTGAACTGATTCCTGCAAGTCA | TTCCTTTTCATTGTGGCAATAATCT |
| CXCL16 | XM_015098600.1 | Chemokine (C‐X‐C Motif) ligand 16 | CACTCCTCTGGAAGGAGCAC | GCTTCTGGTTCTCCCTAGCC |
| IKBKB | XM_015104530.1 | Inhibitor of kappa light polypeptide gene enhancer in B‐cells, kinase beta | GAGACCAGCGGACTGATGGT | CACTCGCACTTTCTTCTCAAAGC |
| IL1B | EF524261.1 | Interleukin 1, beta | CGTGGCCATGGAGAAGCT | GGTCATCATCACGGAAGACATGT |
| MAP3K14 | XM_012149642.2 | Mitogen‐activated protein kinase kinase kinase 14 | TCACCCCTTCCCATTCCA | TGCTGGTCGTCTACACAGTTTGT |
| MYD88 | NM_001166183.1 | Myeloid differentiation primary response 88 | GCCTGAGTATTTTGATGCCTTCA | GCTGCCGGATCATCTCATG |
| NF‐κB1 | XM_004020143.3 | Nuclear factor of kappa light polypeptide gene enhancer in B‐cells 1 | TCCCACAGATGTTCACAAACAGT | GACGCTCAATCTTCATCTTGTGAT |
| NF‐κBIA | NM_001166184.1 | Nuclear factor of kappa light polypeptide gene enhancer in B‐cells inhibitor, alpha | CTACACCTTGCCTGTGAGCA | AGACACGTGTGGCCATTGTA |
| OAS1 | XM_012097881.2 | 2′‐5′‐Oligoadenylate synthetase 1, 40/46 kDa | GAGGAAAGAGGGCGAGTTCT | GGATGAGGCTCTTCAGCTTG |
| PKA | NM_001009234.1 | Protein kinase, CAMP‐dependent, catalytic, alpha | CCCACGCGCGCTTCTA | TGAGATCAAGCGAGTGCAGGTA |
| TLR2 | XM_012097285.2 | Toll‐like receptor 2 | GATTCTGCTGGAGCCCATTG | TCATGATCTTCCGCAGCTTACA |
| TLR4 | GU461886.1 | Toll‐like receptor 4 | ACTCGCTCCGGATCCTAGACT | CCTTGGCAAATTCCGTAGTTCT |
| TNF | EF446377.1 | Tumor necrosis factor | CCCTTCCACCCCCTTGTT | ATGTTGACCTTGGTCTGGTAGGA |
Immunohistochemistry
Fetal brain samples were fixed in 4% buffered paraformaldehyde overnight, and kept in 70% reagent alcohol until embedded with paraffin. Tissue sections (5 μm) were immunostained for ionized calcium‐binding adaptor protein (Iba‐1) antibody (Cat# 019‐19741, Waco Pure Chemical Industries, Richmond, VA; 1:200 dilution), and peroxidase–PAP sandwich technique (Vectastain, Vector Labs, Burlingame, CA). Sections were counterstained with methyl green. Macrophages were quantified in an average area of 181,848 μm2 determined in seven images at 40×. Images were randomly made with common areas of the cerebral cortex of all subjects and sections. The total area was calculated using the default color thresholding mechanism of Image J (version 1.48, NIH, Bethesda, MD), where the main parameters (hue, saturation, and brightness) remained constant.
Calculations and statistical analysis
Data are presented as mean values ± standard error of the mean with consideration for statistical significance at P < 0.05. The ovine Agilent 15.5 K array results were analyzed with Bioconductor's Limma package for R software v.2.15.1 (Smyth 2006), employing moderated t test using empirical Bayes method for small sample size per group (P < 0.05). Pairwise comparisons of real‐time PCR data were analyzed using Student's t test, with P < 0.05 considered statistically significant.
For the histological analysis, the experiment involved a 2 × 2 factorial completely randomized design with stimulus (hypoxia, normoxia) and treatment (control, ketamine) as factors. A generalized linear model with Poisson distribution for log count data observations was used. Significance was declared at P < 0.05, and if detected, post hoc mean comparison with Bonferroni correction was performed. Least square means and their corresponding standard errors are expressed in the original scale. Statistical analysis was conducted using the Genmod Procedure of SAS/STAT® 9.3 (SAS Institute Inc., Cary, NC).
Results
Responses to hypoxia and/or ketamine
Addition of nitrogen to the maternal inspired gas reduced fetal PaO2 to approximately 10 mmHg, and the change in fetal blood gas was not affected by pretreatment with ketamine (Table 2). Cardiovascular and neuroendocrine responses to this stimulus in a larger cohort of fetuses have been reported elsewhere (Chang and Wood 2015). Hypoxia stimulated the upregulation of 248 genes and the downregulation of 480 genes compared to normoxia (Fig. 1). The significantly regulated genes, either up‐ or downregulated, were for analysis of gene ontology, KEGG pathways, common pathways, and associated diseases. Twenty‐four hours after the onset of a 30‐min acute hypoxic stimulus, the biological processes that were upregulated in the fetal frontal cortex were mainly associated with the regulation of immune system response, defense response, response to stress, and response to biotic stimulus (Table 3). The biological processes that were downregulated after the hypoxic insult mainly involved protein metabolic processes, and negative regulation of MAP, ERK1, and ERK2 cascade (Table 3). The enriched KEGG pathway analysis revealed that hypoxia activates the toll‐like receptor and chemokine signaling pathways, cytokine–cytokine receptor interaction, and osteoclast differentiation, and mainly downregulates metabolic pathways (Table 4).
Table 2.
Fetal blood gas and pH values before (0 min) and at the end (30 min) of maternal ventilatory hypoxia
| 0 min | 30 min | |
|---|---|---|
| PaO2 (mmHg) | ||
| Nmx | 17 ± 1 | 17 ± 1 |
| Nmx + Ket | 17 ± 1 | 17 ± 1 |
| Hypx | 17 ± 1 | 10 ± 1 |
| Hypx + Ket | 17 ± 1 | 10 ± 1 |
| PaCO2 (mmHg) | ||
| Nmx | 55 ± 2 | 56 ± 2 |
| Nmx + Ket | 54 ± 2 | 56 ± 2 |
| Hypx | 57 ± 2 | 53 ± 1 |
| Hypx + Ket | 55 ± 2 | 52 ± 2 |
| pHa | ||
| Nmx | 7.38 ± .01 | 7.37 ± .02 |
| Nmx + Ket | 7.37 ± .01 | 7.37 ± .02 |
| Hypx | 7.35 ± .01 | 7.33 ± .02 |
| Hypx + Ket | 7.35 ± .01 | 7.34 ± .02 |
Figure 1.
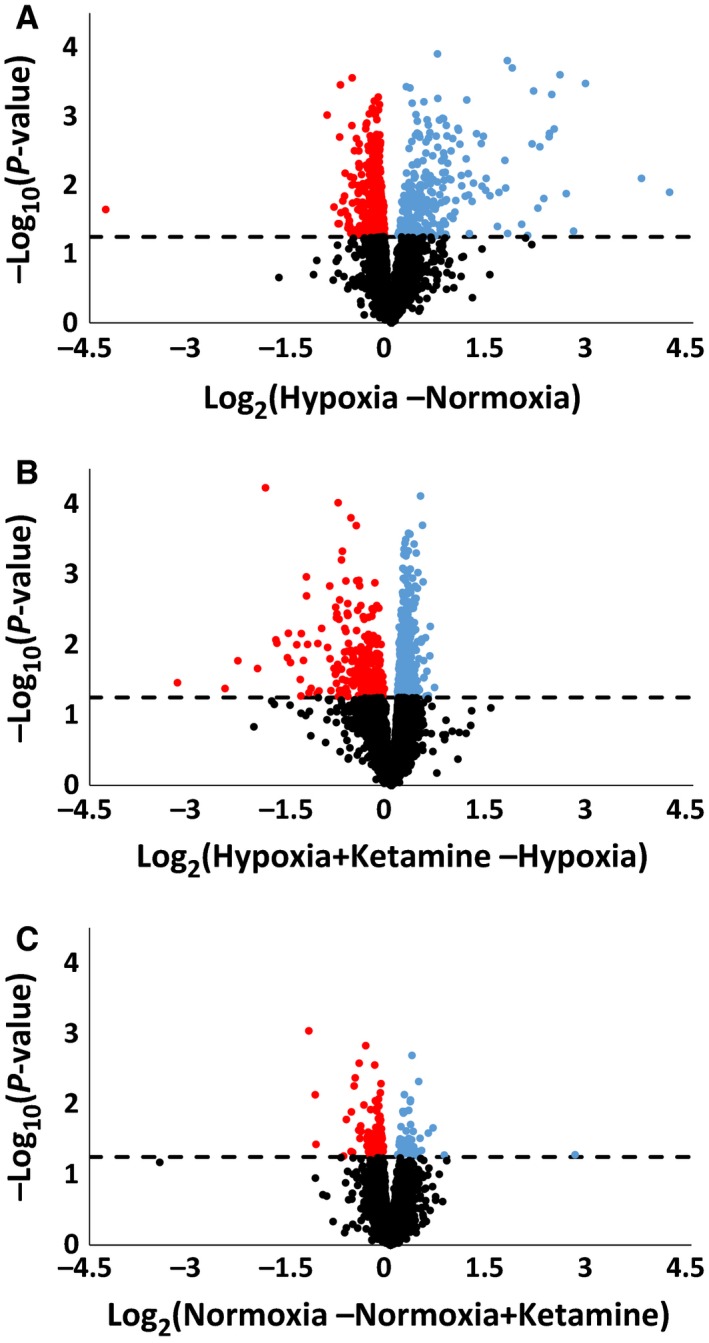
Volcano plot illustrating the relationship of gene expression in fetal frontal cortex measured by log2 of fold change. Significantly upregulated (blue) and downregulated (red) genes under hypoxia (A), hypoxia + ketamine (B), and normoxia + ketamine (C). The dotted line indicates whether the gene is statistically significant (above), P < 0.05, or not significant (below). Nonsignificant genes are indicated in black dots.
Table 3.
Top 10 gene ontology biological processes that were significantly regulated in the frontal cortex
| Groups | Biological processes | # Genes involved | Adjusted P values |
|---|---|---|---|
| Hypoxia (upregulated compared to normoxia) | Immune response | 75 | 1.06E‐27 |
| Defense response | 75 | 4.70E‐27 | |
| Immune system process | 94 | 5.61E‐27 | |
| Response to stress | 115 | 2.48E‐23 | |
| Innate immune response | 50 | 4.83E‐23 | |
| Regulation of immune system process | 60 | 1.20E‐21 | |
| Regulation of immune response | 46 | 4.49E‐19 | |
| Positive regulation of immune system process | 44 | 1.46E‐17 | |
| Regulation of defense response | 39 | 1.79E‐17 | |
| Response to biotic stimulus | 46 | 1.79E‐17 | |
| Hypoxia (downregulated compared to normoxia) | Cellular protein metabolic process | 127 | 4.00E‐04 |
| Protein metabolic process | 140 | 2.80E‐03 | |
| Negative regulation of MAP cascade | 11 | 2.80E‐03 | |
| Negative regulation of ERK1 and ERK2 cascade | 6 | 4.30E‐03 | |
| Negative regulation of intracellular protein kinase cascade | 13 | 8.00E‐03 | |
| Water‐soluble vitamin metabolic process | 9 | 1.09E‐02 | |
| Negative regulation of MAP kinase activity | 9 | 1.09E‐02 | |
| Inactivation of MAPK activity | 6 | 1.09E‐02 | |
| Negative regulation of metabolic process | 61 | 1.27E‐02 | |
| Negative regulation of macromolecule metabolic process | 58 | 1.27E‐02 | |
| Hypoxia + ketamine (upregulated compared to hypoxia without ketamine) | Organelle organization | 97 | 8.50E‐03 |
| Cellular protein metabolic process | 137 | 8.50E‐03 | |
| Response to starvation | 12 | 4.29E‐02 | |
| Cellular metabolic process | 297 | 4.29E‐02 | |
| Protein modification by small protein conjugation or removal | 37 | 4.29E‐02 | |
| Cellular response to starvation | 10 | 5.36E‐02 | |
| Macromolecule modification | 106 | 5.36E‐02 | |
| Protein ubiquitination | 32 | 5.36E‐02 | |
| Cellular protein modification process | 101 | 8.24E‐02 | |
| Protein modification by small protein conjugation or removal | 32 | 8.24E‐02 | |
| Hypoxia + ketamine (downregulated compared to hypoxia without ketamine) | Defense response | 63 | 7.93E‐17 |
| Response to stress | 104 | 3.34E‐15 | |
| Regulation of immune response | 42 | 6.46E‐15 | |
| Immune response | 58 | 9.22E‐15 | |
| Regulation of immune system process | 51 | 3.06E‐14 | |
| Response to wounding | 58 | 3.06E‐14 | |
| Regulation of defense response | 35 | 1.67E‐13 | |
| Immune system process | 74 | 1.70E‐13 | |
| Innate immune response | 39 | 1.70E‐13 | |
| Regulation of response to stress | 45 | 3.20E‐13 |
Table 4.
Top 10 enriched KEGG pathways that were significantly regulated in the frontal cortex
| Groups | Pathway names | # Genes involved | Adjusted P values |
|---|---|---|---|
| Hypoxia (upregulated compared to normoxia) | Chagas disease (American trypanosomiasis) | 13 | 2.53E‐12 |
| Complement and coagulation cascades | 11 | 7.75E‐12 | |
| Osteoclast differentiation | 13 | 1.29E‐11 | |
| Toll‐like receptor signaling pathway | 12 | 1.31E‐11 | |
| Cytokine–cytokine receptor interaction | 16 | 4.97E‐11 | |
| Staphylococcus aureus infection | 9 | 3.29E‐10 | |
| Pathways in cancer | 16 | 7.88E‐10 | |
| Chemokine signaling pathway | 12 | 9.61E‐09 | |
| Malaria | 7 | 1.38E‐07 | |
| Hematopoietic cell lineage | 8 | 3.13E‐07 | |
| Hypoxia (downregulated compared to normoxia) | Vitamin digestion and absorption | 5 | 3.00E‐04 |
| Metabolic pathways | 28 | 1.30E‐03 | |
| Pathways in cancer | 13 | 1.30E‐03 | |
| TGF‐beta signaling pathway | 6 | 4.50E‐03 | |
| Vibrio cholerae infection | 5 | 4.50E‐03 | |
| Wnt signaling pathway | 7 | 1.38E‐02 | |
| Oocyte meiosis | 6 | 1.39E‐02 | |
| Amino sugar and nucleotide sugar metabolism | 4 | 1.59E‐02 | |
| Cell cycle | 6 | 1.75E‐02 | |
| Collecting duct acid secretion | 3 | 2.10E‐02 | |
| Hypoxia + ketamine (upregulated compared to hypoxia without ketamine) | Metabolic pathways | 46 | 4.97E‐10 |
| mRNA surveillance pathway | 9 | 6.34E‐05 | |
| mTOR signaling pathway | 7 | 2.00E‐04 | |
| Tight junction | 9 | 9.00E‐04 | |
| Glycine, serine, and threonine metabolism | 5 | 9.00E‐04 | |
| Spliceosome | 9 | 9.00E‐04 | |
| Insulin signaling pathway | 9 | 1.20E‐03 | |
| TGF‐beta signaling pathway | 7 | 1.40E‐03 | |
| Huntington's disease | 10 | 1.40E‐03 | |
| Vitamin digestion and absorption | 4 | 1.90E‐03 | |
| Hypoxia + ketamine (downregulated compared to hypoxia without ketamine) | Complement and coagulation cascades | 12 | 4.74E‐13 |
| Chagas disease (American trypanosomiasis) | 13 | 1.50E‐12 | |
| Staphylococcus aureus infection | 10 | 1.88E‐11 | |
| Malaria | 9 | 2.17E‐10 | |
| Osteoclast differentiation | 12 | 2.17E‐10 | |
| Pathways in cancer | 15 | 1.07E‐08 | |
| Leishmaniasis | 8 | 8.78E‐08 | |
| Toll‐like receptor signaling pathway | 9 | 8.78E‐08 | |
| Chemokine signaling pathway | 11 | 1.24E‐07 | |
| Amebiasis | 8 | 1.50E‐06 |
Ketamine had a small effect on its own. In the fetuses that were treated with ketamine under normoxic conditions (Fig. 1C), only 50 genes were significantly upregulated compared to normoxia control, and these did not provide any significant biological processes or pathways. However, there were 105 genes that were downregulated by ketamine and the significant biological processes included cellular potassium ion transmembrane transport (three genes, adjusted P = 3.78E‐2), mitotic prometaphase (five genes, adjusted P = 3.53E‐2), viral reproduction (14 genes, adjusted P = 2.15E‐2), and interspecies interaction between organisms (10 genes, adjusted P = 3.53E‐2).
Ketamine significantly upregulated 570 genes and downregulated 250 genes during hypoxia (compared to hypoxia without ketamine pretreatment) (Fig. 1B). Biological process terms significantly associated with the upregulated genes were biological process terms organelle organization, cellular protein metabolic process, and macromolecule modification (Table 3). Significantly associated biological process terms with downregulated genes were defense response, response to stress, and regulation of immune response (Table 3). KEGG analysis revealed that ketamine treatment before hypoxia upregulated metabolic pathways and downregulated toll‐like receptor and chemokine signaling pathways (Table 4).
Modulation of responses to hypoxia by ketamine
To determine the modulatory effect of ketamine pretreatment on hypoxia, the genes that were significantly upregulated by hypoxia (vs. normoxia) were compared with the genes that were significantly downregulated by hypoxia + ketamine (vs. hypoxia alone) (Fig. 2A). There were 126 genes that were uniquely upregulated by hypoxia, 128 genes that were downregulated by hypoxia + ketamine, and 122 common genes between the both groups. Gene ontology analysis revealed that these common genes were significantly associated with biological process terms related to the regulation of immune, defense, and stress response (Table 5). The enriched KEGG pathway analysis indicated the involvement of toll‐like receptor signaling, chemokine signaling, and cytokine–cytokine receptor interaction. The major common pathways associated with these 122 common genes were immune, inflammatory, apoptosis, metabolic, and cellular division (Table 6). The analysis of enriched disease‐associated genes yielded statistically significant association with the following terms: inflammation, necrosis, immune system, and autoimmune diseases (Table 7).
Figure 2.
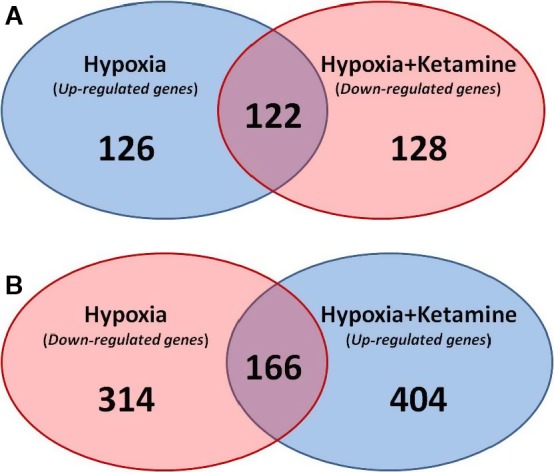
Venn diagram of the number of genes that were significantly regulated by hypoxia and hypoxia + ketamine. (A) Venn diagram showing the number of significant genes that were upregulated by hypoxia (blue), downregulated with ketamine (red), and the common genes involved in both groups (purple). (B) Venn diagram of significant genes that was downregulated by hypoxia (red), upregulated with ketamine (blue), and the common genes involved in both groups (purple).
Table 5.
Top 10 gene ontology biological processes and enriched KEGG pathways that were significantly upregulated in the frontal cortex during acute hypoxic stress and downregulated by ketamine treatment before hypoxia
| Analysis | Pathways, processes, functions, components | # Genes involved | Adjusted P values |
|---|---|---|---|
| Biological process | Immune response | 42 | 7.39E‐17 |
| Immune system process | 53 | 7.39E‐17 | |
| Defense response | 43 | 7.39E‐17 | |
| Regulation of immune system process | 38 | 1.12E‐16 | |
| Regulation of immune response | 30 | 4.30E‐15 | |
| Response to wounding | 40 | 6.90E‐15 | |
| Positive regulation of immune system process | 29 | 2.09E‐14 | |
| Response to stress | 63 | 2.09E‐14 | |
| Innate immune response | 28 | 9.60E‐14 | |
| Response to lipid | 28 | 6.08E‐13 | |
| Molecular function | Protein binding | 80 | 5.78E‐07 |
| Cytokine receptor binding | 10 | 2.00E‐04 | |
| Interleukin‐6 receptor activity | 2 | 1.30E‐03 | |
| Receptor binding | 22 | 1.30E‐03 | |
| Chemokine receptor binding | 5 | 1.30E‐03 | |
| Interleukin‐6 binding | 2 | 1.30E‐03 | |
| Cell surface binding | 5 | 1.30E‐03 | |
| Enzyme inhibitor activity | 10 | 1.50E‐03 | |
| Lipoteichoic acid binding | 2 | 1.70E‐03 | |
| Peptidase regulator activity | 8 | 1.70E‐03 | |
| KEGG pathways | Chagas disease (American trypanosomiasis) | 11 | 2.78E‐13 |
| Complement and coagulation cascades | 10 | 2.78E‐13 | |
| Staphylococcus aureus infection | 9 | 8.98E‐13 | |
| Pathways in cancer | 12 | 2.32E‐09 | |
| Toll‐like receptor signaling pathway | 8 | 6.40E‐09 | |
| Osteoclast differentiation | 8 | 3.27E‐08 | |
| Cytokine–cytokine receptor interaction | 10 | 3.79E‐08 | |
| Malaria | 6 | 5.32E‐08 | |
| Chemokine signaling pathway | 8 | 4.61E‐07 | |
| Systemic lupus erythematosus | 7 | 7.49E‐07 |
Table 6.
Top 10 common pathways associated with the genes that were significantly upregulated in the frontal cortex in response to hypoxia and downregulated by ketamine treatment before hypoxia
| Common pathways | # Genes involved | Adjusted P values |
|---|---|---|
| Immune system | 27 | 6.57E‐24 |
| Innate immune system | 17 | 6.54E‐19 |
| Integrin family cell surface interactions | 32 | 7.15E‐19 |
| TRAIL signaling pathway | 31 | 2.09E‐18 |
| Glypican 1 network | 30 | 1.01E‐17 |
| Signaling events mediated by hepatocyte growth factor receptor (c‐Met) | 29 | 1.59E‐17 |
| Insulin pathway | 29 | 1.59E‐17 |
| S1P1 pathway | 29 | 1.59E‐17 |
| Arf6 downstream pathway | 29 | 1.59E‐17 |
| Arf6 signaling events | 29 | 1.59E‐17 |
Table 7.
Top 10 enriched diseases associated with the genes that were significantly upregulated in the frontal cortex during acute hypoxic stress, but was downregulated with ketamine
| Diseases | # Genes involved | Adjusted P values |
|---|---|---|
| Inflammation | 26 | 2.00E‐24 |
| Necrosis | 21 | 2.44E‐20 |
| Immune system diseases | 26 | 5.81E‐20 |
| Autoimmune diseases | 20 | 4.53E‐17 |
| Chorioamnionitis | 15 | 1.23E‐16 |
| Infection | 20 | 2.16E‐15 |
| Preterm rupture of membranes | 13 | 7.23E‐14 |
| Bronchiolitis | 14 | 1.21E‐13 |
| Virus diseases | 18 | 1.50E‐13 |
| Bacterial infections | 13 | 1.64E‐13 |
Comparison of the 166 common genes between the downregulated hypoxia versus the upregulated hypoxia + ketamine (Fig. 2B) revealed only one significant gene ontology biological process: cellular protein metabolic process (50 genes, adjusted P = 3.34E‐2). The KEGG analysis pathway yielded a few significant pathways, with metabolic pathways as the main outcome (nine genes of the 166 common genes). The rest of the pathways involved very few genes, which varied between 1 and 3% (2–5 genes of the 166 common genes).
Inflammation and immune responses
The transcriptomics analysis predicts that hypoxia increases inflammation, and that ketamine ameliorates this response. To explore this possibility, we performed qPCR on genes within the inflammation pathway (not all of these genes were represented by the microarray probes). Hypoxia stimulated increases in many genes within the TLR‐mediated inflammatory cascade: TLR2, CD14, MYD88, NF‐κB1, TNFα, CXCL110, CXCL16, and OAS1 (Fig. 3). Ketamine prior to hypoxia altered the expression of TLR2, CD14, MYD88, CASP8, IKBA, TNFα, OAS1, and CXCL16 compared to hypoxia alone. Shown in Figure 4 is a modified flow chart of the TLR2‐ and TLR4‐dependent inflammatory cascade, illustrating that the inflammatory response to hypoxia and the modification of the response by ketamine appears to involve the entire cascade. Interestingly, hypoxia appeared to reduce the expression of genes involved in apoptosis, and ketamine appeared to have no modulatory effect on these genes (Fig. 5).
Figure 3.
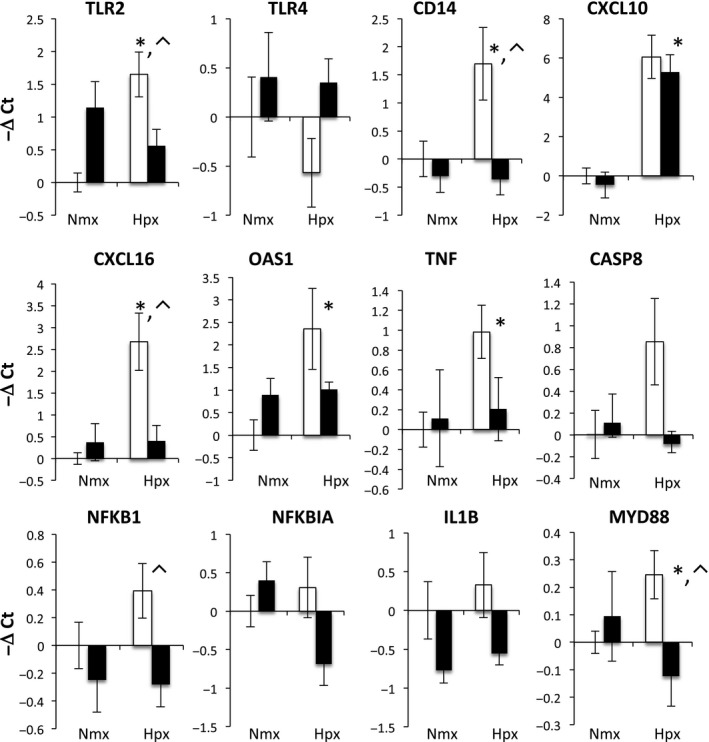
Gene expression (mRNA abundance) was measured by real‐time qPCR for genes in the toll‐like receptor inflammation pathway. Values are represented as delta cycle threshold (ΔCt) compared to the normoxia control (no hypoxia and no ketamine) group. Open bars represent experiments in which ketamine was not administered. Filled bars represent experiments in which ketamine was administered before normoxia or hypoxia. The criterion for statistical significance was P < 0.05 (Student's t test). Data are presented as means ± SEM, and the y‐axis scale varies between plots. *Statistically significant difference in hypoxia + ketamine group compared to normoxia control. ⌃Statistically significant difference in hypoxia control group compared to hypoxia + ketamine group.
Figure 4.
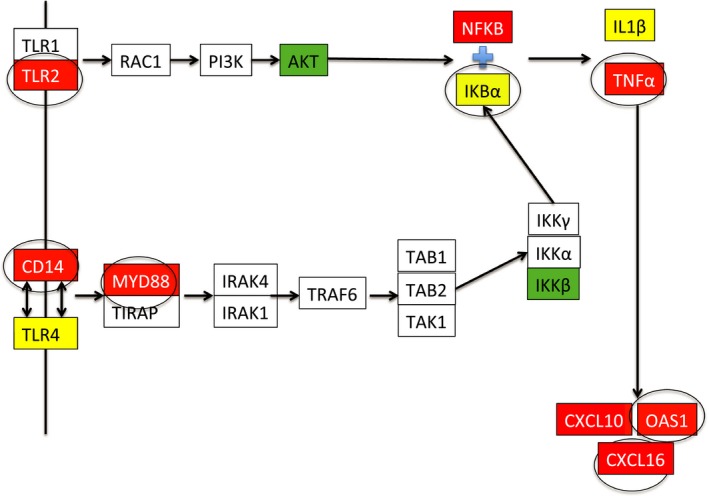
Graphical representation of the toll‐like receptor inflammation pathways queried by qPCR in the present studies. Boxes that are uncolored were not tested by qPCR. Red color denotes genes whose expression was increased by hypoxia. Green color denotes genes whose expression as decreased by hypoxia. Yellow color denotes genes whose expression was not changed by hypoxia. Circled boxes represent genes whose response to hypoxia was significantly altered by ketamine.
Figure 5.
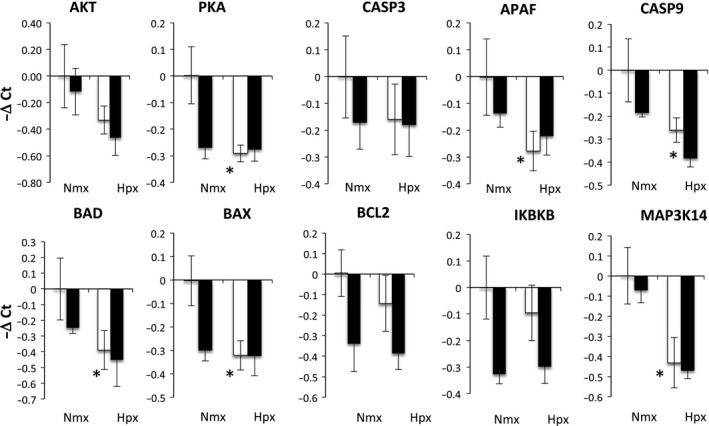
Gene expression (mRNA abundance) was measured by real‐time qPCR for genes related to apoptosis. Values are represented as delta cycle threshold (ΔCt) compared to the normoxia control (no hypoxia and no ketamine) group. Open bars represent experiments in which ketamine was not administered. Filled bars represent experiments in which ketamine was administered before normoxia or hypoxia. The criterion for statistical significance was P < 0.05 (Student's t test). Data are presented as means ± SEM, and the y‐axis scale varies between plots. *Statistically significant difference of hypoxia + ketamine group compared to normoxia control.
Together, the transcriptomics and qPCR suggest that there is an immune response within the fetal cerebral cortex that is reduced by ketamine. To validate this conclusion, we performed immunohistochemistry on cerebral cortex, staining for Iba‐1 (a macrophage/microglia marker to test for accumulation of macrophages or microglia). The density of Iba‐1‐positive cells was significantly increased after hypoxia; this response was attenuated by ketamine (Fig. 6). Ketamine alone did not have a statistically significant effect on the number of Iba‐1‐positive cells (Fig. 6). The abundance of Iba‐1‐positive cells in the cerebral cortex mirrored the transcriptomics response within the inflammatory cascade (hypoxia increases the number of positive cells and ketamine reduces the response).
Figure 6.
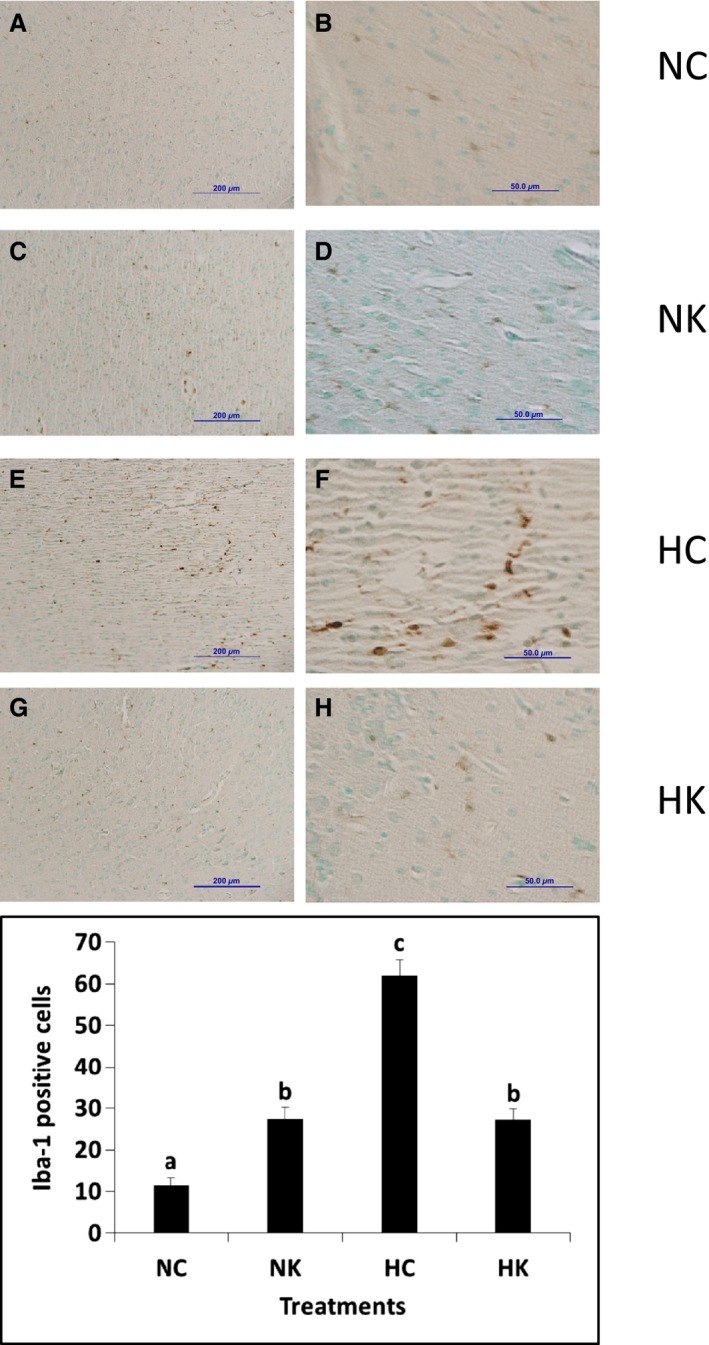
Immunohistochemical analysis of cells expressing Iba‐1 immunoreactivity in the frontal cerebral cortex. Representative images at low (A, C, E, G) and high (B, D, F, H) magnification from animals exposed to normoxia with no ketamine pretreatment (A, B), animals exposed to normoxia following ketamine pretreatment (C, D), animals exposed to hypoxia with no ketamine pretreatment (E, F), and animals exposed to hypoxia following ketamine pretreatment (G, H) fetuses. Sections were counterstained with methyl green. Macrophage counts per field at 40× in the cerebral cortex (graph) from seven images per animal and three to four animals per group. Data are expressed as means ± SEM. Different letters indicate statistically significant difference (P < 0.05). Scale bars 200 μm (A, C, E, G), 50 μm (B, D, F, H). NC, normoxia control; NK, normoxia + ketamine; HC, hypoxia control; HK, hypoxia + ketamine.
Discussion
The present study represents a marriage of two technologies: whole animal physiology and transcriptomics‐based systems biological modeling and analysis of the physiology. We have been successful, for example, in modeling and validating changes in cardiac physiology in the fetus exposed to chronic elevations in maternal cortisol (Richards et al. 2014). In the present study, systems modeling of transcriptomics in the frontal cerebral cortex 24 h after hypoxia indicate that there are increased inflammation and immune responses as well as the anticipated decreased cellular and protein metabolic processes. The immune response predicted by the model was validated using histological evidence of increased macrophage/microglia number in the fetal cerebral cortex. Administration of a standard clinical dose of ketamine (based on estimated fetal body weight) prior to hypoxia modified and, in some aspects, prevented or greatly reduced these responses, suggesting that ketamine may be useful for its anti‐inflammatory action in the fetal brain. The present study, because it focuses on pathways activated by hypoxia and inhibited by ketamine, is limited to understanding tissue responses and not long‐term outcome. While the pathway analysis reveals heretofore unknown responses to what would be considered a relatively common fetal stressor, it does not specifically address demyelination, cell death, or either short‐ or long‐term deficits in cortical function.
We designed the present study to test the hypothesis that ketamine, a noncompetitive NMDA receptor antagonist, attenuates the inflammation that results from hypoxia. In order to identify the effect of ketamine on the hypoxic fetal frontal cortex, we examined the common genes that were both significantly upregulated by hypoxia and significantly downregulated by ketamine pretreatment before the hypoxia (Fig. 2). The results indicated that inflammation pathways were significantly upregulated by hypoxia, and that cellular and protein metabolic processes were downregulated. The effects of ketamine opposed those of hypoxia are upregulation of metabolic processes and downregulation of inflammatory pathways (Tables 3 and 4).
Neonatal and perinatal brain inflammation is characterized by increased cytokines, including IL1, IL6, and TNFα (Szaflarski et al. 1995; Hagberg et al. 1996; Cieslak et al. 2013). These proinflammatory cytokines, along with the transcription factor NF‐κB, one of the main regulators of the inflammatory response, have been reported to have a direct cytotoxic effect on neurons and glial cells (Volpe 2001). Inflammatory mediators promote the recruitment, activation, and infiltration of immune cells in the brain, and contribute to the severity of the hypoxic injury (Castillo‐Melendez et al. 2013; Jellema et al. 2013). Our transcriptomics model and the immunohistochemical validation of the model suggest that the response to hypoxia involves alterations in the abundance of macrophages or microglia within the cerebral cortex. Unknown is the nature of the stimulus to the increase in macrophage/microglia abundance. It could be directly related to the cellular hypoxia and energy starvation, or possibly a secondary response (e.g., secondary to changes in neurotransmission in chemoreceptor‐sensitive pathways in the fetal brain). We have previously reported that, 1 h after hypoxia, transcriptomics modeling indicated a reduction in cellular metabolism and the beginning of an inflammatory/immune response in the fetal hypothalamus (Wood et al. 2014). We do not know whether 30 min of moderate hypoxia (reduction in fetal PaO2 of approximately 50%) actually damages the neurons and glia in the fetal brain. Physiologically, the fetal brain reduces oxygen demand in parallel with the reduction in oxygen delivery (Jones et al. 1983; Rurak et al. 1990), likely affording some protection from damage. Nevertheless, it is possible that reoxygenation is a direct insult to the brain, increasing the formation of oxygen radicals and other proinflammatory stimuli (Maulik et al. 1999). However, it is also possible that there are other events that stimulate inflammation in the fetal brain and other tissues (i.e., release of proinflammatory substances from the placenta or other tissues). We find it interesting and intriguing that the increase in macrophages/microglia in the fetal cerebral cortex appears to be very similar to an increase in macrophages in the renal cortex of the fetus, recently reported elsewhere (Chang et al. 2016).
We were surprised to see the magnitude of the increase in abundance of macrophages or microglia in the fetal cerebral cortex after hypoxia, but we were not surprised to find an active involvement of the fetal immune system in the response. In other experiments, we have evidence of immune development within the fetal brain in the latter half of gestation (Rabaglino et al. 2014). Interestingly, the consensus trend in gene expression in the latter half of gestation in the fetal sheep reflects pathways involved in hematopoietic immune cell development (Rabaglino et al. 2014). We do not know whether the Iba‐1‐positive cells observed in the present experiments were microglia that were already present in the fetal brain or whether they were macrophages that entered into the fetal cerebral cortex from the blood. We suspect the latter because we have observed what appear to be Iba‐1‐positive cells migrating between blood and brain parenchyma (Fig. 6).
In addition to testing inflammation pathways by qPCR, we tested gene expression in pathways related to apoptosis. Calcium influx into the neurons promotes neuronal apoptosis mainly via the caspase signaling pathway (Vannucci and Hagberg 2004). Several studies have reported that hypoxic stimuli elevate concentrations of the apoptotic factors caspase 3, 7, 8, and 9 (Northington et al. 2001; Zhu et al. 2003; Vannucci and Hagberg 2004), and other adaptor proteins such as BAX/BCL2 (Cheng et al. 2003), MYD88 (Wang et al. 2009), and NF‐κB (Liu et al. 2005). While we expected there to be an increase in expression of genes mediating apoptosis 24 h after hypoxia, we found that many of these genes were downregulated (AKT, CASP3, CASP9, BAD, BAX, BCL2) and not further altered by ketamine (Fig. 5). Exceptions to this trend were MYD88 and CASP8, which were upregulated by hypoxia and blunted by ketamine (Fig. 3). Based on these results, we conclude that hypoxia results in alterations in apoptosis as well as inflammation, but that the effects on apoptosis appear to be favoring reduction of apoptosis, possibly because apoptosis is an energy requiring process. Apoptosis is an integral aspect of brain development (synaptogenesis and neuronal pruning) in the fetus, and it is not clear whether a transient alteration in the rate of apoptosis could permanently alter the course of cortical development.
Ketamine is known to bind an array of receptors besides NMDA receptors including dopamine receptors (Kapur and Seeman 2002), non‐NMDA glutamate receptors, opioid receptors, nicotinic and muscarinic cholinergic receptors (Kohrs and Durieux 1998), serotonin receptors (Yamakura et al. 2000; Kapur and Seeman 2002), and weakly influencing the glycine and GABAA receptors (Yamakura et al. 2000). Nevertheless, we do not know whether the anti‐inflammatory action of ketamine in this study is related to a neuropharmacologic action of the drug. Other studies have also supported the role of ketamine as an anti‐inflammatory agent when used in both clinically (Yli‐Hankala et al. 1992; Beilin et al. 2007; Welters et al. 2011) and experimentally (Koga et al. 1994; Takenaka et al. 1994; Kawasaki et al. 1999). Investigators have reported that ketamine reduces the levels of TNFα, IL1β, IL6, and IL8, which are the main innate immune system modulators (Larsen et al. 1998; Kawasaki et al. 1999, 2001; Shaked et al. 2004; Lankveld et al. 2005; Gurfinkel et al. 2006). For example, it is possible that in the present experiments ketamine has a direct effect on macrophages to reduce the secretion of cytokines and other inflammatory mediators. Tan et al. (2015) have reported that ketamine has a direct effect on macrophages to reduce NF‐κB‐mediated responses to lipopolysaccharide. Indeed, such an action of ketamine would be consistent with our results.
In summary, we have used a combined approach of whole animal physiology and transcriptomics‐based systems biology modeling to explore the response of the fetal cerebral cortex to transient hypoxia in the late gestation fetal sheep. Our results are in agreement with previous results from other laboratories that indicate an inflammation response, but we have provided evidence of anti‐inflammatory actions of clinically relevant doses of ketamine, and we suggest that ketamine might be useful for reducing (fetal or neonatal) cortical damage after transient hypoxia or ischemia. The results indicate an inflammation response that involves the entire toll‐like receptor inflammation pathway with influx of microglia or macrophages into the cerebral cortex. We conclude that the inflammation response in the cerebral cortex is similar to that in the kidney cortex, suggesting that the ultimate stimulus to the inflammation might be secondary to signaling that originates in other fetal or placental tissues.
Perspectives
Thirty minutes of maternal ventilatory hypoxia of a magnitude expected upon acute exposure to 12,000 feet altitude (Rahn and Otis 1949) results in fetal brain inflammation and accumulation of microglia or macrophages in the fetal cerebral cortex. The vigorous nature of this response is surprising to us, and it is reminiscent of inflammation in the fetal renal cortex after the same hypoxic stimulus (Chang et al. 2016). Will milder hypoxia (either in magnitude or duration) have a similar effect? Perhaps more important than the questions of cause or sensitivity is the question of whether this inflammatory response demarks tissue damage or whether it plays a positive role in fetal brain development. Transient hypoxia can be caused, for example, by air travel in pressurized aircraft (Hampson et al. 2013), by visits to high altitude (Rahn and Otis 1949), or even perhaps by sleep apnea in late gestation (Venkata and Venkateshiah 2009). How common are bouts of fetal brain inflammation in the normal fetus? Are these somehow causally related to hematopoietic immune cell development in the fetal brain (Rabaglino et al. 2014)? Does transient hypoxia have negative or even positive long‐term consequences?
Conflict of Interest
None declared.
Acknowledgments
The authors thank Ms. Xiaoying (Lisa) Fang, Ms. Kristina Steinfeldt, and Ms. Heidi Straub for their expert technical assistance. The authors also thank the Genomics Division of the University of Florida's Interdisciplinary Center for Biotech Research for the use of the Agilent Bioanalyzer and Agilent scanner.
Chang E. I., Zárate M. A., Rabaglino M. B., Richards E. M., Arndt T. J., Keller‐Wood M., Wood C. E.. Ketamine decreases inflammatory and immune pathways after transient hypoxia in late gestation fetal cerebral cortex. Physiol Rep, 4 (6), 2016, e12741, doi: 10.14814/phy2.12741
Funding Information
This research was supported by the National Institutes of Health (NIH) Grant HD33053 (C. E. W.), and by the NIH Training in Endocrine, Metabolic, and Prenatal Basis of Chronic Kidney Disease Predoctoral Fellowship T32DK076541 (E. I. C. and C. E. W.).
References
- Beilin, B. , Rusabrov Y., Shapira Y., Roytblat L., Greemberg L., Yardeni I. Z., et al. 2007. Low‐dose ketamine affects immune responses in humans during the early postoperative period. Br. J. Anaesth. 99:522–527. [DOI] [PubMed] [Google Scholar]
- Benjamini, Y. , and Hochberg Y.. 1995. Controlling the false discovery rate: a practical and powerful approach to multiple testing. J. R. Statist. Soc. 57:289–300. [Google Scholar]
- Castillo‐Melendez, M. , Baburamani A. A., Cabalag C., Yawno T., Witjaksono A., Miller S. L., et al. 2013. Experimental modelling of the consequences of brief late gestation asphyxia on newborn lamb behaviour and brain structure. PLoS ONE 8:e77377. [DOI] [PMC free article] [PubMed] [Google Scholar]
- Chang, E. I. , and Wood C. E.. 2015. Ketamine attenuates the ACTH response to hypoxia in late gestation ovine fetus. Neonatology 107:249–255. [DOI] [PMC free article] [PubMed] [Google Scholar]
- Chang, E. I. , Zarate M. A., Rabaglino M. B., Richards E. M., Keller‐Wood M., and Wood C. E.. 2016. Ketamine suppresses hypoxia‐induced inflammatory responses in the late‐gestation ovine fetal kidney cortex. J. Physiol. 594:1295–1310. [DOI] [PMC free article] [PubMed] [Google Scholar]
- Cheng, T. , Liu D., Griffin J. H., Fernandez J. A., Castellino F., Rosen E. D., et al. 2003. Activated protein C blocks p53‐mediated apoptosis in ischemic human brain endothelium and is neuroprotective. Nat. Med. 9:338–342. [DOI] [PubMed] [Google Scholar]
- Choi, D. W. , and Rothman S. M.. 1990. The role of glutamate neurotoxicity in hypoxic‐ischemic neuronal death. Annu. Rev. Neurosci. 13:171–182. [DOI] [PubMed] [Google Scholar]
- Cieslak, M. , Wojtczak A., and Cieslak M.. 2013. Relationship between the induction of inflammatory processes and infectious diseases in patients with ischemic stroke. Acta Biochim. Pol. 60:345–349. [PubMed] [Google Scholar]
- Cohn, H. E. , Sacks E. J., Heymann M. A., and Rudolph A. M.. 1974. Cardiovascular responses to hypoxemia and acidemia in fetal lambs. Am. J. Obstet. Gynecol. 120:817–824. [DOI] [PubMed] [Google Scholar]
- Gill, R. , Foster A. C., and Woodruff G. N.. 1988. MK‐801 is neuroprotective in gerbils when administered during the post‐ischaemic period. Neuroscience 25:847–855. [DOI] [PubMed] [Google Scholar]
- Guo, R. , Hou W., Dong Y., Yu Z., Stites J., and Weiner C. P.. 2010. Brain injury caused by chronic fetal hypoxemia is mediated by inflammatory cascade activation. Reprod. Sci. 17:540–548. [DOI] [PubMed] [Google Scholar]
- Gurfinkel, R. , Czeiger D., Douvdevani A., Shapira Y., Artru A. A., Sufaro Y., et al. 2006. Ketamine improves survival in burn injury followed by sepsis in rats. Anesth. Analg. 103:396–402, table of contents. [DOI] [PubMed] [Google Scholar]
- Hagberg, H. , Gilland E., Diemer N. H., and Andine P.. 1994. Hypoxia‐ischemia in the neonatal rat brain: histopathology after post‐treatment with NMDA and non‐NMDA receptor antagonists. Biol. Neonate 66:205–213. [DOI] [PubMed] [Google Scholar]
- Hagberg, H. , Gilland E., Bona E., Hanson L. A., Hahin‐Zoric M., Blennow M., et al. 1996. Enhanced expression of interleukin (IL)‐1 and IL‐6 messenger RNA and bioactive protein after hypoxia‐ischemia in neonatal rats. Pediatr. Res. 40:603–609. [DOI] [PubMed] [Google Scholar]
- Hampson, N. B. , Kregenow D. A., Mahoney A. M., Kirtland S. H., Horan K. L., Holm J. R., et al. 2013. Altitude exposures during commercial flight: a reappraisal. Aviat. Space Environ. Med. 84:27–31. [DOI] [PubMed] [Google Scholar]
- Himmelseher, S. , and Durieux M. E.. 2005. Revising a dogma: ketamine for patients with neurological injury? Anest. Analg. 101:524–534, table of contents. [DOI] [PubMed] [Google Scholar]
- da Huang, W. , Sherman B. T., and Lempicki R. A.. 2009a. Bioinformatics enrichment tools: paths toward the comprehensive functional analysis of large gene lists. Nucleic Acids Res. 37:1–13. [DOI] [PMC free article] [PubMed] [Google Scholar]
- da Huang, W. , Sherman B. T., and Lempicki R. A.. 2009b. Systematic and integrative analysis of large gene lists using DAVID bioinformatics resources. Nat. Protoc. 4:44–57. [DOI] [PubMed] [Google Scholar]
- Jellema, R. K. , Lima Passos V., Zwanenburg A., Ophelders D. R., De Munter S., Vanderlocht J., et al. 2013. Cerebral inflammation and mobilization of the peripheral immune system following global hypoxia‐ischemia in preterm sheep. J. Neuroinflammation 10:13. [DOI] [PMC free article] [PubMed] [Google Scholar]
- Jones, C. T. , Ritchie J. W., and Walker D.. 1983. The effects of hypoxia on glucose turnover in the fetal sheep. J. Dev. Physiol. 5:223–235. [PubMed] [Google Scholar]
- Kapur, S. , and Seeman P.. 2002. NMDA receptor antagonists ketamine and PCP have direct effects on the dopamine D(2) and serotonin 5‐HT(2)receptors‐implications for models of schizophrenia. Mol. Psychiatry 7:837–844. [DOI] [PubMed] [Google Scholar]
- Kawasaki, T. , Ogata M., Kawasaki C., Ogata J., Inoue Y., and Shigematsu A.. 1999. Ketamine suppresses proinflammatory cytokine production in human whole blood in vitro. Anesth. Analg. 89:665–669. [DOI] [PubMed] [Google Scholar]
- Kawasaki, C. , Kawasaki T., Ogata M., Nandate K., and Shigematsu A.. 2001. Ketamine isomers suppress superantigen‐induced proinflammatory cytokine production in human whole blood. Can. J. Anaesth. 48:819–823. [DOI] [PubMed] [Google Scholar]
- Kinney, D. K. , Munir K. M., Crowley D. J., and Miller A. M.. 2008. Prenatal stress and risk for autism. Neurosci. Biobehav. Rev. 32:1519–1532. [DOI] [PMC free article] [PubMed] [Google Scholar]
- Koga, K. , Ogata M., Takenaka I., Matsumoto T., and Shigematsu A.. 1994. Ketamine suppresses tumor necrosis factor‐alpha activity and mortality in carrageenan‐sensitized endotoxin shock model. Circ. Shock 44:160–168. [PubMed] [Google Scholar]
- Kohrs, R. , and Durieux M. E.. 1998. Ketamine: teaching an old drug new tricks. Anesth. Analg. 87:1186–1193. [DOI] [PubMed] [Google Scholar]
- Lankveld, D. P. , Bull S., Van Dijk P., Fink‐Gremmels J., and Hellebrekers L. J.. 2005. Ketamine inhibits LPS‐induced tumour necrosis factor‐alpha and interleukin‐6 in an equine macrophage cell line. Vet. Res. 36:257–262. [DOI] [PubMed] [Google Scholar]
- Larsen, B. , Hoff G., Wilhelm W., Buchinger H., Wanner G. A., and Bauer M.. 1998. Effect of intravenous anesthetics on spontaneous and endotoxin‐stimulated cytokine response in cultured human whole blood. Anesthesiology 89:1218–1227. [DOI] [PubMed] [Google Scholar]
- Liu, J. , Narasimhan P., Yu F., and Chan P. H.. 2005. Neuroprotection by hypoxic preconditioning involves oxidative stress‐mediated expression of hypoxia‐inducible factor and erythropoietin. Stroke 36:1264–1269. [DOI] [PubMed] [Google Scholar]
- Maulik, D. , Zanelli S., Numagami Y., Ohnishi S. T., Mishra O. P., and Delivoria‐Papadopoulos M.. 1999. Oxygen free radical generation during in‐utero hypoxia in the fetal guinea pig brain: the effects of maturity and of magnesium sulfate administration. Brain Res. 817:117–122. [DOI] [PubMed] [Google Scholar]
- Nelson, K. B. , and Grether J. K.. 1999. Causes of cerebral palsy. Curr. Opin. Pediatr. 11:487–491. [DOI] [PubMed] [Google Scholar]
- Northington, F. J. , Ferriero D. M., Flock D. L., and Martin L. J.. 2001. Delayed neurodegeneration in neonatal rat thalamus after hypoxia‐ischemia is apoptosis. J. Neurosci. 21:1931–1938. [DOI] [PMC free article] [PubMed] [Google Scholar]
- Rabaglino, M. B. , Richards E., Denslow N., Keller‐Wood M., and Wood C. E.. 2012. Genomics of estradiol‐3‐sulfate action in the ovine fetal hypothalamus. Physiol. Genomics 44:669–677. [DOI] [PMC free article] [PubMed] [Google Scholar]
- Rabaglino, M. B. , Keller‐Wood M., and Wood C. E.. 2014. Transcriptomics of the late gestation ovine fetal brain: modeling the co‐expression of immune marker genes. BMC Genom. 15:1001. [DOI] [PMC free article] [PubMed] [Google Scholar]
- Rahn, H. , and Otis A. B.. 1949. Man's respiratory response during and after acclimatization to high altitude. Am. J. Physiol. 157:445–462. [DOI] [PubMed] [Google Scholar]
- Rees, S. , and Inder T.. 2005. Fetal and neonatal origins of altered brain development. Early Human Dev. 81:753–761. [DOI] [PubMed] [Google Scholar]
- Richards, E. M. , Wood C. E., Rabaglino M. B., Antolic A., and Keller‐Wood M.. 2014. Mechanisms for the adverse effects of late gestational increases in maternal cortisol on the heart revealed by transcriptomic analyses of the fetal septum. Physiol. Genomics 46:547–559. [DOI] [PMC free article] [PubMed] [Google Scholar]
- Rurak, D. W. , Richardson B. S., Patrick J. E., Carmichael L., and Homan J.. 1990. Oxygen consumption in the fetal lamb during sustained hypoxemia with progressive acidemia. Am. J. Physiol. 258:R1108–R1115. [DOI] [PubMed] [Google Scholar]
- Shaked, G. , Czeiger D., Dukhno O., Levy I., Artru A. A., Shapira Y., et al. 2004. Ketamine improves survival and suppresses IL‐6 and TNFalpha production in a model of Gram‐negative bacterial sepsis in rats. Resuscitation 62:237–242. [DOI] [PubMed] [Google Scholar]
- Smyth, G. K. 2006. Limma: linear models for microarray data Pp. 397–420 in Gentleman R., Carey V. J., Huber W., Irizarry R. A. and Dudoit S. eds. Bioinformatics and computational biology solutions using R and bioconductor. Springer Science & Business Media, New York, NY. [Google Scholar]
- Smyth, G. K. , and Speed T.. 2003. Normalization of cDNA microarray data. Methods 31:265–273. [DOI] [PubMed] [Google Scholar]
- Stefanis, N. , Frangou S., Yakeley J., Sharma T., O'Connell P., Morgan K., et al. 1999. Hippocampal volume reduction in schizophrenia: effects of genetic risk and pregnancy and birth complications. Biol. Psychiatry 46:697–702. [DOI] [PubMed] [Google Scholar]
- Szaflarski, J. , Burtrum D., and Silverstein F. S.. 1995. Cerebral hypoxia‐ischemia stimulates cytokine gene expression in perinatal rats. Stroke 26:1093–1100. [DOI] [PubMed] [Google Scholar]
- Takenaka, I. , Ogata M., Koga K., Matsumoto T., and Shigematsu A.. 1994. Ketamine suppresses endotoxin‐induced tumor necrosis factor alpha production in mice. Anesthesiology 80:402–408. [DOI] [PubMed] [Google Scholar]
- Tan, Y. , Wang Q., She Y., Bi X., and Zhao B.. 2015. Ketamine reduces LPS‐induced HMGB1 via activation of the Nrf2/HO‐1 pathway and NF‐kappaB suppression. J. Trauma Acute Care Surg. 78:784–792. [DOI] [PubMed] [Google Scholar]
- Vannucci, S. J. , and Hagberg H.. 2004. Hypoxia‐ischemia in the immature brain. J. Exp. Biol. 207:3149–3154. [DOI] [PubMed] [Google Scholar]
- Venkata, C. , and Venkateshiah S. B.. 2009. Sleep‐disordered breathing during pregnancy. J. Am. Board Fam. Med. 22:158–168. [DOI] [PubMed] [Google Scholar]
- Volpe, J. J. 2001. Neurobiology of periventricular leukomalacia in the premature infant. Pediatr. Res. 50:553–562. [DOI] [PubMed] [Google Scholar]
- Wang, X. , Stridh L., Li W., Dean J., Elmgren A., Gan L., et al. 2009. Lipopolysaccharide sensitizes neonatal hypoxic‐ischemic brain injury in a MyD88‐dependent manner. J. Immunol. 183:7471–7477. [DOI] [PubMed] [Google Scholar]
- Wang, J. , Duncan D., Shi Z., and Zhang B.. 2013. WEB‐based GEne SeT AnaLysis Toolkit (WebGestalt): update 2013. Nucleic Acids Res. 41:W77–W83. [DOI] [PMC free article] [PubMed] [Google Scholar]
- Welters, I. D. , Feurer M. K., Preiss V., Muller M., Scholz S., Kwapisz M., et al. 2011. Continuous S‐(+)‐ketamine administration during elective coronary artery bypass graft surgery attenuates pro‐inflammatory cytokine response during and after cardiopulmonary bypass. Br. J. Anaesth. 106:172–179. [DOI] [PubMed] [Google Scholar]
- Wieloch, T. 1985. Hypoglycemia‐induced neuronal damage prevented by an N‐methyl‐D‐aspartate antagonist. Science 230:681–683. [DOI] [PubMed] [Google Scholar]
- Wood, C. E. , Rabaglino M. B., Chang E. I., Denslow N., Keller‐Wood M., and Richards E.. 2013. Genomics of the fetal hypothalamic cellular response to transient hypoxia: endocrine, immune, and metabolic responses. Physiol. Genomics 45:521–527. [DOI] [PMC free article] [PubMed] [Google Scholar]
- Wood, C. E. , Rabaglino M. B., Richards E., Denslow N., Zarate M. A., Chang E. I., et al. 2014. Transcriptomics of the fetal hypothalamic response to brachiocephalic occlusion and estradiol treatment. Physiol. Genomics 46:523–532. [DOI] [PMC free article] [PubMed] [Google Scholar]
- Yafeng, D. , Weijian H., Jiaxue W., and Weiner C. P.. 2009. Chronic hypoxemia absent bacterial infection is one cause of the fetal inflammatory response syndrome (FIRS). Reprod. Sci. 16:650–656. [DOI] [PubMed] [Google Scholar]
- Yamakura, T. , Chavez‐Noriega L. E., and Harris R. A.. 2000. Subunit‐dependent inhibition of human neuronal nicotinic acetylcholine receptors and other ligand‐gated ion channels by dissociative anesthetics ketamine and dizocilpine. Anesthesiology 92:1144–1153. [DOI] [PubMed] [Google Scholar]
- Yli‐Hankala, A. , Kirvela M., Randell T., and Lindgren L.. 1992. Ketamine anaesthesia in a patient with septic shock. Acta Anaesthesiol. Scand. 36:483–485. [DOI] [PubMed] [Google Scholar]
- Zhang, B. , Kirov S., and Snoddy J.. 2005. WebGestalt: an integrated system for exploring gene sets in various biological contexts. Nucleic Acids Res. 33:W741–W748. [DOI] [PMC free article] [PubMed] [Google Scholar]
- Zhu, C. , Qiu L., Wang X., Hallin U., Cande C., Kroemer G., et al. 2003. Involvement of apoptosis‐inducing factor in neuronal death after hypoxia‐ischemia in the neonatal rat brain. J. Neurochem. 86:306–317. [DOI] [PubMed] [Google Scholar]