Abstract
Solid dispersions have been used to enhance the bioavailability of poorly water-soluble active pharmaceutical ingredients (APIs). However, the solid state phase, compositional uniformity, and scale-up problems are issues that need to be addressed. To allow for highly controllable products, the Drop Printing (DP) technique can provide precise dosages and predictable compositional uniformity of APIs in two/three dimensional structures. In this study, DP was used to prepare naproxen (NAP)/polyethylene glycol 3350 (PEG3350) solid dispersions with PEG coatings of different molecular weights (MW). A comparison of moisture-accelerated crystallization inhibition by different PEG coatings was assessed. Scanning electron microscopy (SEM), second harmonic generation (SHG) microscopy, and differential scanning calorimetry (DSC) analysis were performed to characterize the morphology and quantify the apparent crystallinity of NAP within the solid dispersions. Thermogravimetric analysis (TGA) was employed to measure the water content within each sample. The results suggest that the moisture-accelerated crystallization inhibition capability of the PEG coatings increased with increasing MW of the PEG coating. Besides, to demonstrate the flexibility of DP technology on manufacturing formulation, multilayer tablets with different PEG serving as barrier layers were also constructed, and their dissolution behavior was examined. By applying DP and appropriate materials, it is possible to design various carrier devices used to control the release dynamics of the API.
Introduction
To increase dissolution rates and bioavailabilities of poorly water-soluble APIs, solid dispersions have received extensive attention as a potential approach. Generally, a solid dispersion is composed of a hydrophobic API and a biologically inert polymer matrix. Solid dispersions can enhance the bioavailability of the API through mechanisms such as reduced API particle sizes, improved wettability, higher porosity, and the ability to reduce the crystallinity of the API. However, despite its advantages, solid dispersions are not prevalent in pharmaceuticals due to two main issues: physical and chemical instability, and the difficulty of processing and scaling up.1–4
To increase the stability of solid dispersions, moisture is one of the main factors that should be taken into consideration. In the presence of moisture, amorphous API and polymeric matrices could encounter moisture-induced phase separation in solid dispersions, decreasing the stability of the final product.5,6 Additionally, the presence of moisture often accelerates the crystallization of compounds.7,8 For poorly water-soluble APIs in solid dispersion, they are preferably produced into amorphous form since it has a higher energy than the crystalline counterpart and thus exhibits a higher dissolution rate and transient solubility. 9 Thus, crystallization of the product during storage is undesirable, and the higher the crystallinity the slower the dissolution rate. With an appropriately chosen coating, moisture can be prevented from coming into contact with the API, and the moisture-accelerated crystallization could be prevented. 10 It has been shown in food science that by using a proper coating, the shelf life of the food can be extended significantly.11,12 The outer layer acts as a physical barrier, protecting materials inside from moisture, oxygen, and other physical and chemical entities that can cause degradation. The coating of samples is presumed to be beneficial to increasing the stability of the APIs, but currently studies are limited on the effect of moisture treatment on the coated final dosage formulations. 13
Drop printing (DP) provides the ability to precisely and reliably distribute APIs within formulations. DP is a manufacturing technique, in which droplets are ejected one at a time with the application of an appropriate trigger. The solution being dispensed can be either solvent-based or a melt-based solution. DP can be applied to various dosage forms, and has the potential for developing individualized doses with controlled release, and the precision placement of drops can allow for the engineering of API release characteristics. Because of these merits, DP has been studied to evaluate its applicability in the pharmaceutical industry. 14–19 The majority of recent literature utilized the solvent-based system. Only limited results of the melt-based system have been presented. 20
In this study, the feasibility to form drug delivery devices of solid dispersions by DP based on the melt system and the flexibility of DP to manufacture formulations was examined. This study was done in support of Test Bed 3, Drop Printing of API, in the Center for Structured Organic Particulates (CSOPS) Engineering Research Center. In this Test Bed, API in molten solutions (melts) is printed on smooth, rough or porous substrates; and in tablet forms. The solid dispersions are used to inhibit crystallization of the API; however, some of the melts have an affinity to moisture which promotes crystallization. This study will therefore investigate the effect of PEG coating layers on crystallization of the API in the solid dispersions.
Thus, two forms of samples were prepared in this study as the first phase of a multiphase effort to understand the effects of the coating layer and dosage form on the crystallization and dissolution dynamics of the API in the solid dispersions. Firstly, a drop of the molten NAP/PEG3350 solution was deposited on a glass slide. After one minute, the solidified drop was covered by a layer of molten PEG that served as a barrier to moisture. PEG with different MW was employed as the coating layer, and their ability to protect NAP from moisture was compared. The composite products were stored in 0% RH and 75% RH at room temperature. The interior solid dispersions were analyzed by SEM, SHG, and DSC to examine the effects of different covers on the crystallization of NAP with and without the presence of moisture. TGA was employed to determine the water content in the samples. Secondly, DP was used to form multilayer tablets, and demonstrate its application on design of API carrier and release control. Different MWs of PEG served as the top and bottom layers of the multilayer tablets, and their influence on the releasing behavior of the API was compared. The goal of this study is to show the potential of applying DP on pharmaceutical manufacturing and its flexibility on designing drug-carrier devices with desired properties.
Materials and Methods
Materials
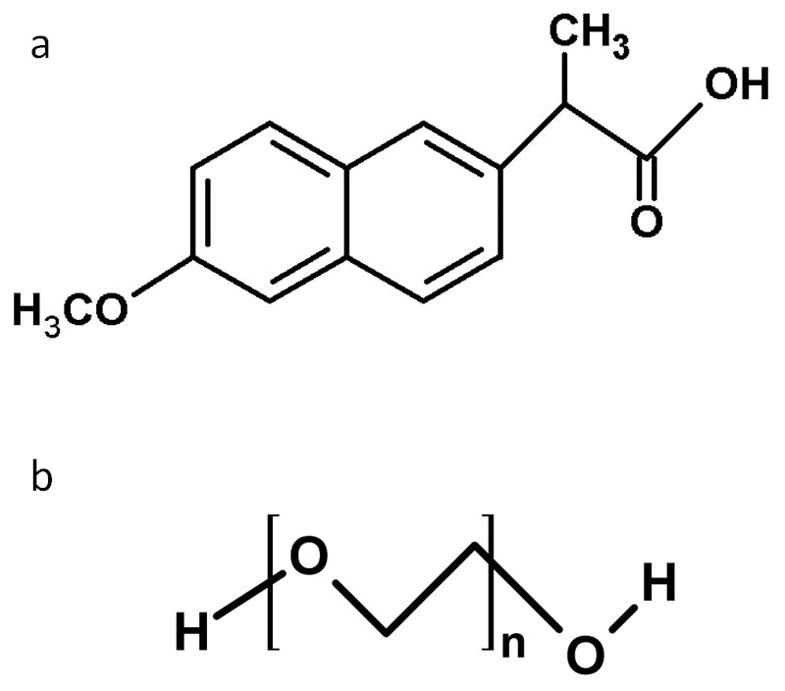
NAP was purchased from Spectrum Chemical (Gardena, CA). PEG (average MW 2000, 3350, 6000, and 8000) were purchased from Sigma–Aldrich, Inc. (St. Louis, MO). Figure 1 shows the molecular structure of NAP and PEG. All other reagents and solvents were of analytical grade.
Figure 1.
Sample preparation
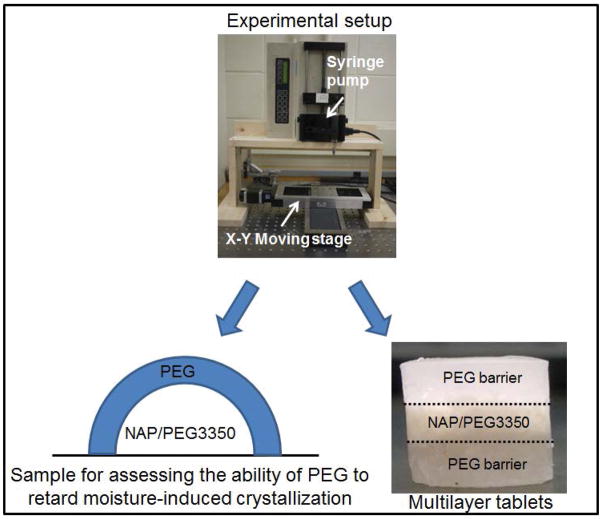
Two forms of samples were prepared as figure 2 shows. For the first one, NAP and PEG3350 were mixed with a ratio of 5:5 and melted in a syringe by a syringe heater to prepare a solid dispersion solution. A volume of 0.1 ml of the NAP/PEG3350 solution was dispensed on a glass slide by a syringe pump. Right after solidification, the drops were covered with a 0.25 ml layer of PEG2000, PEG3000, PEG6000, or PEG8000. The samples were stored at room temperature in a 0% RH or 75% RH environment for one week. The saturated solution of sodium chloride was put inside a closed container to prepare 75% RH environment. The top layers were removed before analyzing the interior solid dispersions. This set of samples was examined by SEM, SHG, DSC and TGA to characterize their morphology, apparent crystallinity, and water content.
Figure 2.
To prepare multilayer tablets with different PEG serving as the barrier layers, molten solutions were dispensed into molds in the following order: 0.125 ml of PEG, then 0.2 ml of NAP/PEG 3350, finishing up with 0.125 ml PEG, where the top and bottom PEG layers were PEG 2000, PEG 3350, PEG 6000, or PEG 8000. Figure 2 shows the image of the multilayer tablet. These multilayer tablets were used to the study dissolution dynamics.
Scanning electron microscopy (SEM)
The morphology of solid dispersions on substrates was investigated by SEM (Model JSM-5600, JEOL Technics, Tokyo, Japan). Samples were cut in half and the cross sectional area was gold sputter-coated to render them electrically conductive.
Second Harmonic Generation (SHG) Microscopy
Second harmonic generation microscopy was used to assess the extent of crystallinity within the prepared NAP/PEG samples. A custom-designed microscope was used with a Spectra-Physics Mai-Tai pulsed laser generating the incident light source with 800 nm pulses repeating at 80 MHz, with pulse widths of ~150 fs, and an average of 30 mW at the sample. The laser was scanned across the sample with the use of an 8 kHz vibrating mirror (EOPC, Ridgewood, New York) on the fast-axis, and with a ~100 Hz galvanometer-driven mirror (Cambridge Technologies, Lexington, Massachusetts) on the slow-axis. A 10x objective (Nikon, Melille, New York, 0.30 NA) was utilized to focus the light onto the sample, and the second harmonic at 400 nm was collected in the epi direction (i.e., back through the same objective in which the fundamental beam was introduced). The SHG signal was collected with a photo-multiplier tube (Hamamatsu R6094, Bridgewater, New Jersey), which was then digitized via a 12-bit PCI express digitizer (AlazarTech ATS9350, Pointe-Claire, QC, Canada). Software data acquisition was performed with Matlab (MathWorks, Natick, Massachusetts) in addition to software and hardware designed by Purdue University’s AMY Facility for Chemical Instrumentation. Further analysis was performed with ImageJ (NIH, Bethesda, Maryland).
Differential Scanning Calorimetry (DSC)
The apparent relative crystallinity of the solid dispersions beneath the various PEG coatings was determined with a differential scanning calorimeter (DSC) Q2000 (TA Instruments, New Castle, DE). The instrument was calibrated for temperature using indium and tin and for enthalpy using indium. Dry nitrogen at 50 ml/min was used as the purge gas. Samples of 3–5 mg were analyzed using a heating rate of 20 °C/min from 25 °C to 180 °C. The relative crystallinity is evaluated as , where ΔH is the melting enthalpy of crystalline NAP within the sample, and ΔHm represents the melting enthalpy of 100% crystalline NAP at the same heating rate. 21 All experiments were done in triplicate.
TGA
The water content within samples beneath PEG coating was estimated by TGA (TA instrument Q500). 10 mg of the sample beneath PEG layer was taken, and heated from room temperature to 500°C with 20°C/min heating rate. The data were analyzed by the software TA Universal Analysis.
Dissolution Testing
The release dynamics of the multilayer tablets was analyzed with a dissolution test. Tablets were dissolved in 1 L of pH 7.4 phosphate buffer solution, within a jacketed flask (connected to a circulating water bath), utilizing a Corning stir plate for stirring. The temperature and stirring rate were 37°C and 100 rpm, respectively. At fixed time intervals, samples were withdrawn with a syringe filter (pore size 0.45 mm) and assayed by a Cary 100 UV-Vis spectrometer (Varian, Palo Alto, CA) for drug content. All experiments were performed in triplicate.
Results
SEM
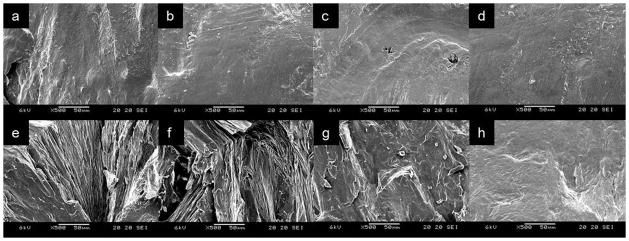
The morphology of the samples was examined by SEM. Figure 3 shows cross-sectional images of NAP/PEG3350 solid dispersions with different PEG coatings. The samples were stored at 0% RH or 75% RH. Figure 3-a to d are samples stored at 0% RH. Regardless of the MW of coatings, the topology of each sample stored at 0% RH was similarly smooth, whereas samples stored at 75% RH had a relatively rougher surface compared to those stored at 0% RH (figure 3-e to h). As the MW of the PEG coating increased, the morphology became smoother. An image of the sample covered by PEG8000 (figure 3-h) appeared similar to samples stored at 0% RH. The morphological similarity between samples stored at 0% RH suggests the difference between samples at 75% RH was caused by moisture.
Figure 3.
SHG
The apparent crystallinity of each sample was quantified via SHG. It is a useful tool for the examination of crystalline samples, allowing for high signal-to-noise measurements, with low limits of detection.22–24 SHG involves the frequency-doubling of light upon interaction with certain classes of noncentrosymmetric crystals.23 It has recently been applied to quantify crystallinity without the need for any additional sample processing.22,25
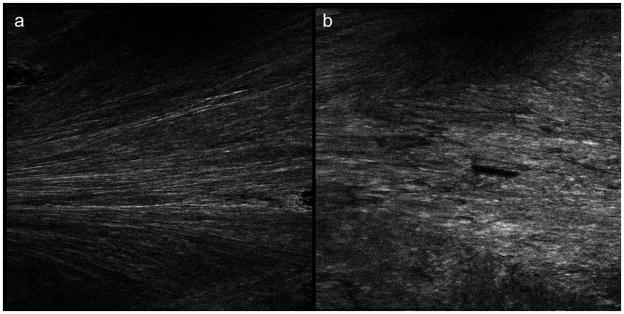
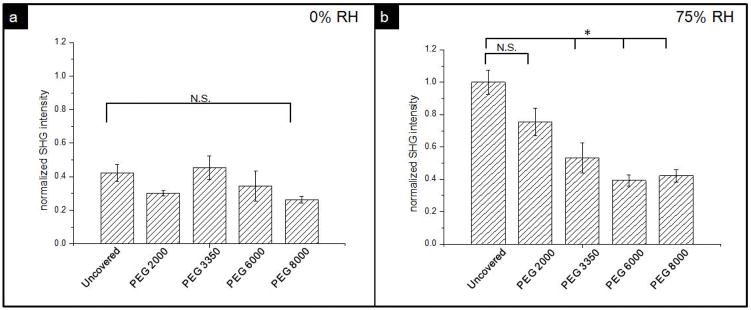
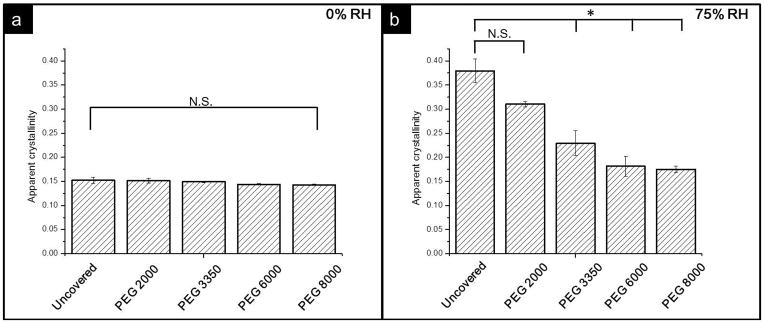
Figure 4 includes representative SHG images of the samples covered by PEG2000 as well as samples covered by PEG8000 stored at 75% RH. Both samples are displayed under the same brightness and contrast settings. The PEG2000 covered sample appears brighter compared to the sample covered by the PEG8000 layer, suggesting NAP crystallized to a greater extent within the uncovered sample. The average intensity of SHG image of each sample was normalized by the value of the sample stored at 75% RH without PEG cover and used to quantify the apparent crystallinity. The result is shown in figure 5, in which the average SHG intensity is proportional to the volume of crystalline NAP. When stored at 0% RH, the MW of the PEG coating did not affect the apparent crystallinity, and each sample had a similar value in the range from 0.2 to 0.5. Whereas values of samples stored at 75% RH exhibited a trend that correlated with the MW of the PEG coatings. The PEG8000-coated sample produced the lowest SHG intensity, and as the MW of the coatings decreased, the relative crystallinity increased while the samples covered by PEG6000 and PEG8000 had similar values. The data was also analyzed by t-test. It shows the sample covered by PEG2000 did not have significant difference compared to sample without coating. For samples covered by PEG3350, 6000, and 8000, the coated samples did show significant difference compared to the sample without coverage, indicating PEG layer with higher MW can slow down the crystallization.
Figure 4.
Figure 5.
DSC
The difference in apparent crystallinity between samples was also confirmed by DSC. DSC has been widely used to quantify apparent crystallinity. 26,21 It has a lower limit of detection, and analysis requires a smaller quantity of materials in comparison to X-ray powder diffraction (XRPD). 27 DSC was utilized to quantify the extent of crystallization of NAP within the NAP/PEG3350 solid dispersion under different coatings.
Figure 6 exhibits DSC curves of PEG2000-covered (6-a) and pure NAP (6-b) samples. Curve 6-b displays the melting of pure NAP with a melting point at 154°C. Curve 6-a shows two endothermic peaks. The first peak at 54°C indicates the melting of PEG3350, and the second peak at 141°C corresponds to the melting of crystalline NAP within the sample. A melting point depression of NAP within the NAP/PEG solid dispersion sample was observed. Thermodynamically, the changes in the melting behavior of NAP arose because as the polymer spontaneously mixes with the liquid phase of the drug there is a negative free energy of mixing which lowers the chemical potential of the drug in the mixture relative to the pure liquid drug. This makes the melting process more thermodynamically favored, leading to melting point depression. Conceptually, melting point depression of APIs within a polymer matrix is similar to dissolution of the drug into the polymer.28 The area under the second peak of each solid dispersion sample was integrated and divided by the area of the endothermic peak of curve 6-b to quantify the apparent crystallinity of NAP within each sample.
Figure 6.
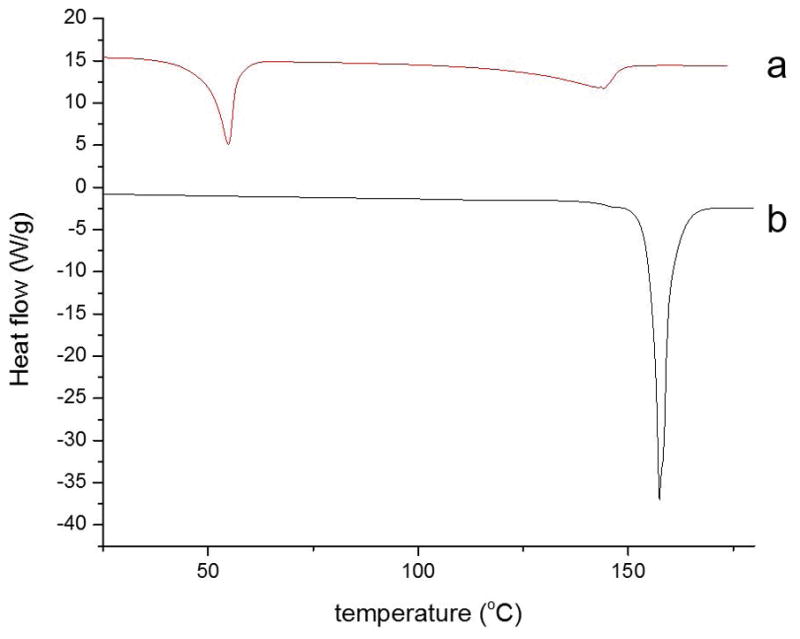
Figure 7 shows that samples stored at 0% RH had a similar extent of crystallization and the value is less than any sample stored at 75% RH. Whereas, for samples stored at 75% RH, the apparent crystallinity increased when the MW of the coatings decreased. Interestingly, samples covered by PEG 6000 resulted in crystallinity similar to those of samples covered by PEG 8000. Similar to the results of SHG, after stored at 75% RH, there is significant difference between samples without cover and those covered by higher MW PEG.
Figure 7.
TGA
The water content within NAP/PEG3350 under different PEG layers was estimated by TGA. Figure 8 shows the TGA curve of the NAP/PEG3350 beneath the PEG2000 layer. The curve demonstrates three steps of weight loss. The first one before 200 °C corresponded to water loss, the second one between 200–360 °C related to decomposition of NAP, and the third step between 360–500 °C was caused by decomposition of PEG3350. No water loss was observed within samples stored at 0% RH (data not shown), and the water content within each sample stored at 75% RH was summarized in table 1. The weight percent corresponded to water loss decreased with increasing MW of the PEG layer indicates high MW PEG layer has higher ability to inhibit water to penetrate and diffuse in the sample.
Figure 8.
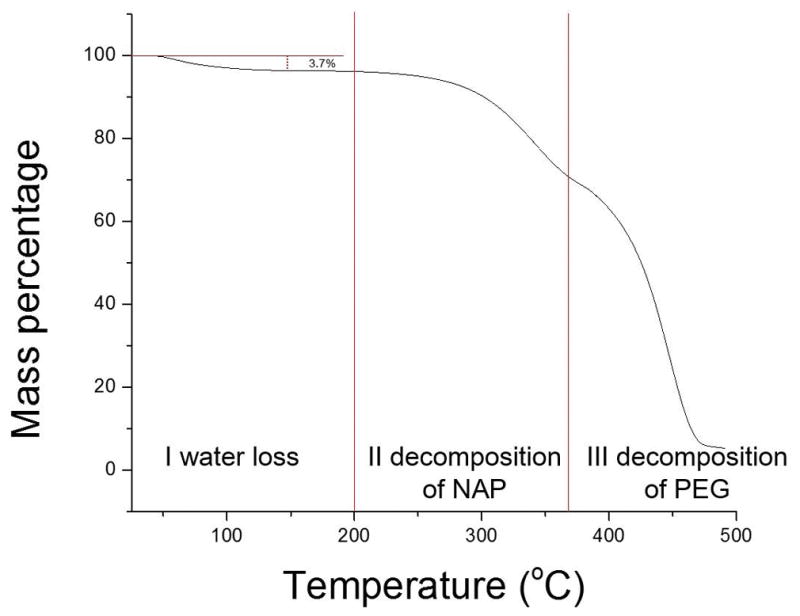
Table 1.
Water content with NAP/PEG3350 stored at 75% RH
| Sample | Weight percent of water loss |
|---|---|
| NAP/PEG3350 covered by PEG2000 | 3.7% |
| NAP/PEG3350 covered by PEG3350 | 1.6% |
| NAP/PEG3350 covered by PEG6000 | 0.4% |
| NAP/PEG3350 covered by PEG8000 | 0.1% |
Dissolution Tests
To demonstrate the flexibility of the DP system on manufacture formulations and dictate the releasing of the API, multilayer tablets were formed, and their releasing behavior was compared with plain tablets.
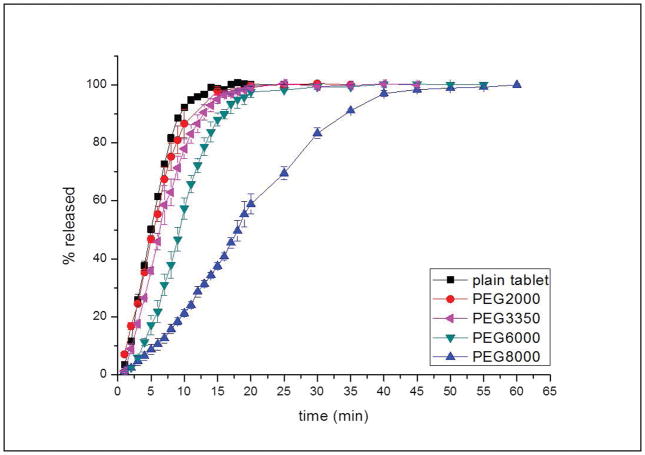
PEG with different MW was used to be the top and bottom layers of the multilayer tablets. The dissolution curves for these samples are provided in figure 9. The enhanced release rate observed at the beginning for a short time of the release process is known as burst effect and is many times undesirable since it may have negative therapeutic consequences (e.g. toxicity due to increase of the concentration of the API beyond the acceptable higher limits). The burst effect was obvious for tablets without layering and tablets with PEG2000 and 3350 as the barrier layers. One hundred percent of the NAP within those tablets was released within 15 minutes. The samples coated by various PEG showed a decrease in the dissolution rate with an increase in the MW of the PEG layers. NAP within the tablets which had PEG8000 as the barrier layers exhibited a much slower releasing behavior and it took 20 minutes longer for NAP to be fully released in comparison to those layered by low MW PEG.
Figure 9.
Discussion
The physical and chemical stability of APIs in formulations is generally affected by moisture. The plasticizing effect of moisture on many systems has been found and widely accepted. 29 To prevent moisture-induced instability, packaging is often utilized. The exterior coating of pharmaceutical final dosage forms can exclude moisture from coming into contact with the API. Therefore, selecting an appropriate material for the coatings is very important. The ability of PEG with different MWs to protect NAP, an API, from moisture-accelerated crystallization was compared. Samples stored at 0% RH were the control group to confirm the difference in the degree of crystallization with samples stored at 75% RH was because of different capability of PEGs to avoid moisture penetration. From the SEM, SHG and DSC results, we found that samples stored at 0% RH crystallized to a lesser extent than samples that were stored at 75% RH, and had a smooth morphology. There was also no evident difference between the samples stored at 0% RH, whereas samples that were stored at 75% RH exhibited a decrease in NAP crystallinity with an increase in MW of the PEG.
PEG’s ability to absorb water is mainly governed by the presence of ether oxygen atoms (–O–) in the oxyethylene polymer backbone as well as hydroxyl (–OH) end groups (Figure 1), both of which can form numerous hydrogen bonds with water.30,31,32 PEG with different MWs have different polymeric chain lengths, which affects the aqueous solubility. As the MW of PEG increases, the relative fraction of hydroxyl endgroups decreases, and the higher molecular weight grades are less hydrophilic and will have a lower aqueous solubility. Thermodynamically, as the chain length increases, the entropy of mixing of the polymer with water will be reduced which will also contribute to a decreased aqueous solubility. 33 Therefore, PEG’s capability for water absorption increases with decreasing MW. The absorbed water increases the mobility of API within the samples and promotes crystallization. In our experiments, the impact of moisture reached an asymptote once the MW of PEG coating had increased to 6000. The apparent crystallinity of NAP covered by PEG 6000 was similar to the samples covered by PEG 8000.
Besides, when building multilayer tablets, the different MW of PEG has an influence on the releasing rate of NAP. The multilayer tablets are often prepared to modify the release of APIs by controlling its diffusion within the matrix. Generally, the axial and radial mass transport of the API occurs during dissolution of the tablets. For multilayer tablets, the surface area of the core layer which contains the API was restricted by the addition of barrier layers to the both sides of the tablet, so the axial diffusion is retarded. In our experiments, PEG was used as the top and bottom barrier layers. When the barrier layers dissolve, the area of the active core exposed to the dissolving medium increases. Depending on the swell/dissolution rate of the barrier layers, hydration and the releasing rate of the active solute at the core changes. The three-layer tablets made with low MW PEG dissolved similarly as tablets without any layering. The burst effect was obvious and NAP released fast. As the MW increases, the aqueous solubility of PEG decreases. Hence, the barrier layers consist of PEG8000 swollen and eroded much slower than the others, resulting in NAP in the active core releasing more slowly. The axial diffusion was delayed by the longer passage, so the releasing rate was retarded. By utilizing the DP technique, packaging formulations have been varied, providing additional degrees of freedom to the design of multilayer tablets. By selecting the proper materials, modulating layers, and changing the geometry of the drug delivery device, various dissolution patterns, such as delayed, pulsatile or multi- modal delivery profiles, can also be achieved. 33
The ability of PEG layer to retard moisture-accelerated crystallization in the solid state is related to deliquesce of the layer. From a previous study, the effect of MW on critical relative humidity (RH0) of PEG is a maximum at 6000. Therefore the NAP/PEG stored at 75% RH had similar crystallinity when coated with PEG6000 and 8000. Whereas, when we used PEG with different MWs to control the releasing of NAP, there was clear difference in dissolution rate between tablets constructed with PEG6000 and PEG8000. These results indicated MW had influence on the aqueous solubility of PEG at MW between 6000–8000, but its impact on deliquesce of crystalline PEG had achieved the highest extent when MW gets 6000.
Conclusions
The DP technique was utilized with a melted dispensing solution in this study. The ability of PEG, with different MWs, acted as a coating to protect NAP/PEG 3350 solid dispersions from moisture-accelerated crystallization. The results suggested that the ability of the coatings to prevent water from entering the interior of the samples increased with increasing MW of the PEG coatings. By applying DP and appropriate coating materials, the design of drug-carrying devices can be very diverse, and can lead to various releasing characteristics that are required of the API delivery.
Acknowledgments
The authors would like to acknowledge the financial support from the National Science Foundation Engineering Research Center for Structured Organic Particulate Systems. SJT and GJS gratefully acknowledge additional support from NIH-R01GM103401.
Footnotes
Notes
The authors declare no personal financial interests.
References
- 1.Dhirendra K, Lewis S, Udupa N, Atin K. Solid dispersions: a review. Pakistan journal of pharmaceutical sciences. 2009;22(2):234. [PubMed] [Google Scholar]
- 2.Janssens S, Van den Mooter G. Review: physical chemistry of solid dispersions. Journal of Pharmacy and Pharmacology. 2009;61(12):1571–1586. doi: 10.1211/jpp/61.12.0001. [DOI] [PubMed] [Google Scholar]
- 3.Serajuddin A. Solid dispersion of poorly water-soluble drugs: early promises, subsequent problems, and recent breakthroughs. Journal of pharmaceutical sciences. 1999;88(10):1058–1066. doi: 10.1021/js980403l. [DOI] [PubMed] [Google Scholar]
- 4.Vasconcelos T, Sarmento B, Costa P. Solid dispersions as strategy to improve oral bioavailability of poor water soluble drugs. Drug discovery today. 2007;12(23):1068–1075. doi: 10.1016/j.drudis.2007.09.005. [DOI] [PubMed] [Google Scholar]
- 5.Rumondor AC, Marsac PJ, Stanford LA, Taylor LS. Phase behavior of poly (vinylpyrrolidone) containing amorphous solid dispersions in the presence of moisture. Molecular pharmaceutics. 2009;6(5):1492–1505. doi: 10.1021/mp900050c. [DOI] [PubMed] [Google Scholar]
- 6.Rumondor AC, Taylor LS. Effect of polymer hygroscopicity on the phase behavior of amorphous solid dispersions in the presence of moisture. Molecular Pharmaceutics. 2010;7(2):477–490. doi: 10.1021/mp9002283. [DOI] [PubMed] [Google Scholar]
- 7.Shamblin SL, Zografi G. The effects of absorbed water on the properties of amorphous mixtures containing sucrose. Pharmaceutical research. 1999;16(7):1119–1124. doi: 10.1023/a:1018960405504. [DOI] [PubMed] [Google Scholar]
- 8.Andronis V, Yoshioka M, Zografi G. Effects of sorbed water on the crystallization of indomethacin from the amorphous state. Journal of pharmaceutical sciences. 1997;86(3):346–351. doi: 10.1021/js9602711. [DOI] [PubMed] [Google Scholar]
- 9.Hancock BC, Zografi G. Characteristics and significance of the amorphous state in pharmaceutical systems. Journal of pharmaceutical sciences. 1997;86(1):1–12. doi: 10.1021/js9601896. [DOI] [PubMed] [Google Scholar]
- 10.Waterman KC, MacDonald BC. Package selection for moisture protection for solid, oral drug products. Journal of pharmaceutical sciences. 2010;99(11):4437–4452. doi: 10.1002/jps.22161. [DOI] [PubMed] [Google Scholar]
- 11.Bourlieu C, Guillard V, Vallès-Pamiès B, Guilbert S, Gontard N. Edible moisture barriers: how to assess of their potential and limits in food products shelf-life extension? Critical reviews in food science and nutrition. 2009;49(5):474–499. doi: 10.1080/10408390802145724. [DOI] [PubMed] [Google Scholar]
- 12.Greener I, Fennema O. Evaluation of edible, bilayer films for use as moisture barriers for food. Journal of Food Science. 1989;54(6):1400–1406. [Google Scholar]
- 13.Nikowitz K, Pintye-Hódi K, Regdon G., Jr Study of the recrystallization in coated pellets-Effect of coating on API crystallinity. European Journal of Pharmaceutical Sciences. 2013 doi: 10.1016/j.ejps.2012.12.018. [DOI] [PubMed] [Google Scholar]
- 14.Yeo Y, Basaran OA, Park K. A new process for making reservoir-type microcapsules using ink-jet technology and interfacial phase separation. Journal of controlled release. 2003;93(2):161–173. doi: 10.1016/j.jconrel.2003.08.021. [DOI] [PubMed] [Google Scholar]
- 15.Scoutaris N, Hook AL, Gellert PR, Roberts CJ, Alexander MR, Scurr DJ. ToF-SIMS analysis of chemical heterogenities in inkjet micro-array printed drug/polymer formulations. Journal of Materials Science: Materials in Medicine. 2012;23(2):385–391. doi: 10.1007/s10856-011-4474-5. [DOI] [PubMed] [Google Scholar]
- 16.Sandler N, Määttänen A, Ihalainen P, Kronberg L, Meierjohann A, Viitala T, Peltonen J. Inkjet printing of drug substances and use of porous substrates-towards individualized dosing. Journal of pharmaceutical sciences. 2011;100(8):3386–3395. doi: 10.1002/jps.22526. [DOI] [PubMed] [Google Scholar]
- 17.Meléndez PA, Kane KM, Ashvar CS, Albrecht M, Smith PA. Thermal inkjet application in the preparation of oral dosage forms: Dispensing of prednisolone solutions and polymorphic characterization by solid-state spectroscopic techniques. Journal of pharmaceutical sciences. 2008;97(7):2619–2636. doi: 10.1002/jps.21189. [DOI] [PubMed] [Google Scholar]
- 18.Genina N, Fors D, Vakili H, Ihalainen P, Pohjala L, Ehlers H, Kassamakov I, Haeggström E, Vuorela P, Peltonen J. Tailoring controlled-release oral dosage forms by combining inkjet and flexographic printing techniques. European Journal of Pharmaceutical Sciences. 2012 doi: 10.1016/j.ejps.2012.07.020. [DOI] [PubMed] [Google Scholar]
- 19.Hsu Hy, Toth SJ, Simpson GJ, Taylor LS, Harris MT. Effect of substrates on naproxen-polyvinylpyrrolidone solid dispersions formed via the drop printing technique. Journal of pharmaceutical sciences. 2013;102(2):638–648. doi: 10.1002/jps.23397. [DOI] [PubMed] [Google Scholar]
- 20.Bashiri-Shahroodi A, Nassab PR, Szabó-Révész P, Rajkó R. Preparation of a solid dispersion by a dropping methodto improve the rate of dissolution of meloxicam. Drug development and industrial pharmacy. 2008;34(7):781–788. doi: 10.1080/03639040801925735. [DOI] [PubMed] [Google Scholar]
- 21.Yang J, Grey K, Doney J. An improved kinetics approach to describe the physical stability of amorphous solid dispersions. International journal of pharmaceutics. 2010;384(1):24–31. doi: 10.1016/j.ijpharm.2009.09.035. [DOI] [PubMed] [Google Scholar]
- 22.Wanapun D, Kestur US, Kissick DJ, Simpson GJ, Taylor LS. Selective Detection and Quantitation of Organic Molecule Crystallization by Second Harmonic Generation Microscopy. Analytical Chemistry. 2010;82(13):5425–5432. doi: 10.1021/ac100564f. [DOI] [PubMed] [Google Scholar]
- 23.Kissick DJ, Wanapun D, Simpson GJ. Second-order nonlinear optical imaging of chiral crystals. Annu Rev Anal Chem. 2011;4:419–437. doi: 10.1146/annurev.anchem.111808.073722. Copyright (C) 2011 American Chemical Society (ACS). All Rights Reserved. [DOI] [PMC free article] [PubMed] [Google Scholar]
- 24.Wanapun D, Kestur US, Taylor LS, Simpson GJ. Single Particle Nonlinear Optical Imaging of Trace Crystallinity in an Organic Powder. Analytical Chemistry. 2011;83(12):4745–4751. doi: 10.1021/ac1031397. [DOI] [PubMed] [Google Scholar]
- 25.Kestur US, Wanapun D, Toth SJ, Wegiel LA, Simpson GJ, Taylor LS. Nonlinear optical imaging for sensitive detection of crystals in bulk amorphous powders. Journal of pharmaceutical sciences. 2012;101(11):4201–4213. doi: 10.1002/jps.23280. [DOI] [PMC free article] [PubMed] [Google Scholar]
- 26.Lappalainen M, Pitkänen I. Quantification of amorphous content in maltitol by. Journal of thermal analysis and calorimetry. 2006;84(2):345–353. [Google Scholar]
- 27.Nagapudi K, Jona J. Amorphous active pharmaceutical ingredients in preclinical studies: preparation, characterization, and formulation. Current Bioactive Compounds. 2008;4(4):213–224. [Google Scholar]
- 28.Baird JA, Taylor LS. Evaluation of amorphous solid dispersion properties using thermal analysis techniques. Advanced drug delivery reviews. 2012;64(5):396–421. doi: 10.1016/j.addr.2011.07.009. [DOI] [PubMed] [Google Scholar]
- 29.Hancock BC, Zografi G. The relationship between the glass transition temperature and the water content of amorphous pharmaceutical solids. Pharmaceutical Research. 1994;11(4):471–477. doi: 10.1023/a:1018941810744. [DOI] [PubMed] [Google Scholar]
- 30.Schachter DM, Xiong J, Tirol GC. Solid state NMR perspective of drug–polymer solid solutions: a model system based on poly (ethylene oxide) International journal of pharmaceutics. 2004;281(1):89–101. doi: 10.1016/j.ijpharm.2004.05.024. [DOI] [PubMed] [Google Scholar]
- 31.Thijs HM, Becer CR, Guerrero-Sanchez C, Fournier D, Hoogenboom R, Schubert US. Water uptake of hydrophilic polymers determined by a thermal gravimetric analyzer with a controlled humidity chamber. Journal of Materials Chemistry. 2007;17(46):4864–4871. [Google Scholar]
- 32.Kjellander R, Florin E. Water structure and changes in thermal stability of the system poly (ethylene oxide)–water. J Chem Soc, Faraday Trans 1. 1981;77(9):2053–2077. [Google Scholar]
- 33.Baird JA, Olayo-Valles R, Rinaldi C, Taylor LS. Effect of molecular weight, temperature, and additives on the moisture sorption properties of polyethylene glycol. Journal of pharmaceutical sciences. 2010;99(1):154–168. doi: 10.1002/jps.21808. [DOI] [PubMed] [Google Scholar]


