Abstract
A novel approach to identify structures and quantify the absolute amounts of individual ligands on multi-functionalized gold nanoparticles by FTIR and HPLC/MS/UV/CLND method has been developed.
Mounting research findings indicate that biomedical sciences will be greatly advanced by nanotechnology.1, 2 A unique feature of nanoparticles (NPs) is its flexibility to be multi-functionalized. Multiple chemical modifications on the surface of NPs confer them the abilities to target disease cells specifically, enhance blood circulation time, evade immune systems, serve as imaging markers, and enable therapy and biocompatibility simultaneously.3, 4 However, there is a significant gap in analytical methods to characterize ligands on NP’s surface.5, 6 Transmission electron microscopy (TEM) and scanning electorn microscopy (SEM) have been successfully applied for morphology evaluations. Fourier transform infrared spectroscopy (FTIR) and Raman are used to characterize the success of functionalization. The loading of the small molecules on NPs can be quantitatively determined by X-ray photoelectron spectroscopy (XPS),7, ultroviolet (UV),8 1H NMR,9 Electrospray ionzation mass spectrometry (ESI-MS)10 and thermogravimetric Analysis (TGA).11 Recently, we demonstrated the feasibility of using 1D and 2D high-resolution magic angle spinning (HRMAS) NMR for a full structural elucidation of organic molecules covalently bound to gold nanoparticles (GNPs).12, 13 However, above methods can not be used to characterize multi-functionalized NPs. To date, only a few methods have been attempted to solve multiple ligands analysis problem. Kaiser test was used to determine the loading of two amines on carbon nanotubes (CNTs) by cleaving them separately under different conditions.14, 15 In another example, fluorescence detector was used to quantify one ligand while TGA for the second one16. However, none of these methods is universal for general quantification of chemical modifications on multi-functionalized NPs.
The lack of characterization method has raised serious questions on the integrity of any correlation of biological activity to surface chemistry. Furthermore, without methods to characterize and quantify the multi-functionalized NPs, the percentage of each ligand on the NP surface can only be speculated on the basis of material ratio used in the reaction. However, due to the competition of reactions and solubility difference, the ratio of starting materials does not reflect the final ligands ratio in multi-functionalized NP products. These gaps led us to consider the development of novel analytical methods to fully characterize ligands on multi-functionalized NPs. Here we report a FTIR and High performance liquid chromatography/mass spectrometry/ultroviolet/Chemiluminescent Nitrogen Detection (HPLC/MS/UV/CLND) method that identify molecular structures and quantify the absolute amounts of individual ligands from the surface of multi-functionalized GNPs simultaneously.
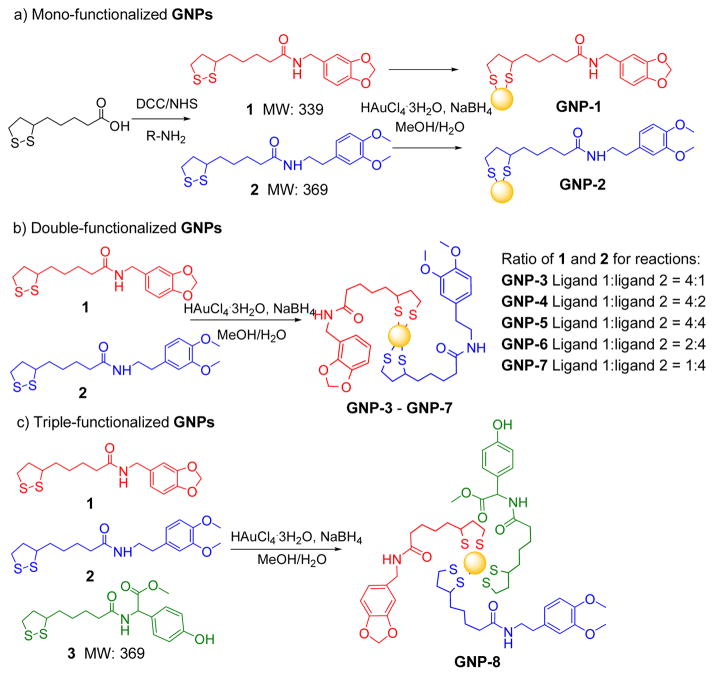
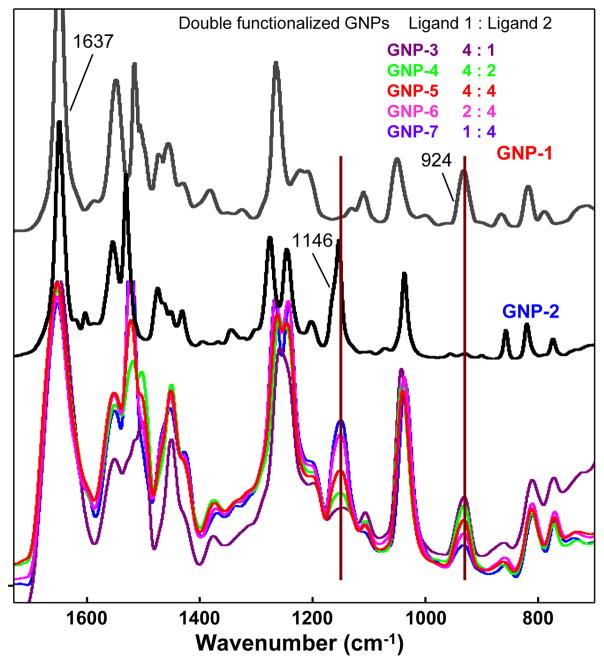
Thioctic acid was selected as linker because the disulfide group is stable during chemical synthesis and offers strong attachment to GNPs. Ligand 1 or 2 reacted with chloroauric acid in methanol/water in the presence of NaBH4 to synthesize mono-functionalized GNP-1 and GNP-2 respectively (Scheme 1a). These GNPs were used to calibrate and assist MS, qualitative and quantitative analysis of multi-functionalized GNPs. FTIR spectra of both GNPs had a common strong C=O stretching vibrations for amide bonds at 1637 cm−1 (Fig. 1). Specifically, GNP-1 had prominent band for C-O stretching vibration of 1,3-dioxolane at 924 cm−1 while GNP-2 had a unique signal for C-O stretching vibration at 1146 cm−1. These two bands were used as markers to provide an initial estimate of the amounts of each ligand in multi-functionalized GNPs.
Scheme 1.
Synthesis route of mono-, double-, and triple-functionalized GNPs (ratio for 1, 2, and 3 for the synthesis of triple-functionalized GNPs is 1:1:1)
Fig. 1.
FTIR spectra of GNP 1–2 and double functionalized GNPs 3–7. The procedure for acquisition of FTIR is in Experimental Section
In order to confront challenges in characterizing multi-functionalized GNPs, we synthesized double-functionalized GNPs 3–7 that contained ligands 1 and 2 in various ratios. Five reactions were performed in parallel using the same conditions as Scheme 1b. The ratios for ligand 1 and 2 for GNPs 3–7 were 4:1, 4:2, 4:4, 2:4, and 1:4 (See ESI† for the synthesis process). After purification and drying, FTIR spectra were recorded for double functionalized GNPs using KBr pellet method. Double functionalized GNPs exhibited the characteristic peaks for ligand 1 at 924 cm−1 and ligand 2 at 1146 cm−1. When the IR spectra of double functionalized GNPs were normalized to equalize intensity of IR bands for the amide C=O bond at 1637 cm−1 (Fig. 1), peak intensities at 924 and 1146 cm−1 were essentially proportional to the relative amount of each ligand on GNPs. The peak intensities of ether C−O bond at 924 cm−1 decreased from GNP-3 to GNP-7 corresponding to the decrease of the percentage of ligand 1 on GNP surface. On the other hand, the intensity of dioxolane C-O bond at 1146 cm−1 increased by this order as the percentage of ligand 2 increased. Although this analysis provided a relative amount of ligands, the absolute quantity of these two surface bound molecules could not be accurately determined using FTIR method.
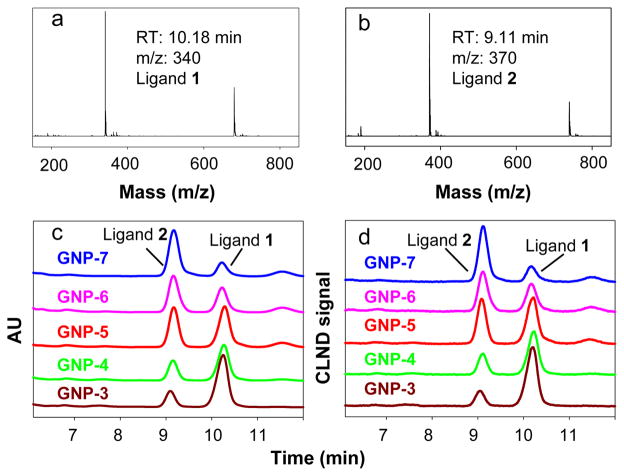
In order to achieve structure identification and quantification of each ligand on GNP-3 to GNP-7 simultaneously and rapidly, we developed a protocol utilizing I2 cleavage and HPLC/MS/UV/CLND for analysis.11 After the cleavage of Au-S bond, the disulfide bond is formed automatically to generate the initial ligand. The naked GNPs were removed by centrifugation and the cleaved molecules were analyzed by HPLC/MS/UV/CLND (Fig. 2). To confirm that the I2 cleavage was really complete, the elemental analysis of carbon, nitrogen and hydrogen was carried out for randomly selected GNPs, GNP-1, GNP-3 and GNP-5, after cleavage. In both GNPs, the contents of C, N, and H were below the lowest instrument detecting limit (0.5%, see Table S1 in ESI†). The elemental analysis of a typical ligand-bound GNP (GNP-1) is: C: 23.11±0.55%, H: 3.09±0.05%, N: 1.35±0.03%. Therefore, our elemental analysis results strongly indicated that the cleavage reaction was complete. The identity of each ligand was confirmed by mass spectrometry (Fig. 2a and 2b) and the relative amount of each ligand was quantitatively determined by an on-line CLND detector (Fig. 2d), using a standard curve made from a single external standard, 2,6-dichloropurine (see ESI). On-line UV (Fig. 2c) can also be used to quantify ligands using calibration curves made from authentic ligands. The ratio of ligand 1 and 2 on GNPs can also be estimated by the area of characteristic peaks from FTIR. When GNP-3 was assumed to have the same ratio as that obtained from CLND, the results of other double-fuctionalized GNPs were consistent with the CLND data (Table 1). The quantitative analysis allowed us to quantify the absolute amount of each ligand on GNPs directly. This eliminated the uncertainty associated with the speculated ligand ratio on the basis of starting materials used in the reaction.
Fig. 2.
Structure identification and quantification of ligands cleaved from double-functionalized GNPs. Mass spectra of ligand 1 (a) and ligand 2 (b) cleaved from GNP-5, UV (c) and HPLC-CLND (d) traces of ligands cleaved from GNPs 3–7 are shown. The HPLC-CLND calibration curve can be found in ESI.
Table 1.
Amount of ligand 1 and 2 on double-functionalized GNPs determined by CLND and FTIR
| GNPs | Ratio of 1 and 2 for reactions | HPLC-CLND data
|
Ratio of 1 and 2 on GNPs by FTIR | ||
|---|---|---|---|---|---|
| Amount (±s.d.) of 1 on GNPs (mmol/g) | Amount (±s.d.) of 2 on GNPs (mmol/g) | Ratio of 1 and 2 on GNPs | |||
| GNP-3 | 4:1 | 0.18±0.01a | 0.04±0.01 | 4.5:1.0 | 4.5:1.0b |
| GNP-4 | 4:2 | 0.13±0.02 | 0.05±0.01 | 5.2:2.0 | 4.7:2.0 |
| GNP-5 | 4:4 | 0.13±0.02 | 0.10±0.01 | 5.2:4.0 | 4.5:4.0 |
| GNP-6 | 2:4 | 0.07±0.01 | 0.09±0.01 | 2.0:2.6 | 2.0:4.0 |
| GNP-7 | 1:4 | 0.04±0.01 | 0.14±0.01 | 1.0:3.5 | 1.0:3.1 |
The standard deviation was based on three independent experiments.
The ratio was calculated based on areas of characteristic peaks assuming GNP-3 had the same product ratio as that determined by CLND.
During the multi-functionalization of GNPs, the loading of individual ligands is naturally affected by competition reactions and does not necessarily reflect the amount of starting material used. Our results demonstrated that the ligand ratio was quite different from the ratio of materials used. In the synthesis of GNP-3 and -5, the same amount of ligand 1 (10.7 mg, 0.032 mmol) was used. However, the amount of ligand 1 on the surface of GNP-3 and -5 was 0.18 and 0.13 mmol/g, respectively, due to the competitive reaction from ligand 2 and the increased amount of ligand 2 used in the synthesis of GNP-5. For the same reason, when the same amount of ligand 2 (11.8 mg, 0.032 mmol) was used in the synthesis of GNP-5 and GNP-7, the final amounts of ligand 2 on these GNPs were 0.10 and 0.14 mmol/g, reflecting the competitive reaction from ligand 1. To substantiate this finding, additional double-functionalized GNPs (GNP-9 to -13) were synthesized and quantitatively characterized by FTIR and HPLC/MS/UV/CLND method (Figure S1–S2 and Table S2 in ESI†). To conclude, there are two important implications from these data. First, speculated ligand ratio on multi-functionalized NPs on the basis of reaction starting materials used is in general not correct due to the competition reactions. Second, quantitative determination of the absolute amount of each ligand is absolutely required for a full characterization of multi-functionalized NPs.
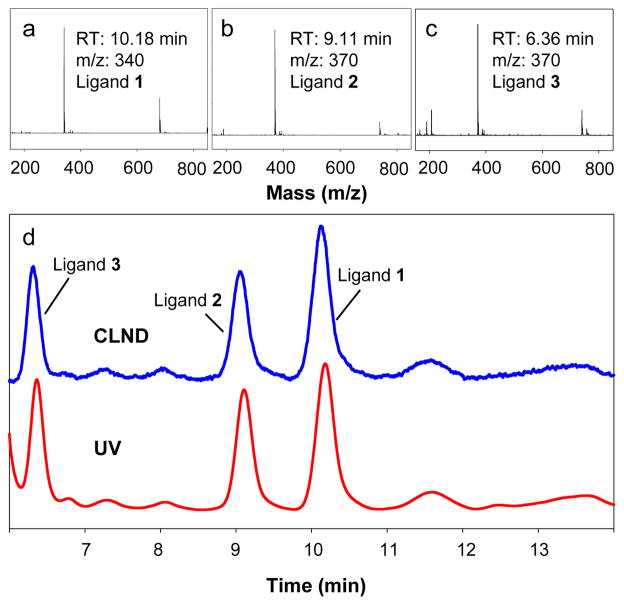
In order to further demonstrate the usage of I2 cleavage and HPLC/MS/UV/CLND method for multi-functionalized GNPs, triple-functionalized GNP-8 was synthesized according to scheme 1c using the ratio of 1:1:1 for ligands 1, 2, and 3. After purification and drying, I2 cleavage and HPLC/MS/UV/CLND analysis was performed for GNP-8 (Fig. 3). When 0.032 mmol of each ligand was used for the synthesis of triple-functionalized GNPs, the loading of ligand 1, 2, and 3 on the GNP-8 was determined to be 0.08±0.01, 0.05±0.01, and 0.04±0.01 mmol/g, respectively. The multiple competitive reactions were once again demonstrated in this triple-functionalized GNP model. Competitive reactions affected the ligand ratio in the final product and in both models ligand 1 showed higher reactivity compared to ligand 2 and 3.
Fig. 3.
Structure identification and quantification of ligands cleaved from triple-functionalized GNPs. Mass spectra of ligand 1 (a), 2 (b), 3 (c), and UV and CLND traces (d) of ligands cleaved from GNP-8 are shown. The same calibration curve was used as in Figure 2.
In conclusion, we have developed a strategy based on I2-cleavage and on-line HPLC/MS/UV/CLND analysis of multiple ligands from multi-functionalized GNPs. The robustness and speed of this method were demonstrated through the quantitative analysis and structural identification of individual ligands on several double- and triple-functionalized GNPs. Analysis results also showed the competition reactions resulted in the different ligand ratio on the final NP product with the starting material ratio applied in the reaction, which further demonstrated the utmost importance of quantitative characterization of ligands from NP products.
Supplementary Material
Acknowledgments
We thank Dr. Lei Yang and Ms. Cynthia Jeffries for their technical assistance in this project. This work was supported by National Cancer Institute (P30CA021765), the National Basic Research Program of China (973 Program 2010CB933504), National Science Foundation of China (90913006), the American Lebanese Syrian Associated Charities (ALSAC), and St. Jude Children’s Research Hospital.
Footnotes
Electronic Supplementary Information (ESI) available: Experimental details for syntheses of multifunctionalized GNPs and characterizations of additional double functionalized GNPs 9–13. See DOI: 10.1039/b000000x/
Notes and references
- 1.Ghosh P, Han G, De M, Kim CK, Rotello VM. Adv Drug Deliv Rev. 2008;60:1307–1315. doi: 10.1016/j.addr.2008.03.016. [DOI] [PubMed] [Google Scholar]
- 2.Bath J, Turberfield AJ. Nature Nanotech. 2007;2:275–284. doi: 10.1038/nnano.2007.104. [DOI] [PubMed] [Google Scholar]
- 3.Ferrari M. Nat Rev Cancer. 2005;5:161–171. doi: 10.1038/nrc1566. [DOI] [PubMed] [Google Scholar]
- 4.Torchilin VP. Adv Drug Deliv Rev. 2006;58:1532–1555. doi: 10.1016/j.addr.2006.09.009. [DOI] [PubMed] [Google Scholar]
- 5.Grainger DW, Castner DG. Adv Mater. 2008;20:867–877. [Google Scholar]
- 6.Hansen SF, Larsen BH, Olsen SI, Baun A. Nanotoxicology. 2007;1:243–U369. [Google Scholar]
- 7.Levy R, Thanh NTK, Doty RC, Hussain I, Nichols RJ, Schiffrin DJ, Brust M, Fernig DG. J Am Chem Soc. 2004;126:10076–10084. doi: 10.1021/ja0487269. [DOI] [PubMed] [Google Scholar]
- 8.Agasti SS, Chompoosor A, You CC, Ghosh P, Kim CK, Rotello VM. J Am Chem Soc. 2009;131:5728–5729. doi: 10.1021/ja900591t. [DOI] [PMC free article] [PubMed] [Google Scholar]
- 9.Kim CK, Ghosh P, Pagliuca C, Zhu ZJ, Menichetti S, Rotello VM. J Am Chem Soc. 2009;131:1360–1361. doi: 10.1021/ja808137c. [DOI] [PMC free article] [PubMed] [Google Scholar]
- 10.Tracy JB, Kalyuzhny G, Crowe MC, Balasubramanian R, Choi JP, Murray RW. J Am Chem Soc. 2007;129:6706–6707. doi: 10.1021/ja071042r. [DOI] [PubMed] [Google Scholar]
- 11.Templeton AC, Wuelfing WP, Murray RW. Acc Chem Res. 2000;33:27–36. doi: 10.1021/ar9602664. [DOI] [PubMed] [Google Scholar]
- 12.Zhou HY, Du FF, Li X, Zhang B, Li W, Yan B. J Phys Chem C. 2008;112:19360–19366. [Google Scholar]
- 13.Du FF, Zhou HY, Chen LX, Zhang B, Yan B. TrAC-Trends Anal Chem. 2009;28:88–95. [Google Scholar]
- 14.Chen JY, Chen SY, Zhao XR, Kuznetsova LV, Wong SS, Ojima I. J Am Chem Soc. 2008;130:16778–16785. doi: 10.1021/ja805570f. [DOI] [PMC free article] [PubMed] [Google Scholar]
- 15.Pastorin G, Wu W, Wieckowski S, Briand JP, Kostarelos K, Prato M, Bianco A. Chem Commun. 2006:1182–1184. doi: 10.1039/b516309a. [DOI] [PubMed] [Google Scholar]
- 16.Nakanishi J, Nakayama H, Shimizu T, Ishida H, Kikuchi Y, Yamaguchi K, Horiike Y. J Am Chem Soc. 2009;131:3822–3823. doi: 10.1021/ja809236a. [DOI] [PubMed] [Google Scholar]
Associated Data
This section collects any data citations, data availability statements, or supplementary materials included in this article.


