Abstract
We present a computational scheme to compute the pH‐dependence of binding free energy with explicit solvent. Despite the importance of pH, the effect of pH has been generally neglected in binding free energy calculations because of a lack of accurate methods to model it. To address this limitation, we use a constant‐pH methodology to obtain a true ensemble of multiple protonation states of a titratable system at a given pH and analyze the ensemble using the Bennett acceptance ratio (BAR) method. The constant pH method is based on the combination of enveloping distribution sampling (EDS) with the Hamiltonian replica exchange method (HREM), which yields an accurate semi‐grand canonical ensemble of a titratable system. By considering the free energy change of constraining multiple protonation states to a single state or releasing a single protonation state to multiple states, the pH dependent binding free energy profile can be obtained. We perform benchmark simulations of a host‐guest system: cucurbit[7]uril (CB[7]) and benzimidazole (BZ). BZ experiences a large pKa shift upon complex formation. The pH‐dependent binding free energy profiles of the benchmark system are obtained with three different long‐range interaction calculation schemes: a cutoff, the particle mesh Ewald (PME), and the isotropic periodic sum (IPS) method. Our scheme captures the pH‐dependent behavior of binding free energy successfully. Absolute binding free energy values obtained with the PME and IPS methods are consistent, while cutoff method results are off by 2 kcal mol−1. We also discuss the characteristics of three long‐range interaction calculation methods for constant‐pH simulations.
Keywords: constant‐pH simulation, absolute binding free energy calculation, binding affinity, pH‐dependence, Bennett acceptance ratio, EDS‐HREM, host–guest system
Introduction
pH is one of key environmental factors that regulates cell activity by changing the protonation states of titratable functional groups of biological molecules. The change of protonation states of titratable residues can lead to conformational transitions of proteins and change in the binding affinities of protein–ligand or protein–protein complexes. Notably, it was shown that 60% of protein–small molecule, 90% of protein–protein, and 85% of protein–nucleic acid complexes have at least one titratable residue that changes its protonation state upon binding at physiological pH (6.5).1 Although many chemical and biological binding reactions are pH‐dependent,2, 3, 4 the effect of pH has been generally neglected for binding free energy calculations because there were hardly any methods to accurately model the effect. In the recent SAMPL3 challenge, a community‐wide blind prediction of binding affinity of various host‐guest systems, determining the correct protonation states of host and guest molecules was a key source of uncertainty for all computational approaches attempted.5, 6
In conventional binding free energy calculations, the protonation states of binding partners are considered fixed during the binding reaction. However, if the pK a values of titratable sites are significantly shifted due to binding, this approximation may lead to large errors in binding free energy estimates. Additionally, the protonation states of molecules are generally pre‐determined by empirical pK a prediction methods.7 Although these methods are reasonably accurate, they are unable to capture the dynamic changes of protonation states during conformational transitions of the system because predictions are generally made based on static conformations. Thus, the use of a constant‐pH molecular dynamics approach is essential to accurately reproduce the pH‐dependence of protonation states and dynamics of a system.
One of the most commonly used constant‐pH simulation methods is a hybrid molecular dynamics (MD)—Monte Carlo (MC) approach, which performs MC steps to determine the protonation states of titratable residues periodically during MD simulations.8, 9, 10, 11, 12, 13 The limitation of this hybrid approach is that it is only compatible with implicit solvent models. With explicit solvent, a sudden change of partial charges is involved with the destruction and formation of several hydrogen bonds, which leads to very large energy differences and an extremely low acceptance ratio of MC steps. In other words, solvent reorganization should be considered for constant‐pH simulations with explicit solvent. Thus, more sophisticated methods that perform short MD simulations14 or free energy calculations15 have been developed to perform constant‐pH simulations with explicit solvent.
Another class of constant‐pH simulation methods is based on a continuous charge model. Constant‐pH methods with explicit solvent were developed based on λ‐dynamics.16, 17 In these methods, the charges of titratable residues continuously fluctuate between different protonation states, which are represented by λ variables. These methods have two major issues that should be addressed for free energy simulations. First, it is not clear whether these methods correctly sample from a semi‐grand canonical (SGC) ensemble of a titratable system.8, 18 Second, coupling λ‐dynamics with standard free energy methods, such as Bennett acceptance ratio (BAR),19, 20 is not trivial.
Recently, we developed a new constant‐pH simulation method21, 22 with explicit solvent using enveloping distribution sampling (EDS)23, 24 and Hamiltonian replica exchange (HREM).25, 26 EDS generates a hybrid Hamiltonian enveloping multiple Hamiltonians, and it allows the sampling of multiple states in a single MD simulation. The method uses a smoothness parameter s, which adjusts the ruggedness and the heights of energy barriers of the hybrid Hamiltonian. Additionally, energy offset parameters are used to tune the free energy differences between states to maximize the number of state transitions in the original EDS approach. For constant‐pH simulations, multiple protonation states are combined using the EDS scheme and the energy offset parameters are used to reflect the effect of environment pH. To enhance state transitions, multiple EDS Hamiltonians with lowered energy barriers are coupled via HREM. It was shown that an ensemble sampled from an EDS‐HREM simulation can easily be restored to the correct SGC ensemble with a simple reweighting procedure.22 However, long‐range electrostatics were treated with a simple cutoff scheme, and the more accurate non‐bonded interaction calculation schemes, such as particle mesh Ewald (PME)27 or the isotropic periodic sum (IPS) method,28, 29, 30 are not addressed.
In this article, we present a computational recipe to calculate the pH‐dependency of binding free energy with three different non‐bonded interaction calculation schemes: a simple cutoff scheme, PME, and IPS. A Cucurbit[7]uril (CB[7]) and benzimidazole (BZ) complex was used as the benchmark system (Fig. 1). CB[7] has drawn much interest from chemists because it binds with various neutral and cationic molecules and can be applied to drug delivery, asymmetric synthesis, molecular switching, and dye tuning.31, 32, 33, 34, 35 BZ and its derivatives are widely used to develop drugs and have various biological activities, such as antiparasitics, anticonvulsants, analgesics, antihistaminics, antiviral, anticancers, antifungals, and anti‐inflammatory activities.36 BZ is known to form a stable complex with CB[7] and undergo a shift of 4 pKa units during binding.37 In this study, we estimated the pK a shift of BZ induced by CB[7] binding from EDS‐HREM constant‐pH simulations. We compared the binding free energies obtained with fully computational approach and those predicted from the estimated pK a values. We also discuss the effects of partial charges and non‐bonded interaction calculation schemes.
Figure 1.
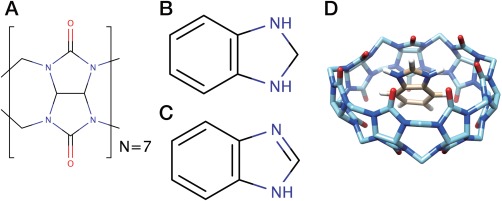
Chemical structures of (A) Cucurbit[7]uril (CB[7]), (B) protonated and (C) deprotonated benzimidazole (BZ). (D) The docked structure of the CB[7]:BZ complex.
Theory
Constant pH simulation with explicit solvent
Here, we briefly review our recently developed EDS‐HREM constant‐pH simulation method, which is compatible with explicit solvent.21, 22 By using a model compound to calculate the free energy difference between protonated and deprotonated species, it is not necessary to calculate the non‐molecular mechanical free energies associated with a protonation state transition. More detailed discussion on the use of model compound in constant‐pH simulation can be found elsewhere.9, 10, 21, 38, 39 Using EDS, we can generate a hybrid Hamiltonian that envelopes the N different protonation states of a titratable system:
| (1) |
where is the potential energy of state i at coordinates x, , s is the smoothness parameter that adjusts the heights of energy barriers between end states, and value is the pH‐dependent energy offset value for state i, which is defined as
| (2) |
where is the deprotonation free energy of a model compound based on a molecular mechanics Hamiltonian, is the pK a value of the free model compound. It should be clearly noted that values are state based and not site based. In the case where multiple sites are used, this value can account for most of the Ewald or IPS effects due to net charge changes due to the deprotonation of multiple sites. This is a significant advantage over site based methods where reference energies are typically assigned on a per site basis. This reduces the need to introduce compensating solvated ions when using Ewald based electrostatic methods. Basically, all of the effects due to net charge and solvent fraction can be folded into the values. This is not to say that compensating solvated ions will have no potential benefit when used with EDS based methods, but just makes it clear that they are less necessary than with site based approaches with a single value per site.
In CHARMM, the EDS method is implemented using EDS temperature,40 defined as . With , Eq. (1) can be rewritten as
| (3) |
It should be noted that the EDS method has a tradeoff between efficiency and accuracy. If T EDS is small, the hybrid Hamiltonian becomes very similar to the original end state Hamiltonians, but the heights of energy barriers remain large, which leads to few state transitions. With the presence of explicit solvent molecules, protonation state transitions require the rearrangement of several hydrogen bonds, which leads to very large energy barriers between distinct protonation states. In contrast, if T EDS is large, the energy landscape of a hybrid Hamiltonian becomes smoother and the heights of energy barriers become lower, which facilitate frequent protonation state transitions. However, the difference between the original end state Hamiltonians and the hybrid Hamiltonian becomes larger, which may lead to sampling of non‐physical conformations.
To overcome this limitation, we combined multiple EDS potentials using HREM21 [Fig. 2(A)]. First, a baseline Hamiltonian with T EDS = 0 is generated to obtain the accurate ensemble of multiple protonation states, which follows the minimum energy surface of the original end state Hamiltonians. We showed that the ensemble obtained with the baseline Hamiltonian can be readily recast into the semi‐grand canonical ensemble through a simple reweighting scheme. To facilitate protonation state transitions, replica exchanges are performed between the baseline Hamiltonian and smoothed EDS potentials with large T EDS values.
Figure 2.
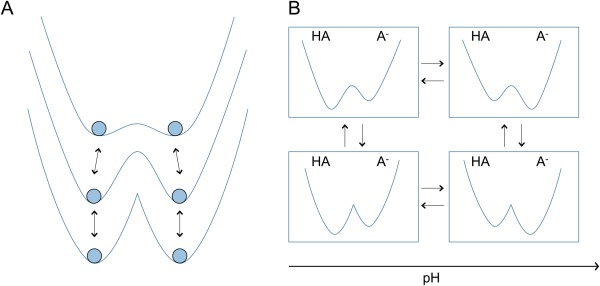
Schematic representation of (A) 1D and (B) 2D EDS‐HREM methods. (A) In the 1D EDS‐HREM, the baseline Hamiltonian that follows the minimum of initial end state Hamiltonians is coupled with smoothed Hamiltonians. (B) In the 2D EDS‐HREM, replica exchanges are performed between different pH conditions.
Recently, we extended this one‐dimensional replica exchange approach, in which replica exchanges are performed between different T EDS values, to a two‐dimensional replica exchange scheme that performs additional replica exchanges between different pH values22 [Fig. 2(B)]. Benchmark results using three amino acid monomers showed that the 2D‐EDS‐HREM method converged to the reference value within 1.5 ns while the 1D‐EDS‐HREM simulations did not. We also compared the sampling efficiencies of the 1D and 2D methods using snake cardiotoxin whose toxicity depends on pH. The results demonstrated that the 2D method enhances the number of protonation state transitions and the extent of conformational sampling with the same amount of computational resources, which led to much smaller errors in pK a estimations. The only limitation of the 2D method compared to the 1D method is the fact that a larger number of processors must be coupled simultaneously. In this work, all constant‐pH simulations were performed with the 2D‐EDS‐HREM method for faster convergence.
Computational scheme for considering the pH‐dependence of binding free energy
A computational scheme to consider the pH‐dependence of binding free energy is shown in Figure 3, where we assume that only the guest is titratable and has N distinct protonation states, . In conventional binding free energy calculations, the simulation is performed with a fixed protonation state to obtain, . However, under a true constant‐pH condition, the N protonation states of the guest and the complex are distributed based on solution pH and their respective pK a values. Thus, binding free energies estimated with the fixed charge approximation should be corrected by including the free energy changes from constraining from N protonation states of the free guest to a single state P i ( ) and releasing the complex Pi from being constrained to a single state to the N states ( ).
Figure 3.
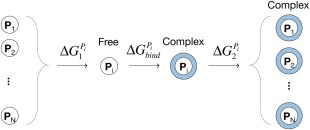
Computational scheme for constant‐pH binding free energy calculation. P i circles on the left side represent possible multiple protonation states of a guest molecule, and blue circles on the right side represent complex formation. is the free energy cost for constraining multiple protonation state to a single protonation state, P i. is the binding free energy calculated with the fixed protonation state, P i. is the free energy change by freeing the protonation state P i to multiple protonation states at a given pH condition.
The constant‐pH ensembles of free BZ (left side of Fig. 3) and the CB[7]:BZ complex (right side of Fig. 3) were obtained by performing 2D‐EDS‐HREM constant‐pH simulations. The constant‐pH ensembles include the protonated and deprotonated states of BZ and their ratio is determined by a given external pH value, which is used to adjust the offsets in the 2D‐EDS‐HREM calculations. The free energy changes associated with constraining multiple protonation states to a single state, , and releasing a single protonation state to multiple states were calculated with the BAR method.6, 19, 20, 40, 41, 42 Note that constraining always has a nonnegative while releasing has a nonpositive . The free energy differences between constant‐pH ( ) and fixed protonation state ( ) ensembles were calculated as follows:
| (4) |
where is the potential energy of a protonation state P i and U EDS is the baseline EDS potential of a given pH condition enveloping N protonation states. and represent the constant‐pH and the P i state ensembles, respectively. A constant C can be obtained via an iterative solution.19, 20, 41 Similarly, the free energy change of releasing a single protonation state to N protonation states can be calculated as follows:
| (5) |
To calculate and , we performed the fixed charge simulations of BZ and CB[7]:BZ with the protonated state partial charges. The absolute binding free energy of BZ in a single protonation state to CB[7] ( in Fig. 3) was calculated with the virtual bond algorithm (VBA).43 Detailed description on the virtual bond algorithm is presented later.
Analytical expression for calculating the pH‐dependence of binding free energy
Here we briefly review the theoretical framework for considering the pH‐dependence of general binding reactions.44, 45, 46, 47 Consider a receptor (R) without a titratable site and a ligand (L) with a single titratable site, whose equilibrium state can be written as
| (6) |
and the observed equilibrium constant K obs is:
| (7) |
From the thermodynamic cycle that includes both the protonated and deprotonated ligand states (Fig. 4), the observed binding constant (K obs) is a function of binding constants of the deprotonated ligand ( ) and protonated ligand ( ) as well as the equilibrium constant between the protonated and deprotonated states of the free ligand and the complex, and , respectively.
| (8) |
| (9) |
Figure 4.
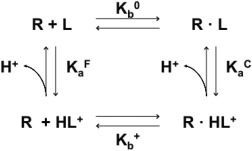
Thermodynamic cycle of the complex formation between a receptor (R) and a protonated ( )/a deprotonated (L) ligand. and are the binding constants of the protonated and deprotonated ligands. and represent the equilibrium constants between protonated and deprotonated states of the free ligand and the complex.
Thus, the pH‐dependent binding free energy is written as:
| (10) |
| (11) |
where and are the binding free energies obtained with the fixed deprotonated and protonated ligands. If multiple residues are titrated, this relationship can only be used when they are uncoupled.
Method
Preparation of test system
The CHARMM generalized force field (CGenFF) parameters of protonated and deprotonated BZ and CB[7] molecules were generated by the Paramchem server.48, 49 The CGenFF program version 0.9.7.1 and the force field version 2b8 were used. The parameter and charge penalties of the deprotonated BZ are 0.0, and those of the protonated BZ are 79.0 and 55.6, respectively. The free BZ molecule and the CB[7]:BZ complex were solvated with TIP3P water molecules using the CHARMMing server.50 For both molecules, two cubic water boxes with different sizes, 30Å and 40Å, were prepared. The 30Å boxes were used for simulations performed with a simple cutoff scheme without using PME or IPS to treat long‐range interactions. The PME and IPS simulations were carried out with the 40 Å boxes.
For all simulations, the cutoff used for building the non‐bonded list was 15 Å, electrostatic interactions were truncated by the force shift method with a cutoff of 12 Å, and the van der Waals interactions were truncated with a switching function between 10 Å and 12 Å. For the PME simulations, the grid spacing in each spatial direction was set to <1 Å. All initial solvated structures were minimized by 100 steps of the adopted basis Newton–Raphson method.51 After minimization, the systems were equilibrated for 200 ps under constant temperature and pressure condition with the Langevin piston barostat52 and the Nose‐Hoover thermostat.53
Constant pH simulation with EDS‐HREM
Constant pH simulations were performed with the 2D EDS‐HREM method of CHARMM.54 For a given conformation, the potential energies of protonated and deprotonated states were calculated independently and combined via Eq. (3) with CHARMM's MSCALE command.55 The offset value in Eq. (3) was determined based on the external pH and the deprotonation free energy obtained with each non‐bonded interaction calculation scheme (Table 1). The deprotonation free energies were calculated with the thermodynamic integration (TI) method [Eq. (12)].
| (12) |
Table 1.
Deprotonation Free Energies of BZ (kcal mol−1)
| Deprotonation free energy | |
|---|---|
| Cutoff | 1.64 |
| PME | 10.11 |
| IPS | 9.99 |
Eleven equally spaced λ values ranging from 0.0 to 1.0 were used.
The constant‐pH simulations of the CB[7]:BZ complex with CGenFF partial charges were performed with six different pH values: 10.5, 11.5, 12.5, 13.5, 14.5, and 15.5. Initially, the constant‐pH simulations of the complex were performed with a pH‐range from 7.0 to 11.0, whose median is the experimental pK a value of the CB[7]:BZ complex. However, only a small fraction of trajectories at pH = 10.0 and 11.0 were observed to be in the deprotonated state, which indicates that the pK a estimated from the calculation is shifted higher than the experimental value. Thus we performed constant‐pH simulations with the higher pH values listed above.
To assess the effect of partial charges on the pK a calculation, we performed constant‐pH simulations with the RESP partial charges56 that were used in a previous study by Kim et al.57 Through a similar procedure, the constant‐pH simulation of the complex with the RESP partial charges were performed with 6 pH values ranging from 1.5 to 7.5 with an interval of 1.0 pH unit. The simulations of the free BZ molecule were performed at pH = 3.5, 4.5, 5.5, 6.5, and 7.5. For all constant‐pH simulations, the following four T EDS values were used: 0, 7000, 14,000, and 30,000. In this study, the T EDS values were determined via trial‐and‐error by running a series of short simulations so that exchange rates between replicas with different TEDS values range from 10 to 30% for an efficient sampling (Supporting Information Tables I—VI). We are planning to devise an automatic procedure that can optimize T EDS values, which is similar to what was suggested for a general EDS calculation.24 A timestep of 1 fs was used. All simulations were performed for 1 ns under NVT conditions. The temperature was maintained at 300 K using the Nose‐Hoover thermostat. The SHAKE algorithm constrained the length of bonds between hydrogens and heavy atoms to their parameter values.
Absolute binding free energy calculation by virtual bond algorithm
The absolute binding free energy of CB[7] and BZ were calculated using the virtual bond algorithm (VBA).43 Because the direct calculation of absolute binding free energy is computationally complex, the thermodynamic cycle shown in Figure 5 was used. The absolute binding free energy was calculated from the difference between the decoupling free energy of the ligand and its solvation free energy:
| (13) |
where is the free energy cost for turning on six geometric restraints, one distance, two angle, and three dihedral angle harmonic restraints, to keep the ligand bound to the host, is the free energy change of decoupling the electrostatic interactions of the guest, and is the free energy change of decoupling the van der Waals interactions. and are the electrostatic and vdW contributions of the solvation free energies of the guest. The free energy of removing the restraints was calculated by the analytic formula of the VBA method43:
| (14) |
where V is the size of simulation box, is the reference distance of the distance restraint, and are the reference values of the angle restraints, and K values are the force constants of distance, angle, and dihedral angle harmonic restraints. K r was set to 5 kcal mol−1 and the other force constants of angle restraints were set to 20 kcal mol−1. The σ H, σ G, and σ HG terms in the second term are the symmetry numbers of the host, the guest, and their complex; σ G and σ HG are 1 and σ H is 14.
Figure 5.
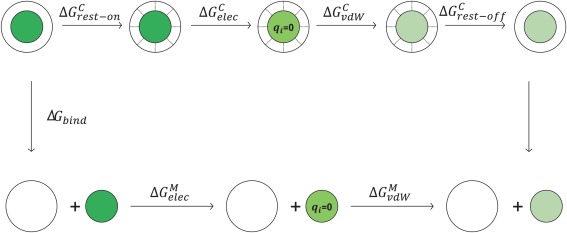
Thermodynamic cycle of the virtual bond algorithm for absolute binding free energy calculation. Green circles represent the various states of the guest and a larger white circle represents the host. is the free energy cost for turning on bond, angle, and dihedral restraints. is the free energy change of decoupling the electrostatic interactions of the guest from the rest of the system. is the free energy change of decoupling the van der Waals interactions of the guest. corresponds to the free energy change by turning off the restraints, which can be obtained with the analytic formula. is the free energy change of decoupling electrostatic interactions of the guest monomer. is the free energy change of decoupling the van der Waals interactions of the guest monomer.
The free energies of individual steps of VBA were calculated with TI. The λ values for TI were adjusted so that the fluctuation of of each window is similar to or less than thermal fluctuations. For the calculation of , we used 19 λ points: (0.0005, 0.002, 0.004, 0.00625, 0.01, 0.01875, 0.03, 0.05, 0.075, 0.1, 0.2, 0.3, 0.4, 0.5, 0.6, 0.7, 0.8, 0.9, 1.0). For the calculations of and , we used 15 λ points: (0.0, 0.1, 0.2, 0.3, 0.4, 0.5, 0.6, 0.675, 0.725, 0.775, 0.875, 0.925, 0.975, 1.0). For each λ value, the derivatives of potential energy with respect to λ were sampled for 100 ps, which amounts to 1.9 ns for the simulations and 1.5 ns for the and simulations.
Results and Discussion
Constant‐pH simulations with PME and IPS
It is well known that systems using periodic boundary conditions (PBC) have an artifact due to polarization.58, 59, 60, 61, 62, 63 In PME, the net charge of the unit box should be neutral to ensure the convergence of the calculation. If the unit cell has a nonzero net charge, a background charge is introduced as a uniform continuous plasma with opposite charge from the unit cell. This background charge correction shifts the reference value of the PME potential, but it does not affect the forces from PME. This correction also introduces an artifact in free energy calculations. An ion solvated in a cubic box interacts with its image charge and the background plasma. The corresponding free energy contribution is , where q is the charge of the ion, L is the box size, ϵ is the solvent dielectric constant, and ζ is a constant. Based on a correction to account for this term, the free energy of placing a charge on an ion in an infinite solvent box can be obtained from a PBC simulation of a box of size L as follows:63
| (15) |
Therefore, with PME, it is important to use identically sized boxes for the deprotonation free energy calculation of a model compound and the constant‐pH simulation of the target system.
In addition to PME, we also tested the performance of the IPS method. The IPS method calculates the pair‐wise interactions within a sphere defined by a cutoff, a local region. Interactions with atoms beyond the cutoff are replaced with the isotropic periodic image of the local region. Thus, the total IPS potential is calculated as the sum of analytic pairwise potentials, and unlike PME, net charge correction is not necessary, which makes the method suitable for constant‐pH simulations. In this study, we used 40 Å cubic water boxes for all TI calculations and constant‐pH simulations with PME and IPS (Table 1). The deprotonation free energies calculated with the cutoff, PME and IPS methods clearly indicate that the IPS result is in close agreement with the PME result. It also shows that using the cutoff method yields a much smaller deprotonation free energy by about 8 kcal mol−1 than the PME and IPS results. This large difference is due to the fact that the PME and IPS methods include the effects of infinite periodic lattices, while the cutoff method only considers interactions within a cutoff distance.
The titration curves of the CB[7]:BZ complex and the free BZ molecule obtained with 2D‐EDS‐HREM constant‐pH simulations using the cutoff, PME, and IPS methods are shown in Figures 6 and 7. These curves show that the 2D‐EDS‐HREM simulations with the PME and IPS methods yield similar results to the simulation with the cutoff method. Because EDS‐HREM yields the SGC ensemble of a system, our simulations do not have any unwanted or unexpected artifacts in conformational sampling or treating electrostatic interactions as long as the same size boxes are used for the reference free energy calculation and constant‐pH simulations. The estimated pK a values of the CB[7]:BZ complex range from 12.7 to 13.5, which are much larger than the experimental pK a value of the monomer, 5.5. These values are also larger than the experimental pKa of the complex, 9.0. This large shift indicates that the binding free energy of the complex formed with the protonated BZ is over‐stabilized relative to the complex with the neutral BZ. This discrepancy is mostly due to over‐polarized partial charges of the host and protonated BZ because the EDS‐HREM method yields the SGC ensemble of a given Hamiltonian. Previously we showed that the 2D‐EDS‐HREM calculations converged fast in all benchmark systems. Thus the sampling errors of the simulations are much smaller than the errors due to the partial charges. The over‐stabilization of the protonated CB[7]:BZ complex due to over‐polarization is also supported by its high charge penalty scores. The largest penalty score, 55.6, is assigned to two carbons bridging a benzene ring and an imidazole ring and the second largest penalty score, 41.1, is assigned to two nitrogen rings. Generally, a penalty score from ParamChem higher than 50 indicates that an extensive validation and optimization of the partial charges are necessary.48, 49
Figure 6.
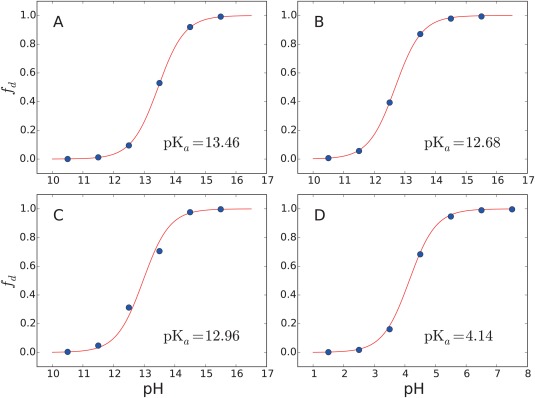
Titration curves of CB[7]:BZ complexes obtained from constant‐pH simulations with three non‐bonded interaction calculation schemes: (A) cutoff, (B) PME and (C) IPS methods. Panel (D) shows the titration curve of CB[7]:BZ complex with RESP charges using the simple cutoff scheme. The x axes represent pH and the y axes represent the fraction of deprotonated BZ, f d. Solid lines represent the deprotonated fraction estimated with the Henderson‐Hasselbach equation using the estimated pK a values. Blue dots are obtained from the constant‐pH simulations.
Figure 7.
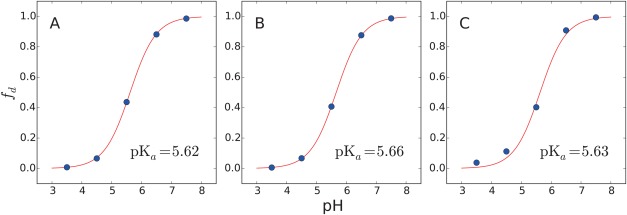
Titration curves of the free BZ molecule obtained from constant‐pH simulations with three non‐bonded interaction calculation schemes: (A) cutoff, (B) PME and (C) IPS methods. The x axes represent pH and the y‐axes represent the fraction of deprotonated BZ, f d. Solid lines represent the deprotonated fraction estimated with the Henderson‐Hasselbach equation using the estimated pK a values. Blue dots are obtained from the constant‐pH simulations.
In the study of Kim et al.,57 they presented a computational scheme to consider the pH effect in binding free energy calculation with the generalized Born (GB) implicit solvent model.64 Interestingly, the calculated pK a value of the CB[7]:BZ complex using the RESP charge and explicit TIP3P water is 4.14, meaning that the pK a value is shifted in the opposite direction of the experimental result. This indicates that neutral BZ binds more strongly with CB[7] than protonated BZ. This result shows that the calculation of pKa value is extremely sensitive to the partial charges of a system. This large discrepancy is probably due to the incompatibility between the vdW parameters of CGenFF and the RESP charges. Thus, a highly sophisticated charge optimization procedure should be performed to achieve a better agreement with the experimental results. Another possible way to improve the result is to consider the polarizability of the host and guest molecules by using polarizable force fields.65, 66 Because the protonation site of BZ is not located at the center of CB[7], the partial charges of CB[7] should be distributed asymmetrically when bound with the protonated BZ. However, this effect is not considered in this study. In addition, the polarizability of water should be considered properly, because the binding free energy is a result of a subtle balance between newly formed interaction between the host‐guest interactions and lost host‐water interactions.67
To assess the convergence of the constant‐pH simulations of the the CB[7]:BZ complex, we investigated the timeseries of estimated pK a values, (Fig. 8). The values are obtained with the data sampled until a time point t. The analysis shows that the constant‐pH simulations with all long‐range interaction schemes are converged in 1.5 ns. All values remain stable after 1.5 ns.
Figure 8.
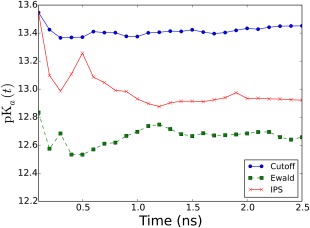
The timeseries of pK a values obtained with the cutoff (blue), the PME (green) and the IPS (red) method.
The computational cost of our method is proportional to the number of protonation states considered. The apparent computational cost of EDS‐HREM simulation is proportional to if there are n titratable residues. However, this computational cost can be reduced. There are two ways to improve the efficiency of an EDS‐HREM calculation. First, a subset of possible protonation states may not be included in a constant‐pH calculation based on experimental or structural information. For example, HIV protase has four titratable aspartic acids. Because of steric hindrance between the carboxyl groups of the aspartic acids, only one residue is allowed to be in the protonated state, which reduces the number of protonation states considered to 5 instead of 16. Second, more efficient implementation of the EDS method will improve the efficiency of the EDS‐HREM scheme. To improve the performance of EDS calculations, we are planning to implement a more efficient EDS routine, which calculates the EDS potential from the total potential energy of one reference state and the energy differences between the reference state and the rest of states. For a constant‐pH simulation, the differences of the electrostatic interactions between titratable residues and their neighboring atoms within a cutoff distance are necessary to calculate the EDS potential.
pH‐dependent binding free energy
We calculated the pH‐dependence of binding free energy of the CB[7]:BZ complex in explicit water with three non‐bonded interaction calculation schemes (Fig. 9). For each scheme, we performed three independent sets of VBA simulations and the average and standard deviation obtained from the three simulations were calculated (Table 2). In the high pH range, the binding free energies were calculated by considering the existence of multiple protonation states of the complex ( in Fig. 3). To calculated the pH‐dependent binding free energy, the absolute binding free energy between neutral BZ and CB[7] was first calculated and corrected by the distribution of the protonation states of the CB[7]:BZ complex. The free BZ molecule was assumed to be fully deprotonated due to high pH. In contrast, in the low pH range, the absolute binding free energy value calculated with protonated BZ was adjusted by the protonation state distribution of the free BZ molecule corresponding to in Figure 3, and the complex was assumed to be fully protonated.
Figure 9.
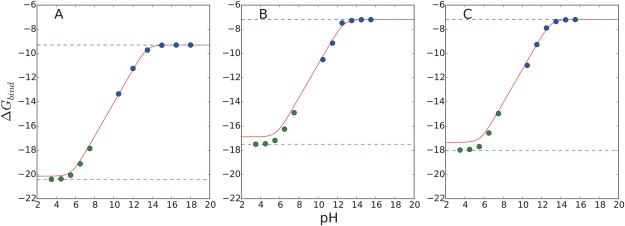
pH‐dependent binding free energies of the CB[7]:BZ complex with CGenFF charges using different non‐bonded interaction calculation schemes: (A) cutoff, (B) PME, and (C) IPS. Solid lines are obtained with the analytic formula, Eq. (10), using the pK a value estimated from the constant‐pH simulation and the binding free energy calculated with the deprotonated BZ as a reference binding free energy ( ). Blue and green dotted lines correspond to the calculated absolute binding free energy values of the deprotonated and protonated BZ molecule using the VBA method [Eq. (13)]. Blue and green dots are calculated by considering the effect of multiple protonation states using the BAR calculations [Eq. (5)]. The deviations between the blue dotted lines and blue dots correspond to the values in Figure 3. The free energy values are lowered by allowing multiple protonation states. Under the high pH conditions, the free BZ molecule is assumed to be fully deprotonated. The deviations between the green dotted lines and the green dots correspond to values in Figure 3 corresponding to the free energy cost associated with constraining multiple protonation states to a single protonation state. Under the low pH conditions, the CB[7]:BZ complex is assumed to be fully protonated..
Table 2.
Calculated Absolute Binding Free Energy of BZ with CGenFF Partial Charges (kcal mol−1)
|
|
|
|
|
|
|
|
|||||||||
|---|---|---|---|---|---|---|---|---|---|---|---|---|---|---|---|
| Cutoff | deprot | 10.1 ± 0.8 | 3.9 ± 0.1 | 0.2 ± 0.2 | −7.9 | 7.9 ± 0.1 | −10.9 ± 0.3 | −9.3 ± 0.9 | |||||||
| prot | 9.1 ± 0.3 | 22.5 ± 0.1 | 0.2 ± 0.5 | −7.9 | 14.3 ± 0.0 | −10.8 ± 0.1 | −20.4 ± 0.9 | ||||||||
| PME | deprot | 10.0 ± 0.8 | 2.4 ± 0.0 | 0.4 ± 0.5 | −8.8 | 6.4 ± 0.0 | −9.7 ± 0.3 | −7.2 ± 1.1 | |||||||
| prot | 8.7 ± 0.6 | 24.6 ± 0.1 | 0.0 ± 0.1 | −8.8 | 16.7 ± 0.1 | −9.6 ± 0.2 | −17.5 ± 0.6 | ||||||||
| IPS | deprot | 10.1 ± 0.3 | 2.6 ± 0.1 | 2.3 ± 0.5 | −8.8 | 6.4 ± 0.0 | −7.4 ± 0.3 | −7.2 ± 0.7 | |||||||
| prot | 8.1 ± 0.5 | 25.0 ± 0.1 | 2.8 ± 0.7 | −8.8 | 16.6 ± 0.1 | −7.5 ± 0.1 | −18.0 ± 0.9 |
It is clear that the computational results obtained with BAR calculations show good agreement with the estimated values using the analytical formula, Eq. (10), which indicates that our computational protocol shown in Figure 3 successfully captures the pH‐dependence of binding free energy. For all three non‐bonded schemes, the discrepancies between the calculated absolute binding free energy of the fully protonated BZ using the VBA method and the predicted value obtained with the fully deprotonated BZ calculation results and Eq. (10) are smaller than 1 kcal/mol, which are within the range of error bars of the VBA calculations (Table 2). This indicates that our computational protocol leads to consistent pH‐dependent binding free energy estimates of a given system regardless of its protonation state chosen.
It is worth noting that the PME and IPS calculations result in almost identical absolute binding free energies of protonated and deprotonated BZ, which is consistent with previous studies.68, 69 In contrast, the binding free energies calculated with the cutoff scheme are lower than the PME and IPS results by ∼2 kcal mol−1 consistently. Compared with the experimental value, −4.4 kcal mol−1, the PME and IPS results show a smaller deviations than the cutoff results, which implies that using accurate long‐range interaction methods leads to better predictions. It should be noted that the deviations of simulation results from the experimental value is mainly due to the force field and partial charge parameters used. The sampling errors of the VBA calculations were estimated to be less than 1 kcal mol−1 (Table 2). The current results show that absolute binding free energy calculation is highly sensitive to partial charges and charge models, which suggests a necessity for using more accurate partial charges or charge models, such as polarizable force fields.
Our computational protocol can be especially useful when multiple sites are coupled and titrated simultaneously. The analytic formula, Eq. (10), can be used only when all titratable sites are decoupled. Otherwise, the titration curves will show a non‐sigmoidal behavior, and the relationship does not hold. In contrast, calculating the free energy difference between a fixed protonation state and multiple protonation states is straightforward and rigorous because the EDS‐HREM method guarantees sampling of the correct SGC ensemble of a system.
The contributions of individual steps of the VBA method are listed in Table 2. Among all terms, values are the major sources of calculation errors. In contrast, the electrostatic and vdW free energies of the complex state and the free state show smaller fluctuations. This is consistent with the previous observation that absolute binding free energy calculations show larger fluctuations than relative binding free energy calculations or solvation free energy calculations.70
Conclusion
In this work, we present a computational scheme to perform a pH‐dependent binding free energy calculation with explicit solvent using the recently developed 2D EDS‐HREM method. We benchmarked our scheme by calculating the binding energies of the cucurbit[7]uril and benzimidazole complex at various pH conditions. We compared the constant‐pH simulation results with three different non‐bonded interaction calculation methods: the cutoff, PME and IPS methods. Our results show that an absolute binding free energy at a given pH can be reproduced with a sampling error less than 1 kcal/mol by using either a protonated or deprotonated ligand based on given partial charges. The absolute value of disagreements between experiment and our calculations range from 3 to 4 kcal mol−1, which are mainly due to an incorrect representation of electrostatic interactions between the CB[7] and BZ molecules. The PME and IPS calculations result in consistent pK a estimates and absolute binding free energy results, which indicates that the IPS method can be a proper alternative to PME for constant‐pH simulations with explicit solvent because it does not require the charge neutrality of a system. In addition, the PME and IPS calculation results are closer to the experimental value than the result obtained with the cutoff method.
However, the estimated pK a shifts due to the complex formation are much larger than the experimental value. This difference is entirely due to the choice of force field and partial charges used. The results presented here are accurate for the model used. The high sensitivity of the result to the specific choice of partial charges, suggests that, for this method to become truly useful, a serious look at the choice of charge model and associate charge parameters should be warranted.57 Specific deviations from experimental values seen here are likely due to the use of over‐polarized partial charges of the host and the guest. A more accurate charge partial charge assignment scheme may be sufficient to reproduce experimental values, but it is more likely that a more advanced electrostatic model that includes polarization and higher multipole moments may be needed before this method can provide results that are reliably consistent with experiment.
Supporting information
Supporting Information
Acknowledgment
The authors thank M. Olivia Kim and J. Andrew McCammon for providing the RESP partial charge data for CB[7] and BZ and Gerhard König for critical reading of the manuscript.
References
- 1. Aguilar B, Anandakrishnan R, Ruscio JZ, Onufriev AV (2010) Statistics and physical origins of pK and ionization state changes upon protein‐ligand binding. Biophys J 98:872–880. [DOI] [PMC free article] [PubMed] [Google Scholar]
- 2. Saga S, Nagata K, Chen WT, Yamada KM (1987) pH‐dependent function, purification, and intracellular location of a major collagen‐binding glycoprotein. J Cell Biol 105:517–527. [DOI] [PMC free article] [PubMed] [Google Scholar]
- 3. Nunez M, Mayo KH, Starbuck C, Lauffenburger D (1993) pH sensitivity of epidermal growth factor receptor complexes. J Cell Biochem 51:312–321. [DOI] [PubMed] [Google Scholar]
- 4. Lahti JL, Lui BH, Beck SE, Lee SS, Ly DP, Longaker MT, Yang GP, Cochran JR (2011) Engineered epidermal growth factor mutants with faster binding on‐rates correlate with enhanced receptor activation. FEBS Lett 585:1135–1139. [DOI] [PMC free article] [PubMed] [Google Scholar]
- 5. Muddana HS, Varnado CD, Bielawski CW, Urbach AR, Isaacs L, Geballe MT, Gilson MK (2012) Blind prediction of host‐guest binding affinities: a new SAMPL3 challenge. J Comput‐Aided Mol Des 26:475–487. [DOI] [PMC free article] [PubMed] [Google Scholar]
- 6. König G, Brooks BR (2012) Predicting binding affinities of host‐guest systems in the SAMPL3 blind challenge: the performance of relative free energy calculations. J Comput‐Aided Mol Des 26:543–550. [DOI] [PMC free article] [PubMed] [Google Scholar]
- 7. Alexov E, Mehler EL, Baker N, Baptista AM, Huang Y, Milletti F, Nielsen JE, Farrell D, Carstensen T, Olsson MHM, Shen JK, Warwicker J, Williams S, Word JM (2011) Progress in the prediction of pKa values in proteins. Proteins Struct Funct Genet 79:3260–3275. [DOI] [PMC free article] [PubMed] [Google Scholar]
- 8. Baptista AM, Teixeira VH, Soares CM (2002) Constant‐pH molecular dynamics using stochastic titration. J Chem Phys 117:4184. [Google Scholar]
- 9. Mongan J, Case DA, McCammon JA (2004) Constant pH molecular dynamics in generalized born implicit solvent. J Comput Chem 25:2038–2048. [DOI] [PubMed] [Google Scholar]
- 10. Mongan J, Case DA (2005) Biomolecular simulations at constant pH. Curr Opin Struct Biol 15:157–163. [DOI] [PubMed] [Google Scholar]
- 11. Dlugosz M, Antosiewicz JM (2004) Constant‐pH molecular dynamics simulations: a test case of succinic acid. Chem Phys 302:161–170. [Google Scholar]
- 12. Dugosz M, Antosiewicz J, Robertson A (2004) Constant‐pH molecular dynamics study of protonation‐structure relationship in a heptapeptide derived from ovomucoid third domain. Phys Rev E Stat Nonlinear Soft Matter Phys 69:021915. [DOI] [PubMed] [Google Scholar]
- 13. Itoh SG, Damjanović A, Brooks BR (2011) pH replica‐exchange method based on discrete protonation states. Proteins Struct Funct Bioinf 79:3420–3436. [DOI] [PMC free article] [PubMed] [Google Scholar]
- 14. Stern HA (2007) Molecular simulation with variable protonation states at constant pH. J Chem Phys 126:164112. [DOI] [PubMed] [Google Scholar]
- 15. Bürgi R, Kollman PA, Van Gunsteren WF (2002) Simulating proteins at constant pH: an approach combining molecular dynamics and Monte Carlo simulation. Proteins Struct Funct Bioinf 47:469–480. [DOI] [PubMed] [Google Scholar]
- 16. Donnini S, Tegeler F, Groenhof G, Grubmüller H (2011) Constant pH molecular dynamics in explicit solvent with λ‐dynamics. J Chem Theory Comput 7:1962–1978. [DOI] [PMC free article] [PubMed] [Google Scholar]
- 17. Goh GB, Knight JL, Brooks CL (2012) Constant pH molecular dynamics simulations of nucleic acids in explicit solvent. J Chem Theory Comput 8:36–46. [DOI] [PMC free article] [PubMed] [Google Scholar]
- 18. Baptista AM, Martel PJ, Petersen SB (1997) Simulation of protein conformational freedom as a function of pH: constant‐pH molecular dynamics using implicit titration. Proteins Struct Funct Genet 27:523–544. [PubMed] [Google Scholar]
- 19. Bennett CH (1976) Efficient estimation of free energy differences from Monte Carlo data. J Comput Phys 22:245–268. [Google Scholar]
- 20. König G, Bruckner S, Boresch S (2009) Unorthodox uses of Bennett's acceptance ratio method. J Comput Chem 30:1712–1718. [DOI] [PubMed] [Google Scholar]
- 21. Lee J, Miller BT, Damjanovic A, Brooks BR (2014) Constant pH molecular dynamics in explicit solvent with enveloping distribution sampling and Hamiltonian exchange. J Chem Theory Comput 10:2738–2750. [DOI] [PMC free article] [PubMed] [Google Scholar]
- 22. Lee J, Miller BT, Damjanovic A, Brooks BR (2015) Enhancing constant‐pH simulation in explicit solvent with a two‐dimensional replica exchange method. J Chem Theory Comput 11:2560–2574. [DOI] [PubMed] [Google Scholar]
- 23. Christ CD, van Gunsteren WF (2007) Enveloping distribution sampling: a method to calculate free energy differences from a single simulation. J Chem Phys 126:184110. [DOI] [PubMed] [Google Scholar]
- 24. Christ CD, van Gunsteren WF (2008) Multiple free energies from a single simulation: extending enveloping distribution sampling to nonoverlapping phase‐space distributions. J Chem Phys 128:174112. [DOI] [PubMed] [Google Scholar]
- 25. Sugita Y, Kitao A, Okamoto Y (2000) Multidimensional replica‐exchange method for free‐energy calculations. J Chem Phys 113:6042. [Google Scholar]
- 26. Fukunishi H, Watanabe O, Takada S (2002) On the Hamiltonian replica exchange method for efficient sampling of biomolecular systems: Application to protein structure prediction. J Chem Phys 116:9058. [Google Scholar]
- 27. Darden T, York D, Pedersen L (1993) Particle mesh Ewald: an N log(N) method for Ewald sums in large systems. J Chem Phys 98:10089. [Google Scholar]
- 28. Wu X, Brooks BR (2005) Isotropic periodic sum: a method for the calculation of long‐range interactions. J Chem Phys 122:044107. [DOI] [PMC free article] [PubMed] [Google Scholar]
- 29. Wu X, Brooks BR (2008) Using the isotropic periodic sum method to calculate long‐range interactions of heterogeneous systems. J Chem Phys 129:154115. [DOI] [PMC free article] [PubMed] [Google Scholar]
- 30. Wu X, Brooks BR (2009) Isotropic periodic sum of electrostatic interactions for polar systems. J Chem Phys 131:024107. [DOI] [PMC free article] [PubMed] [Google Scholar]
- 31. Kim J, Jung I, Kim S, Lee E, Kang J, Sakamoto S, Yamaguchi K, Kim K (2000) New cucurbituril homologues: syntheses, isolation, characterization, and X‐ray crystal structures of cucurbit uril (n = 5, 7, and 8). J Am Chem Soc 122:540–541. [Google Scholar]
- 32. Kim HJ, Jeon WS, Ko YH, Kim K (2002) Inclusion of methylviologen in cucurbit[7]uril. Proc Natl Acad Sci USA 99:5007–5011. [DOI] [PMC free article] [PubMed] [Google Scholar]
- 33. Lee JW, Samal S, Selvapalam N, Kim HJ, Kim K (2003) Cucurbituril homologues and derivatives: new opportunities in supramolecular chemistry. Acc Chem Res 36:621–630. [DOI] [PubMed] [Google Scholar]
- 34. Masson E, Ling X, Joseph R, Kyeremeh‐Mensah L, Lu X (2012) Cucurbituril chemistry: a tale of supramolecular success. RSC Adv 2:1213–1247. [Google Scholar]
- 35. Jang Y, Natarajan R, Ko YH, Kim K (2014) Cucurbit[7]uril: a high‐affinity host for encapsulation of amino saccharides and supramolecular stabilization of their α‐anomers in water. Angew Chem Int Ed 53:1003–1007. [DOI] [PubMed] [Google Scholar]
- 36. Bansal Y, Silakari O (2012) The therapeutic journey of benzimidazoles: a review. Bioorg Med Chem 20:6208–6236. [DOI] [PubMed] [Google Scholar]
- 37. Koner AL, Ghosh I, Saleh N, Nau WM (2011) Supramolecular encapsulation of benzimidazole‐derived drugs by cucurbit[7]uril. Can J Chem 89:139–147. [Google Scholar]
- 38. Lee MS, Salsbury FR, Brooks CL (2004) Constant‐pH molecular dynamics using continuous titration coordinates. Proteins Struct Funct Bioinf 56:738–752. [DOI] [PubMed] [Google Scholar]
- 39. Machuqueiro M, Baptista AM (2011) Is the prediction of pKa values by constant‐pH molecular dynamics being hindered by inherited problems? Proteins Struct Funct Bioinf 79:3437–3447. [DOI] [PubMed] [Google Scholar]
- 40. König G, Miller BT, Boresch S, Wu X, Brooks BR (2012) Enhanced sampling in free energy calculations: combining SGLD with the Bennetts acceptance ratio and enveloping distribution sampling methods. J Chem Theory Comput 8:3650–3662. [DOI] [PMC free article] [PubMed] [Google Scholar]
- 41. König G, Boresch S (2011) Non‐Boltzmann sampling and Bennett's acceptance ratio method: how to profit from bending the rules. J Comput Chem 32:1082–1090. [DOI] [PubMed] [Google Scholar]
- 42. König G, Hudson PS, Boresch S, Woodcock HL (2014) Multiscale free energy simulations: an efficient method for connecting classical MD simulations to QM or QM/MM free energies using non‐Boltzmann Bennett reweighting schemes. J Chem Theory Comput 10:1406–1419. [DOI] [PMC free article] [PubMed] [Google Scholar]
- 43. Boresch S, Tettinger F, Leitgeb M, Karplus M (2003) Absolute binding free energies: quantitative approach for their calculation. J Phys Chem B 107:9535–9551. [Google Scholar]
- 44. Tanford C (1970) Protein denaturation. Part C. Theoretical models for the mechanism of denaturation. Adv Protein Chem 24:1–95. [PubMed] [Google Scholar]
- 45. Wyman J, Gill S (1990) Binding and linkage: functional chemistry of biological macromolecules. Mill Valley, CA: University Science Books. [Google Scholar]
- 46. Yang A, Honig B (1993) On the pH dependence of protein stability. J Mol Biol 231:459–474. [DOI] [PubMed] [Google Scholar]
- 47. Mason AC, Jensen JH (2008) Protein–protein binding is often associated with changes in protonation state. Proteins Struct Funct Bioinf 71:81–91. [DOI] [PubMed] [Google Scholar]
- 48. Vanommeslaeghe K, MacKerell AD (2012) Automation of the CHARMM general force field (CGenFF) I: bond perception and atom typing. J Chem Inf Model 52:3144–3154. [DOI] [PMC free article] [PubMed] [Google Scholar]
- 49. Vanommeslaeghe K, Raman EP, MacKerell AD (2012) Automation of the CHARMM general force field (CGenFF) II: assignment of bonded parameters and partial atomic charges. J Chem Inf Model 52:3155–3168. [DOI] [PMC free article] [PubMed] [Google Scholar]
- 50. Miller BT, Singh RP, Klauda JB, Hodoscek M, Brooks BR, Woodcock HL (2008) CHARMMing: a new, flexible web portal for CHARMM. J Chem Inf Model 48:1920–1929. [DOI] [PMC free article] [PubMed] [Google Scholar]
- 51. Chu JW, Trout BL, Brooks BR (2003) A super‐linear minimization scheme for the nudged elastic band method. J Chem Phys 119:12708. [Google Scholar]
- 52. Feller SE, Zhang Y, Pastor RW, Brooks BR (1995) Constant pressure molecular dynamics simulation: the Langevin piston method. J Chem Phys 103:4613. [Google Scholar]
- 53. Nose S (1984) A unified formulation of the constant temperature molecular dynamics methods. J Chem Phys 81:511. [Google Scholar]
- 54. Brooks BR, Brooks CL, Mackerell AD, Nilsson L, Petrella RJ, Roux B, Won Y, Archontis G, Bartels C, Boresch S, Caflisch A, Caves L, Cui Q, Dinner AR, Feig M, Fischer S, Gao J, Hodoscek M, Im W, Kuczera K, Lazaridis T, Ma J, Ovchinnikov V, Paci E, Pastor RW, Post CB, Pu JZ, Schaefer M, Tidor B, Venable RM, Woodcock HL, Wu X, Yang W, York DM, Karplus M (2009) CHARMM: the biomolecular simulation program. J Comput Chem 30:1545–1614. [DOI] [PMC free article] [PubMed] [Google Scholar]
- 55. Woodcock HL, Miller BT, Hodoscek M, Okur A, Larkin JD, Ponder JW, Brooks BR (2011) MSCALE: a general utility for multiscale modeling. J Chem Theory Comput 7:1208–1219. [DOI] [PMC free article] [PubMed] [Google Scholar]
- 56. Bayly CCI, Cieplak P, Cornell WD, Kollman PA (1993) A well‐behaved electrostatic potential based method using charge restraints for deriving atomic charges: the RESP model. J Phys Chem 97: 10269–10280. ( [Google Scholar]
- 57. Kim MO, Blachly PG, Kaus JW, McCammon JA (2014) Protocols utilizing constant pH molecular dynamics to compute pH‐dependent binding free energies. J Chem Phys B 119:861–872. [DOI] [PMC free article] [PubMed] [Google Scholar]
- 58. Hummer G, Pratt LR, Garcia AE (1995) On the free energy of ionic hydration. J Phys Chem 100:1207. [Google Scholar]
- 59. Figueirido F, Buono GSD, Levy RM (1997) On finite‐size corrections to the free energy of ionic hydration. J Phys Chem B 101:5622–5623. [Google Scholar]
- 60. Sakane S, Ashbaugh HS, Wood RH (1998) Continuum corrections to the polarization and thermodynamic properties of Ewald sum simulations for ions and ion pairs at infinite dilution. J Phys Chem B 102:5673–5682. [Google Scholar]
- 61. Bogusz S, Cheatham TE, Brooks BR (1998) Removal of pressure and free energy artifacts in charged periodic systems via net charge corrections to the Ewald potential. J Chem Phys 108:7070–7084. [Google Scholar]
- 62. Boresch S, Ringhofer S, Höchtl P, Steinhauser O (1999) Towards a better description and understanding of biomolecular solvation. Biophys Chem 78:43–68. [DOI] [PubMed] [Google Scholar]
- 63. Lin YL, Aleksandrov A, Simonson T, Roux B (2014) An overview of electrostatic free energy computations for solutions and proteins. J Chem Theory Comput 10:2690–2709. [DOI] [PubMed] [Google Scholar]
- 64. Onufriev A, Bashford D, Case DA (2004) Exploring protein native states and large‐scale conformational changes with a modified generalized Born model. Proteins Struct Funct Genet 55:383–394. [DOI] [PubMed] [Google Scholar]
- 65. Yu H, Whitfield TW, Harder E, Lamoureux G, Vorobyov I, Anisimov VM, MacKerell AD, Roux B (2010) Simulating monovalent and divalent ions in aqueous solution using a drude polarizable force field. J Chem Theory Comput 6:774–786. [DOI] [PMC free article] [PubMed] [Google Scholar]
- 66. Simmonett AC, Pickard FC, Schaefer HF, Brooks BR (2014) An efficient algorithm for multipole energies and derivatives based on spherical harmonics and extensions to particle mesh Ewald. J Chem Phys 140:184101. [DOI] [PMC free article] [PubMed] [Google Scholar]
- 67. Fenley AT, Henriksen NM, Muddana HS, Gilson MK (2014) Bridging calorimetry and simulation through precise calculations of cucurbituril guestibinding enthalpies. J Chem Theory Comput 10:4069–4078. [DOI] [PMC free article] [PubMed] [Google Scholar]
- 68. Takahashi KZ, Narumi T, Yasuoka K (2011) Cutoff radius effect of the isotropic periodic sum and Wolf method in liquid–vapor interfaces of water. J Chem Phys 134:174112. [DOI] [PubMed] [Google Scholar]
- 69. Ojeda‐May P, Pu J (2014) Isotropic periodic sum treatment of long‐range electrostatic interactions in combined quantum mechanical and molecular mechanical calculations. J Chem Theory Comput 10:134–145. [DOI] [PubMed] [Google Scholar]
- 70. König G, Pickard FC, Mei Y, Brooks BR (2014) Predicting hydration free energies with a hybrid QM/MM approach: an evaluation of implicit and explicit solvation models in SAMPL4. J Comput‐Aided Mol Des 28:245–257. [DOI] [PMC free article] [PubMed] [Google Scholar]
Associated Data
This section collects any data citations, data availability statements, or supplementary materials included in this article.
Supplementary Materials
Supporting Information


