

Abstract
Plasminogen activator inhibitor‐1 (PAI‐1) is a biologically important serine protease inhibitor (serpin) that, when overexpressed, is associated with a high risk for cardiovascular disease and cancer metastasis. Several of its ligands, including vitronectin, tissue‐type and urokinase‐type plasminogen activator (tPA, uPA), affect the fate of PAI‐1. Here, we measured changes in the solvent accessibility and dynamics of an important unresolved functional region, the reactive center loop (RCL), upon binding of these ligands. Binding of the catalytically inactive S195A variant of tPA to the RCL causes an increase in fluorescence, indicating greater solvent protection, at its C‐terminus, while mobility along the loop remains relatively unchanged. In contrast, a fluorescence increase and large decrease in mobility at the N‐terminal RCL is observed upon binding of S195A‐uPA to PAI‐1. At a site distant from the RCL, binding of vitronectin results in a modest decrease in fluorescence at its proximal end without restricting overall loop dynamics. These results provide the new evidence for ligand effects on RCL conformation and dynamics and differences in the Michaelis complex with plasminogen activators that can be used for the development of more specific inhibitors to PAI‐1. This study is also the first to use electron paramagnetic resonance (EPR) spectroscopy to investigate PAI‐1 dynamics.
Significance: Balanced blood homeostasis and controlled cell migration requires coordination between serine proteases, serpins, and cofactors. These ligands form noncovalent complexes, which influence the outcome of protease inhibition and associated physiological processes. This study reveals differences in binding via changes in solvent accessibility and dynamics within these complexes that can be exploited to develop more specific drugs in the treatment of diseases associated with unbalanced serpin activity.
Keywords: plasminogen activator inhibitor‐1 (PAI‐1), reactive center loop (RCL), tissue plasminogen activator (tPA), urokinase plasminogen activator (uPA), vitronectin, serpin, fluorescence, electron paramagnetic resonance (EPR)
Abbreviations
- DTT
dithiothreitol
- EPR
electron paramagnetic resonance
- ki
second‐order rate of inhibition
- klim
limiting rate of insertion
- MTSL
2,5‐dihydro‐2,2,5,5‐tetramethyl‐3‐[[(methylsulfonyl)thio]methyl]‐1H‐pyrrol‐1‐yloxy
- NBD
N,N′‐dimethyl‐N‐(iodoacetyl)‐N′‐(7‐nitrobenz‐2‐oxa‐1,3‐diazol‐4‐yl)ethylenediamine
- PAI‐1
plasminogen activator inhibitor‐1
- RCL
reactive center loop
- Serpin
serine protease inhibitor
- SMB
somatomedin B domain
- t½
half‐life
- tPA
tissue plasminogen activator
- uPA
urokinase plasminogen activator
- uPAR
urokinase plasminogen activator receptor
- δ
linewidth
- τc
rotational correlation time
Introduction
Plasminogen activator inhibitor‐1 (PAI‐1) is a multi‐specific inhibitor of tissue‐type and urokinase‐type plasminogen activators (tPA, uPA) with anti‐fibrinolytic, pro‐ and anti‐adhesive, and pro‐inflammatory properties.1, 2, 3, 4, 5 PAI‐1 slows fibrin clot lysis by inhibiting plasminogen activators at rates approaching the diffusion limit (k i = 106 to 107 M−1 s−1).6 Consequently, too much PAI‐1 can lead to thrombotic states in which excessive fibrin accumulates, potentially blocking blood vessels and disrupting oxygen supply to tissues, whereas too little PAI‐1 can lead to hyperfibrinolytic or mild bleeding states.7 Thereby, PAI‐1 is an important risk factor in the development of cardiovascular disease.8, 9, 10, 11
Plasminogen activation via tPA and uPA plays a significant role in cancer metastasis by leading to basement membrane degradation and facilitating cell invasion into the bloodstream.12, 13, 14, 15, 16, 17, 18 PAI‐1 may appropriately be expected to halt this damage, but, paradoxically, contributes to the severity of metastasis, presumably by competing with cell surface receptors (e.g. integrins, uPA receptor) for its cofactor vitronectin.19, 20, 21, 22 Thus, PAI‐1 is increasingly being used as a poor prognostic biomarker in these situations. Also, as its cofactor, vitronectin stabilizes PAI‐1 in its active state to prolong its diverse functions.23
Since it is an important risk factor in cardiovascular disease and biomarker for several cancers, PAI‐1 is an attractive target in the prevention or treatment of these diseases. Yet, despite its extensive study, no PAI‐1 inhibitor has been approved for clinical trials, underscoring the importance of further studies into its biology and interactions.24 In this study, we examine the effects of ligand binding to PAI‐1 on its reactive center loop (RCL), which is functionally important for protease inhibition and its self‐inactivation. The RCL contains the pseudo‐substrate for target serine proteases, and its insertion into the central β‐sheet of PAI‐1 is the defining feature in the unusual mechanism for protease inactivation, which involves a dramatic rearrangement of structure and translocation of the target protease, bound via a covalent acyl bond, from one pole of the serpin to the other. Furthermore, the orientation of the RCL is critical, as its exposure or burial determines whether PAI‐1 is active or inactive (latent). However, the extensive structural biology approaches that have been used with PAI‐1, including crystallography, molecular dynamics, and hydrogen‐deuterium exchange, provide an incomplete view of the RCL, as it is either unresolved or resides in several different apparent conformations in the structures to date.25, 26, 27, 28, 29, 30, 31, 32, 33 This is not surprising, since the loop is surface exposed and inherently flexible, but the lack of more detailed information limits structure‐based approaches to drug design targeting this region. Of particular interest would be greater insight into differences between the PAI‐1‐tPA and PAI‐1‐uPA Michaelis complexes, which can be exploited to specifically inhibit either interaction.25, 26 Differences determined for the Michaelis encounter complexes could also explain interesting differences in the kinetics of inhibition of the two proteases by PAI‐1, including the faster limiting rate of RCL insertion (k lim) in the presence of uPA than tPA, despite similar second order rates of inhibition (k i).34, 35, 36, 37 Also, although conformational effects of vitronectin binding to PAI‐1 on its RCL have been documented,38, 39 the effects on dynamics in this region remain undetermined.
We thereby probed single positions from P13 to P5′ with the fluorescent NBD and paramagnetic MTSL probes to obtain information about RCL conformation and dynamics, respectively, upon binding of plasminogen activators and vitronectin. [RCL residues are designated by their position P and distance from the P1‐P1′ scissile bond, with C‐terminal residues indicated by a prime (′)]. These experiments are aimed at identifying different modes of binding to the target proteases and also can reveal the extent to which RCL orientation and dynamics can be influenced upon vitronectin binding at a remote site. Our study is the first to employ spin‐labeling and paramagnetic resonance to investigate structural features and RCL dynamics in PAI‐1. Also, while the structure of its encounter complex between uPA and has been available for some time [Fig. 1(B)], the structure of PAI‐1 in complex with tPA has only recently been determined [Fig. 1(A)],25 and our study provides significant contributions as it compares and contrasts the contact surfaces between the inhibitor and plasminogen activators using solution‐based methods.
Figure 1.
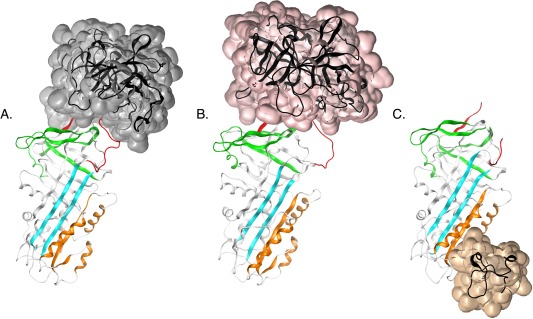
PAI‐1 complexes with tPA, uPA, and vitronectin. The serine protease domain of A) S195A‐tPA (transparent surface, gray) [PDB: 5BRR25], B) S195A‐uPA (transparent surface, pink) [PDB: 3PB126]. and C) the SMB domain of vitronectin (transparent surface, auburn) are shown bound to PAI‐1 [PDB: 1OC027]. Important functional regions in protease inhibition and latency transition, including the RCL (red), gate (green), shutter (cyan), and flexible joint regions (orange), are also indicated.
Results
Inactive (S195A) plasminogen activators differentially affect the proximal and distal regions of the RCL
We created single cysteines along the length of the RCL, and conjugated the side‐chain sulfhydryls to NBD or MTSL probes. Since serpins employ a conformation‐based inhibitory mechanism, the half‐life of PAI‐1 is an important measure of correct folding. As shown in Table 1, labeled proteins exhibit small increases in half‐life compared with wild type (wt), indicating that the overall fold of PAI‐1 is not significantly affected by cysteine substitution and labeling. Table 1 also lists relative amounts of inhibitor, substrate, and latent forms of PAI‐1 that exist for each of the variants generated. The amount of active inhibitor relative to substrate form varies somewhat among the PAI‐1 variants, consistent with other mutagenesis studies, although these changes are modest. We observe similar substrate formation for our single‐cysteine mutant proteins compared with wild type protein, except for PAI‐1 mutated at the P13 position of the RCL. Although this mutation increases substrate formation, labeling of the P13 residue does not affect protein stability (unlabeled t ½ = labeled t ½ ≈ 1.1 h.).
Table 1.
Characterization of PAI‐1 Variants with Single Cysteine Substitutions in the RCL
| RCL position | Residue | Inhibitora | Substrateb | Latentb | Substrate: inhibitord | Substrate PAI‐1cys: wte | Half‐life (hr)f | |
|---|---|---|---|---|---|---|---|---|
| wt‐PAI‐1 | n. a. | n. a. | 80c | 7 ± 2 | 13 ± 1 | 0.1 | n. a. | 1.2 ± 0.1 |
| P13 | V334 | 68 ±14 | 28 ± 2 | 4 ± 1 | 0.4 | 3.9 | 1.1 ± 0.1 | |
| P12 | A335 | 75 ± 9 | 7 ± 2 | 18 ± 2 | 0.1 | 1.0 | 1.2 ± 0.03 | |
| P11 | S336 | 78 ± 46 | 18 ± 1 | 5 ± 1 | 0.2 | 2.4 | 1.5 ± 0.1 | |
| P9 | S338 | 78 ± 7 | 17 ± 1 | 6 ± 0.4 | 0.2 | 2.3 | 1.7 ± 0.1 | |
| P8 | T339 | 73 ± 18 | 17 ± 2 | 10 ± 0.3 | 0.2 | 2.4 | 2.7 ± 0.1 | |
| P6 | V341 | 83 ± 29 | 12 ± 1 | 5 ± 1 | 0.1 | 1.7 | 2.6 ± 0.1 | |
| P5 | I342 | 89 ± 11 | 7 ± 1 | 4 ± 0.2 | 0.1 | 0.9 | 2.3 ± 0.1 | |
| P3 | S344 | 70 ± 24 | 15 ± 3 | 15 ± 10 | 0.2 | 2.0 | 1.8 ± 0.04 | |
| P1′ | M347 | 84 ± 19 | 11 ± 1 | 5 ± 1 | 0.1 | 1.5 | 1.8 ± 0.1 | |
| P2′ | A348 | 80 ± 18 | 8 ± 3 | 12 ± 1 | 0.1 | 1.1 | 1.3 ± 0.1 | |
| P3′ | P349 | 87 ± 28 | 9 ± 4 | 4 ± 1 | 0.1 | 1.3 | 1.6 ± 0.03 | |
| P4′ | E350 | 71 ± 15 | 9 ± 1 | 20 ± 10 | 0.1 | 1.2 | 1.6 ± 0.1 | |
| P5′ | E351 | 84 ± 8 | 12 ± 4 | 4 ± 1 | 0.1 | 1.6 | 1.7 ± 0.1 |
Percentage based on amount required to fully inhibit tPA upon titration with varying concentrations of unlabeled PAI‐1 as detected by chromogenic assay.
Percentage based on densitometry to quantify reaction products separated by SDS‐PAGE with Coomassie Blue staining on a 1:1 mixture of unlabeled PAI‐1 and tPA.
Estimated percentage based on densitometry to quantify reaction products separated by SDS‐PAGE with Coomassie Blue staining on a 1:1 mixture of wild‐type (wt) PAI‐1 and tPA.
Ratio comparing the percentage of substrate form quantified by densitometry in SDS‐PAGE analysis of a 1:1 PAI‐1:tPA mixture relative to the percentage of active form detected from a chromogenic assay.
Ratio comparing the percentage of substrate formed for the single cysteine PAI‐1 variant relative to wt‐PAI‐1 from densitometry in SDS‐PAGE analysis of 1:1 PAI‐1:tPA reaction mixtures.
Determined by incubation of PAI‐1 at 37°C and measuring inhibition of tPA activity over time by wild‐type (wt) PAI‐1 or PAI‐1 variants labeled with the NBD probe. These values for half lives of the PAI‐1 variants are reported in Qureshi, T. and Peterson, C. B. In this issue; pages 487‐498.
We then measured changes that occurred in the RCL upon formation of the noncovalent Michaelis complex with catalytically inactive (S195A) plasminogen activators. The NBD probe was chosen for its enhanced, blue‐shifted and reduced, red‐shifted fluorescence in hydrophobic and hydrophilic environments, respectively. As the plasminogen activators bind PAI‐1 at the RCL [Fig. 1(A,B)], increases in NBD fluorescence can provide information about the burial of hydrophobic surfaces due to binding. Our approach in targeting a broad span of positions within the RCL also has the potential to reveal important exosite interactions, which are defined as interactions outside the serpin P4‐P3′ residues and the S4‐S3′ specificity pockets of the protease active site.
Equimolar S195A‐tPA and S195A‐uPA were added to NBD‐labeled PAI‐1, and the changes in fluorescence recorded [Fig. 2(A,B)]. The resulting fluorescence changes at the RCL are large (up to 275%) for plasminogen activators bound to PAI‐1. In the immediate vicinity of the scissile bond, a decrease in fluorescence is observed at P1′ and/or P2′ positions in the presence of both plasminogen activators. A previous report showed that introduction of NBD at the P1′ position reduced the affinity of tPA for PAI‐1, indicating that introduction of the probe at the active site interferes with the interaction.40 The observed fluorescence decrease at the P1′‐P2′ is thereby consistent with the expulsion of the probe from the active site, leading to its greater solvent exposure. The same study also demonstrated that the probe at a position outside the active site (i.e. P9) does not interfere with plasminogen activator binding. The NBD probe at the P4′ and P5′ positions in the serpin exosite exhibits opposite fluorescence changes upon plasminogen activator binding. At the P4′ position, a ∼23% increase in the presence of S195A‐tPA and a ∼25% decrease in fluorescence upon S195A‐uPA binding is observed. Similarly, a ∼110% increase and ∼1% decrease in fluorescence is observed in the presence of S195A‐tPA and S195A‐uPA, respectively, at the P5′ position. Notably, the overall change in fluorescence is greater at the C‐ and N‐terminal RCL for S195A‐tPA and S195A‐uPA, respectively, with the greatest difference between the two occurring at P5′ (∼110% increase) for S195A‐tPA and positions P9‐P6 (∼211–275% increase) for S195A‐uPA. Binding of the two proteases to form the encounter complexes clearly occurs through different interaction surfaces in the vicinity of the scissile bond and via exosite interactions.
Figure 2.
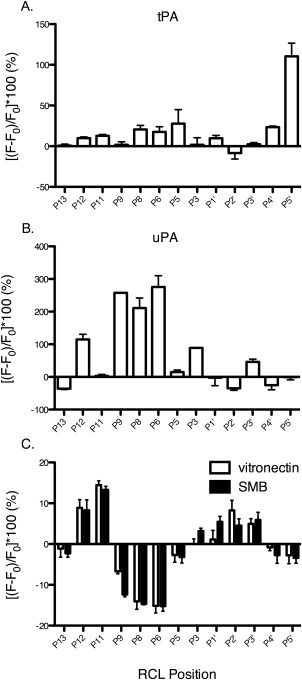
Changes in solvent exposure of the RCL due to binding of PAI‐1 ligands. 0.5 µM NBD‐PAI‐1 was added to A) 0.5 µM S195A‐tPA, B) 0.5 µM S195A‐uPA, or C) 2 μM vitronectin or SMB at ambient temperature in PBS (137 mM NaCl, 2.7 mM KCl, 10 mM NaH2PO4, 1.8 mM KH2PO4, pH 7.4). Samples were excited at 480 nm and the emission at 530 nm collected. Results are normalized to NBD‐PAI‐1 alone to obtain the percent change in fluorescence [(F − F 0/F 0) × 100] at the RCL upon ligand binding. All experiments were performed in triplicate and error bars plotted as standard deviations.
RCL dynamics in the michaelis complex are affected by uPA, but not tPA, binding
As an alternative inhibition strategy to structure‐based design, targeting protein dynamics has the potential to enhance specificity for a desired target.41, 42, 43 To obtain information about RCL dynamics, the MTSL probe was chosen, which carries an unpaired electron that, when placed in a magnetic field, resonates by absorption of microwave energy equal in energy to the difference in its electronic states.44 The magnetic field is swept at a constant frequency, from which the first derivative of the absorption spectra is obtained. The linewidths (δ) of the resulting spectra provide information on nanosecond dynamics, and depend on the rotational correlation time, τ c, which is the time it takes the spin‐label side chain to rotate 1 radian. Sharper and broader linewidths, corresponding to larger and smaller inverse linewidths (δ −1), thereby indicate greater and restricted motion, respectively.
Inactive S195A‐plasminogen activators were bound to MTSL‐labeled PAI‐1 and the EPR spectra collected. Representative spectra for MTSL at the P9 and P1′ positions of PAI‐1 in the absence and presence of these ligands are shown [Fig. 3(A,B)]. In most cases, the high‐field peak has a sharp shoulder resulting from an equilibrium between more than one conformation, most likely active and latent PAI‐1.45 At the P9 position [Fig. 3(A)], the low‐ and high‐field resonance peaks are significantly broadened and disappear in the presence of S195A‐uPA, possibly due to anisotropic interactions, or weak hyperfine interactions of the unpaired electron with the more distant nitrogen nucleus of the probe. Analysis of the center‐field peak linewidth for MTSL‐PAI‐1 indicates further changes in the motional dynamics of the RCL. In Figure 4, the change in the inverse linewidth of the center peak, or mobility (ΔM s), is plotted with respect to RCL position. These results reveal that binding of S195A‐tPA does not significantly affect the mobility, or dynamics, of the RCL. In contrast, the mobility of the RCL is considerably restricted, specifically at the N‐terminal P11‐P5 positions, in the presence of S195A‐uPA.
Figure 3.
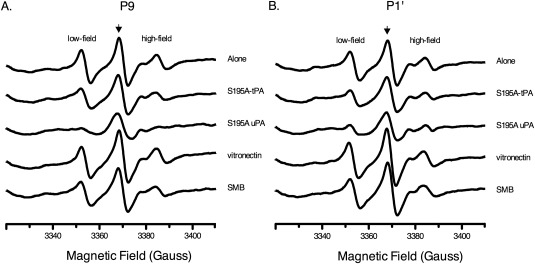
EPR spectra of MTSL‐PAI‐1 in presence of ligands. 2 µM MTSL‐PAI‐1 was added to equimolar S195A‐tPA or 8 µM S195A‐uPA, vitronectin, or SMB in PBS (137 mM NaCl, 2.7 mM KCl, 10 mM NaH2PO4, 1.8 mM KH2PO4, pH 7.4) at ambient temperature. EPR spectra from 3310‐3410 gauss were collected at a constant frequency of ∼9.45 GHz. The resulting spectra for representative RCL positions at A) P9 and B) P1′ are shown. The center‐field peak is indicated by an arrow.
Figure 4.
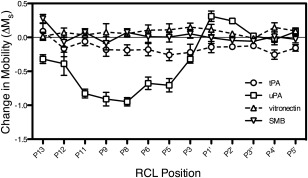
Changes in RCL dynamics due to ligand binding. The inverse linewidths (δ −1) of the central peak from the EPR spectra (c.f. Fig. 3) were obtained, scaled (see Methods), and normalized with respect to PAI‐1 alone to determine changes in RCL mobility (ΔM s). All experiments were performed in triplicate and plotted with standard deviation error bars.
Vitronectin and SMB binding exert similar effects on the RCL
As its cofactor, vitronectin significantly affects PAI‐1 activity in a fashion that can be pinpointed along the mechanism pathway for protease inhibition.36, 37 In particular, vitronectin binding affects the rate of RCL insertion upon protease inactivation, with distinct differences in this limiting rate comparing tPA and uPA.36, 37 We thereby measured the impact of vitronectin binding PAI‐1 at the flexible joint region on the solvent accessibility and dynamics of the RCL. As expected from binding at a distant region [Fig. 1(C)], vitronectin induces modest albeit notable changes in fluorescence at the RCL [Fig. 2(C)]. Residues about the scissile bond (P5‐P5′) show less than 10% change in fluorescence due to vitronectin binding. Interacting with vitronectin also leads to a ∼10% increase in fluorescence at P12‐P11 positions, indicating a more hydrophobic environment for these residues. Larger changes occur at residues P9‐P6, which exhibit a ∼7 to 15% fluorescence decrease, indicating greater solvent exposure at these positions. The SMB truncation of vitronectin, which houses the primary binding site for PAI‐1, elicits similar effects to full‐length vitronectin, indicating that these results are largely due to binding at this high affinity site. Although there are some effects on “conformation” or solvent exposure, vitronectin and its SMB domain do not appear to elicit significant effects on RCL dynamics (Figs. 3 and 4).
Discussion
PAI‐1 employs its RCL to bait and inhibit target proteases, or self‐inactivate by adopting an RCL‐inserted latent conformation. The fate of PA1‐1 is influenced by formation of noncovalent complexes with its ligands. In circulation, PAI‐1 encounters vitronectin, which localizes it to clot sites where it primarily inhibits tPA to control fibrinolysis. In the extracellular milieu, PAI‐1 can compete with uPAR and integrins for binding to vitronectin, and/or encounter and inhibit uPA, which affects pericellular proteolysis and cell migration. Under equilibrium conditions in vitro, we uncovered several differences in the RCL in these encounter complexes with PAI‐1, which we accomplished by labeling single positions along the loop with NBD and MTSL probes.
Using fluorescence and EPR, we measured changes in the conformation and dynamics along the RCL due to complex formation with PAI‐1. We found that stabilization of PAI‐1 by binding of vitronectin involves changes in the RCL that permit partial insertion of the P12‐P11 residues at the hinge, but disfavor full insertion by increasing the solvent exposure of residues at the P9‐P6 positions [Fig. 2(C)]. These data provide additional evidence that VN‐mediated stabilization of PAI‐1 is not solely via steric effects on the shutter region in preventing RCL insertion [Fig. 1(C)].38, 39 Also, these results imply that destabilizing the P9‐P6 region of the RCL is a potential strategy to inactivate PAI‐1 when its high circulating levels are harmful.
In a previous study, we probed effects of vitronectin binding at only two sites (P9 and P1′) in the RCL, and observed similar small changes in the solvent exposure.38 We were surprised to observe that the degree of exposure/burial reported for these particular residues in our previous work differ somewhat compared with our present study [Fig. 2(C)], likely reflecting specific effects of buffers and/or pH. Indeed, recent work from our laboratory using hydrogen‐deuterium exchange methods has demonstrated that buffers have markedly different effects on protein flexibility at specific loci within PAI‐1 (manuscript in preparation). Although there are subtle differences in the specific results, the overall conclusion remains the same: vitronectin affects the conformation of the RCL and increases its solvent accessibility. Also, while conformational effects are observed, interaction with vitronectin does not restrict the overall dynamics of the RCL (Fig. 4), maintaining RCL flexibility that is key to its interaction and inactivation of multiple protease targets.
With respect to plasminogen activators, several lines of evidence have suggested similar Michaelis complexes between the two with PAI‐1. For instance, the difference in ki comparing tPA and uPA inhibition by PAI‐1 is small compared with that of the serine proteases, thrombin and plasmin.46 Also, both plasminogen activators share considerable structural similarity (RMSD ∼1.9 Å) and characteristic features of their serine protease domains, including a catalytic triad, several activation loops, and many variable loops (37‐, 60‐, 97‐, and 186‐loops).47 The differences that do exist between the two are mainly in the variable loops, with tPA containing a longer and more positive 37‐loop, a 97‐loop that protrudes less from the domain scaffold, and a much shorter 186‐loop than that of uPA. While the crystal structure of the PAI‐1‐uPA Michaelis complex shows involvement of the variable loops in exosite interactions with PAI‐1, some notable differences have been revealed with the recent solution of the PAI‐1‐tPA Michaelis complex by x‐ray crystallography.25 The contacts between the protease and inhibitor encompass more inaccessible surface area in the PAI‐1‐tPA structure than the PAI‐1‐uPA structure, with residues from the 60‐loop, the147‐loop, and the 169‐loop all contributing to extensive exosite interactions with PAI‐1.25 In addition to the details that have emerged recently from the crystallographic work, several experimental approaches support an important role for the exosite involving interactions of the 37‐loop and the P4′‐P5′ residues of PAI‐1.26, 35, 36, 48, 49 Such exosite interactions increase serpin‐protease specificity and binding affinities, but must be released upon scissile bond cleavage for fast RCL insertion.50
Our fluorescence and EPR data reveal additional noteworthy differences in the Michaelis complexes of PAI‐1 with its target proteases [Figs. 2(A,B) and Fig. 4]. We found that S195A‐tPA interacts strongly at the C‐terminal P5′ position [Fig. 2(A)], likely due to the aforementioned exosite interaction with the 37‐loop, while RCL nanosecond dynamics in this complex are retained (Fig. 4). Also, the large difference in fluorescence changes at the P4′‐P5′ positions in the presence of inactive plasminogen activators is consistent with this exosite interaction being more important for tPA than uPA [Fig. 2(A,B)]35 and with the more extensive interface at the 37‐loop of tPA compared with uPA.25 In sharp contrast, S195A‐uPA interacts strongly with the N‐terminal RCL [Fig. 2(B)], which significantly restricts mobility at this end of the loop (Fig. 4). Specifically, the significant increase in fluorescence at the P9‐P6 positions in the Michaelis complex with uPA reveals a new, previously undefined exosite. For the first time, we report evidence from solution‐based experiments that plasminogen activators rest differently on the serpin “top,” employing distinct exosite interactions and mobility constraints on the RCL in the Michaelis complex. These results are timely and complement the crystallography results that outline different positions of the RCL in the two Michaelis complexes. Likewise, the different dynamics observed from EPR measurements in the two complexes are consistent with differences in loop conformations comparing the uPA‐PAI‐1 structure26 with the tPA‐PAI‐1 structure.25 Furthermore, our results provide a simple explanation for the difference in k lim for PAI‐1 with plasminogen activators (k lim is a complex kinetic term that mathematically describes the various factors that affect RCL insertion, including rates of reversible acylation and displacement of the P′‐side of the RCL from the protease exosite).36, 37 Upon uPA docking in the Michaelis complex, the N‐terminal RCL becomes immobilized. We hypothesize this restriction mediates direct RCL incorporation into the central β‐sheet, resulting in its faster insertion in the presence of uPA compared with tPA.
The analysis of the crystal structure of the PAI‐1‐uPA Michaelis complex suggests that the P15‐P6 RCL residues are mobile based on their average temperature (B) factor,26 and the inferred high flexibility of the N‐terminal RCL in the crystal has been used to explain its rapid insertion after cleavage. These observations are seemingly in contrast to our EPR results and hypothesis for uPA‐directed fast RCL insertion. However, there are important differences between these experiments, including the obvious challenge of comparing solution‐based experiments with observations in the crystal. For instance, the RCL of stable PAI‐1 in the absence of ligands adopts an extended conformation in its crystal structures, while solution evidence indicates close tethering of the loop to the body of the serpin.31, 51 Perhaps more significant is the need to consider the timescale and theoretical basis for EPR results, which provide information on nanosecond dynamics related to rotational correlation times, versus the crystallographic B‐factor, which is derived from the distribution of electron density that is spread out and indicates vibrational motion. Finally, the particular form of PAI‐1 used for crystallography (i.e. 14‐1B PAI‐1) contains four mutations in the core of the protein, while the proteins used for EPR contain only a single mutation at the site where the EPR probe is attached. Indeed, the quadruple mutations cause the k lim in the presence of both plasminogen activators to be much slower for 14‐1B than native PAI‐1, and exhibit opposite results in the presence of vitronectin.36, 37 These key factors likely account for the reported differences.
Interestingly, residues at the P8‐P4 positions form a kink in the RCL of the crystal structure for the 14‐1B‐tPA Michael complex (26), but not in the 14‐1B‐uPA structure.26 In terms of NBD fluorescence, kink formation is predicted to push RCL residue side‐chains towards the hydrophilic solvent, resulting in a decrease in fluorescence, as is observed at proximal RCL positions in the presence of vitronectin, but not plasminogen activators (Fig. 2). This and other evidence suggests an interesting hypothesis—the formation of a kink in the proximal RCL may slow its insertion (i.e. decrease k lim or k latency) and vitronectin induces a kink in the RCL of native, but not 14‐1B, PAI‐1 in its complex with plasminogen activators. Although this is clearly speculative, this idea could account for (1) the slower k latency of native PAI‐1 in the presence of vitronectin, (2) the slower k lim of 14‐1B PAI‐1 in the presence of tPA compared with uPA, (3) the slower k lim in the presence of tPA for the stable 14‐1B mutant relative to native PAI‐1, and (4) the increase and decrease in k lim for native and 14‐1B PAI‐1, respectively, for the reaction of PAI‐1 bound to vitronectin with plasminogen activators.2, 25, 26, 37 The increased fluorescence at the proximal RCL in the presence of both plasminogen activators [Fig. 2(A,B)] may also indicate that the kink in the RCL in native PAI‐1 is relieved in the encounter complexes, leading to the faster k lim for native PAI‐1 compared with the 14‐1B “stable” mutant of PAI‐1.
We conclude that interactions of PAI‐1 with plasminogen activators and vitronectin induce changes in the conformation and dynamics of the RCL, providing insight that should be beneficial for the development of more specific drugs that aim to inhibit PAI‐1 and its encounter complexes. Directing inhibitors toward a single PAI‐1‐plasminogen activator interaction without interfering with other serpin‐protease interactions is desirable. More specific inhibitors should lead to increased efficacy and decreased undesirable side effects of such drugs. Also, PAI‐1 has many important physiological roles, and thus it is important not to block its beneficial functions.24 For example, it can be important to differentially target tPA and uPA as thrombolytics. In acute ischemic stroke, neurotoxicity caused by blood‐brain barrier permeability resulting from the prolonged presence of tPA can be countered by uPA, which alleviates the effects of oxidative stress.52, 53, 54, 55, 56 In this case, the inhibition of tPA, but not uPA, by PAI‐1 is desired, and the PAI‐1‐uPA, but not PAI‐1‐tPA interaction, should be targeted. The molecular details of binding and RCL dynamics in the PAI‐1‐uPA Michaelis complex reported here indicate that targeting the P9‐P6 region of the RCL could specifically affect uPA. This strategy may prolong the beneficial effects of uPA as a thrombolytic. Thus, in light of the complexity of these molecular interactions and diverse physiological roles that has hindered the progression of inhibitors from bench to bedside, this new information provides a novel avenue for treating diseases associated with the dysregulation of the PAI‐1.
Methods and Materials
Materials
The nonenzymatic S195A variant of uPA was a kind gift from Mingdong Huang, Fujian Institute of Research on the Structure of Matter, Chinese Academy of Sciences, Fujian, China. The single‐chain variant of tPA, two‐chain tPA, rabbit anti‐human PAI‐1 antibody, and mouse anti‐human vitronectin 1E934 antibody were purchased from Molecular Innovations (Novi, MI); IANBD (#D‐2004) from Molecular Probes (Invitrogen); MTSL (#O875000) from Toronto Research Chemicals; terrific broth, kanamycin, and chloramphenicol from RPI Corp, Mount Prospect, IL; SP‐Sepharose FF, chelating‐Sepharose FF, DEAE Sephacel, blue Sepharose CL‐6B, heparin Sepharose, Sephacryl S‐100 HR, and Sephacryl S‐200 HR from GE Healthcare (Piscataway, NJ). All other reagents were of analytical grade.
PAI‐1 RCL mutagenesis and purification
Oligonucleotide primers were designed to contain a cysteine mutation at the desired RCL position. Mutations were introduced to the human PAI‐1 gene (previously cloned into the pET24d(+) vector, a gift from Grant Blouse, Henry Ford Health Sciences Center Detroit, MI) via PCR using the Quik Change II XL Site‐directed Mutagenesis kit (Stratagene Inc., Cedar Creek, TX). Correct mutants were transformed into Escherichia coli Rosetta 2 DE3 pLysS cells (Invitrogen) for growth, expression, and large‐scale cell harvest. Typical conditions for growth were 30 to 37°C with shaking at 250 to 300 rpm in terrific broth supplemented with 50 μg/mL kanamycin and 34 μg/mL chloramphenicol. At mid‐ to late log phase, cells were cooled to 15°C, induced with 1 mM IPTG, and grown overnight. Cells were harvested by centrifugation, treated with protease inhibitor cocktail (#P8465, Sigma Aldrich Corp., St. Louis, MO), and lysed by sonication. PAI‐1 proteins were purified at 4°C in the presence of 1 mM DTT in three consecutive steps involving cation exchange on SP‐Sepharose FF, IMAC on chelating‐Sepharose FF charged with nickel, and size‐exclusion on Sephacryl S‐100 HR resin (GE Healthcare, Piscataway, NJ), and stored at −80°C in phosphate buffer (0.05M NaH2PO4, 0.3M NaCl, 1 mM EDTA, 1 mM DTT, pH 6.25). The purified proteins were subjected to SDS‐PAGE followed by Western blotting (rabbit anti‐human PAI‐1) and MALDI‐TOF‐MS (Bruker Daltonics MicroFlex) to confirm the identity and purity for each construct. All protein samples were HPLC‐purified (Agilent Technologies 1200 Series) from a C18 column (Phenomenex Jupiter4u Proteo 90Å) using a linear 5 to 95% acetonitrile gradient and mixed with sinapic acid (2.5 mg/mL, Fluka) before analysis by mass spectrometry.
Purification of native monomeric vitronectin and recombinant SMB
Vitronectin was purified from human plasma by as described previously.57, 58, 59 Briefly, ∼3 L of plasma was treated with trypsin inhibitor (Sigma‐Aldrich), precipitated with 1M barium chloride at 4°C, the supernatant ammonium sulfate (50% solution) precipitated, resuspended, and separated by anion exchange on DEAE Sephacel resin, followed by separation by affinity on blue Sepharose CL‐6B, heparin Sepharose, and size‐exclusion on Sephacryl S‐200 HR resin. Purified vitronectin was confirmed by Western blotting (1E934 antibody), and its oligomeric state determined via analytical ultracentrifuge at 50,000 rpm, 25°C (Beckman‐Coulter Analytical Ultracentrifuge XL‐A). Resulting spectra were analyzed by Sedphat software and the monomeric state of vitronectin verified. Vitronectin protein was stored as an ammonium sulfate precipitate (72.7% at 4°C), and resuspended and dialyzed extensively in PBS buffer (137 mM NaCl, 2.7 mM KCl, 10 mM NaH2PO4, 1.8 mM KH2PO4, pH 7.4) before experimentation. Recombinant SMB domain was expressed as a thioredoxin‐fusion protein from a pET32b vector in Rosetta‐gami 2 (DE3) pLysS and purified via IMAC (nickel Sepharose FF), thrombin cleavage, and gel filtration (S‐100) as described previously (61). Concentrations for vitronectin and SMB were determined using an extinction coefficient, ε, of 1.0 mL mg−1 cm−1 59 and 4500 M−1 cm−1,60 respectively, and molecular weight of 62,000 g/mol61 and 5678 g/mol, respectively.62 For SMB, absorbance measurements were taken at 276 nm rather than 280 nm since the domain does not contain native tryptophan residues.
Activity of PAI‐1 proteins
tPA was titrated with varying amounts of unlabeled PAI‐1, ranging from substoichiometric to excess concentrations, and incubated for 30 min at ambient temperature. To determine the amount of active protein, excess Spectrozyme tPA (American Diagnostics Inc., Stamford, CT) was added to the reactions, which were then analyzed by the absorbance of p‐nitroaniline at 405 nm (BioTek Synergy4) after 2 min at 37°C. The percentage of active protein was determined from the equivalent required to fully inhibit tPA. To determine the amount of substrate and latent protein in preparations, tPA was titrated with PAI‐1 and incubated as before, and the reactions were analyzed by SDS‐PAGE under nonreducing conditions. Digital images of the gels created using the (Bio‐Rad ChemDoc XRS), and densitometry of each band in the lane corresponding to 1:1 PAI‐1:tPA was performed (Bio‐Rad Quantity One™). The results were normalized to percent of total intensity after background subtraction, and are based on at least duplicate measurements from which averages and standard deviations were calculated.
The half‐life of labeled PAI‐1 proteins was determined indirectly from tPA activity over time. NBD‐labeled PAI‐1 proteins were added at a concentration in which the quantity of active protein was 1:1 with 0.1 μM tPA (#HTPA‐TC, Molecular Innovations, Novi, MI). PAI‐1 was incubated at 37°C in MOPS buffer (0.5 mM, 0.1 M a mM onium sulfate, 0.1 mM EDTA, pH 7.4) and quenched with 0.1 μM tPA at various time points. Initial rates were measured by adding excess Spectrozyme tPA to the reactions and recording the absorbance of p‐nitroaniline at 405 nm for 5 min. The slope obtained from the latter was plotted against each time point as tPA activity. The residual PAI‐1 activity was calculated as the negative of tPA activity, normalized, and fit to a one‐phase exponential decay model using GraphPad Prism Version 5.0b. The corresponding active half‐lives for PAI‐1 proteins was determined. All experiments were performed in triplicate and data were collected for ≥10 half‐lives.
Labeling of PAI‐1 RCL
DTT was removed from the purified proteins via a PD‐10 column (GE Healthcare Life Sciences) and eluted in phosphate buffer (0.05M NaH2PO4, 0.3M NaCl, 1 mM EDTA, pH 6.6) at 4°C. The fluorescent and spin probes, IANBD and MTSL, were dissolved in DMSO, and added at 10 to 20× molar excess and at 10% of the total volume. Reactions were incubated (covered) on ice at 4°C from ∼4 h to overnight to label. After incubation, free probe was removed by an additional PD‐10 step. Labeling was confirmed by MALDI‐MS as described above, and labeled proteins stored at −80°C in phosphate buffer (0.05M NaH2PO4, 0.3M NaCl, 1 mM EDTA, pH 6.6). The degree of NBD labeling was determined using the following equation:
where the A NBD is taken at 492 nm, the extinction coefficient for NBD, ε NBD, is 25,000 M−1 cm−1, and the MW of recombinant unglycosylated human PAI‐1 used for the calculation is 43,000 mg/mmol. The absorbance of NBD at 280 nm was corrected for as previously described.38, 63 Labeling stoichiometries with NBD were greater than 90% for most constructs, and ∼60–70% for a few constructs (P13, P12, P9, P6, P2′). MTSL‐labeling was confirmed using a Bruker EMX EPR spectrometer.
PAI‐1 RCL fluorescence measurements
NBD‐labeled PAI‐1, vitronectin, and SMB proteins were dialyzed in 4 L PBS buffer (137 mM NaCl, 2.7 mM KCl, 10 mM NaH2PO4, 1.8 mM KH2PO4, pH 7.4) at 4°C. Following dialysis, 0.5 μM NBD‐PAI‐1 was added to equimolar S195A tPA or S195A uPA, or 2 μM vitronectin or SMB, and incubated at room temperature for 30 min. Following incubation, samples were excited at 480 nm in a luminescence spectrometer (Perkin Elmer LS 50B) and the emission spectra from 500 to 600 nm collected. The intensity at 530 nm was obtained and normalized to determine the percent change in fluorescence due to binding according to the following equation:
where F is the fluorescence intensity at 530 nm, and F 0 = F PAI, which is the average fluorescence intensity of NBD‐PAI‐1 alone at 530 nm. All experiments were preformed in triplicate.
PAI‐1 RCL EPR measurements
MTSL‐labeled PAI‐1 was dialyzed in 4 L PBS buffer (137 mM NaCl, 2.7 mM KCl, 10 mM NaH2PO4, 1.8 mM KH2PO4, pH 7.4) at 4°C and diluted to a final concentration of 2 μM after the addition of ligands: 2 μM S195A‐tPA (due to limited reagent available), or 8 μM S195A‐uPA, vitronectin, or SMB. Reactions were incubated at 25°C for 30 min. Following incubation, samples were added to a 100 mm high‐precision quartz capillary (Wilmad Glass, inner diameter 1.012 ± 0.013 mm), sealed with Teflon plugs, and placed in the cavity of a Bruker EMX EPR Spectrometer. [Small diameter capillaries were used to prevent signal loss due to the high dielectric of the buffer.64] The frequency was held constant in the X‐band (∼9.45 GHz) and center field was set at 3360 G with a sweep width of 100 G. The time constant and conversion time were set to 655.29 ms and 20.48 ms, respectively, with a resolution in X of 2048 for five scans. Spectra were collected at an attenuation of 10 dB. All other parameters were kept at default. The mobility of the spin‐labeled residue was determined from the linewidth (δ), which was calculated as difference in the field at which the peak and trough of the central resonance line was observed. Mobilities were scaled (M s) according to the following equation:
where δ is the width of central resonance line of residue R1, δ i is the linewidth of most immobilized R1 (i.e. P1′), and δ m is the linewidth of most mobile R1 (i.e. P8).65 The mean of the scaled mobility was obtained, and results were normalized to PAI‐1 alone according to the following equation:
where ΔM s is the change in scaled mobility, M s′ is the average scaled mobility in the presence of ligand and M s′0 is the average scaled mobility of PAI‐1 in the absence of ligand. All experiments were performed in triplicate.
References
- 1. Whisstock JC, Silverman GA, Bird PI, Bottomley SP, Kaiserman D, Luke CJ, Pak SC, Reichhart JM, Huntington JA (2010) Serpins flex their muscle: II. Structural insights into iarget peptidase recognition, polymerization, and transport functions. J Biol Chem 285:24307–24312. [DOI] [PMC free article] [PubMed] [Google Scholar]
- 2. Dupont DM, Madsen JB, Kristensen T, Bodker JS, Blouse GE, Wind T, Andreasen PA (2009) Biochemical properties of plasminogen activator inhibitor‐1. Front Biosci 14:1337–1361. [DOI] [PubMed] [Google Scholar]
- 3. Minor KH, Peterson CB (2002) Plasminogen activator inhibitor type 1 promotes the self‐association of vitronectin into complexes exhibiting altered incorporation into the extracellular matrix. J Biol Chem 277:10337–10345. [DOI] [PubMed] [Google Scholar]
- 4. Garg N, Goyal N, Strawn TL, Wu J, Mann KM, Lawrence DA, Fay WP (2010) Plasminogen activator inhibitor‐1 and vitronectin expression level and stoichiometry regulate vascular smooth muscle cell migration through physiological collagen matrices. J Thromb Haemost 8:1847–1854. [DOI] [PMC free article] [PubMed] [Google Scholar]
- 5. Park YJ, Liu G, Lorne EF, Zhao X, Wang J, Tsuruta Y, Zmijewski J, Abraham E (2008) PAI‐1 inhibits neutrophil efferocytosis. Proc Natl Acad Sci USA 105:11784–11789. [DOI] [PMC free article] [PubMed] [Google Scholar]
- 6. Verhamme IM, Kvassman J, Day DE, Debrock S, Vleugels N, Declerck PJ, Shore JD (1999) Accelerated conversion of human plasminogen activator inhibitor‐1 to its latent form by antibody binding. J Biol Chem 274:17511–17517. [DOI] [PubMed] [Google Scholar]
- 7. Loskutoff DJ (1993) A slice of PAI. J Clin Invest 92:2563. [DOI] [PMC free article] [PubMed] [Google Scholar]
- 8. De Taeye B, Smith LH, Vaughan DE (2005) Plasminogen activator inhibitor‐1: a common denominator in obesity, diabetes and cardiovascular disease. Curr Opin Pharmacol 5:149–154. [DOI] [PubMed] [Google Scholar]
- 9. Lyon CJ, Hsueh WA (2003) Effect of plasminogen activator inhibitor‐1 in diabetes mellitus and cardiovascular disease. Am J Med 115:62S–68S. [DOI] [PubMed] [Google Scholar]
- 10. Nordt TK, Peter K, Ruef J, Kubler W, Bode C (1999) Plasminogen activator inhibitor type‐1 (PAI‐1) and its role in cardiovascular disease. Thromb Haemost 82:14–18. [PubMed] [Google Scholar]
- 11. Ploplis VA (2011) Effects of altered plasminogen activator inhibitor‐1 expression on cardiovascular disease. Curr Drug Targets 12:1782–1789. [DOI] [PMC free article] [PubMed] [Google Scholar]
- 12. Usher PA, Thomsen OF, Iversen P, Johnsen M, Brünner N, Høyer‐Hansen G, Andreasen PA, Danø K, Nielsen BS (2005) Expression of urokinase plasminogen activator, its receptor and type‐1 Inhibitor in malignant and benign prostate tissue. Int J Cancer 113:870–880. [DOI] [PubMed] [Google Scholar]
- 13. Choong PF, Nadesapillai AP (2003) Urokinase plasminogen activator system: a multifunctional role in tumor progression and metastasis. Clin Orthop Relat Res 415: S46–S58. Suppl: [DOI] [PubMed] [Google Scholar]
- 14. Chen Q, Fei J, Wu L, Jiang Z, Wu Y, Zheng Y, Lu G (2011) Detection of cathepsin b, cathepsin l, cystatin c, urokinase plasminogen activator and urokinase plasminogen activator receptor in the sera of lung cancer patients. Oncol Lett 2:693–699. [DOI] [PMC free article] [PubMed] [Google Scholar]
- 15. Naina HV, Patnaik MM, Ali UA, Chen D, Ashrani AA (2010) Systemic fibrinolysis caused by tissue plasminogen activator‐producing metastatic breast cancer. J Clin Oncol 28:e167–e168. [DOI] [PubMed] [Google Scholar]
- 16. Zhang W, Ling D, Tan J, Zhang J, Li L (2013) Expression of urokinase plasminogen activator and plasminogen activator inhibitor type‐1 in ovarian cancer and its clinical significance. Oncol Rep 29:637–645. [DOI] [PubMed] [Google Scholar]
- 17. Tang L, Han X (2013) The urokinase plasminogen activator system in breast cancer invasion and metastasis. Biomed Pharmacother 67:179–182. [DOI] [PubMed] [Google Scholar]
- 18. Köller A, Kirchheimer J, Pflüger H, Binder BR (1984) Tissue plasminogen activator activity in prostatic cancer. Eur Urol 10:389–394. [DOI] [PubMed] [Google Scholar]
- 19. Binder BR, Mihaly J (2008) The plasminogen activator inhibitor “paradox” in cancer. Immunol Lett 118:116–124. [DOI] [PubMed] [Google Scholar]
- 20. Diebold I, Kraicun D, Bonello S, Görlach A (2008) The ‘PAI‐1 paradox’ in vascular remodelling. Thromb Haemost 100:984–991. [PubMed] [Google Scholar]
- 21. Sobel BE (1999) Increased plasminogen activator inhibitor‐1 and vasculopathy: a reconcilable paradox. Circulation 99:2496–2498. [DOI] [PubMed] [Google Scholar]
- 22. Vaughan DE (2002) PAI‐1 and cellular migration: dabbling in a paradox. Arterioscler Thromb Vasc Biol 22:1522–1523. [DOI] [PubMed] [Google Scholar]
- 23. Lawrence DA, Palaniappan S, Stefansson S, Olson ST, Francis‐Chmura AM, Shore JD, Ginsberg DS (1997) Characterization of the binding of different conformational forms of plasminogen activator inhibitor‐1 to vitronectin: implications for the regulation of pericellular proteolysis. J Biol Chem 272:7676–7680. [DOI] [PubMed] [Google Scholar]
- 24. Fortenberry YM (2013) Plasminogen activator inhibitor‐1 inhibitors: a patent review (2006 – present). Expert Opin Ther Pat 23:801–815. [DOI] [PubMed] [Google Scholar]
- 25. Gong L, Liu M, Zeng T, Shi X, Yuan C, Andreasen PA, Huang M (2015) Crystal structure of the Michaelis complex between tissue‐type plasminogen activator and plasminogen activators inhibitor‐1. J Biol Chem. 290:25795–25804. [DOI] [PMC free article] [PubMed] [Google Scholar]
- 26. Lin Z, Jiang L, Yuan C, Jensen JK, Zhang X, Luo Z, Furie BC, Furie B, Andreasen PA, Huang M (2011) Structural basis for recognition of urokinase‐type plasminogen activator by plasminogen activator inhibitor‐1. J Biol Chem 286:7027–7032. [DOI] [PMC free article] [PubMed] [Google Scholar]
- 27. Zhou A, Huntington JA, Pannu NS, Carrell RW, Read RJ (2003) How vitronectin binds PAI‐1 to modulate fibrinolysis and cell migration. Nat Struct Biol 10:541–544. [DOI] [PubMed] [Google Scholar]
- 28. Trelle MB, Hirschberg D, Jansson A, Ploug M, Roepstorff P, Andreasen PA, Jorgensen TJ (2012) Hydrogen/deuterium exchange mass spectrometry reveals specific changes in the local flexibility of plasminogen activator inhibitor 1 upon binding to the somatomedin B domain of vitronectin. Biochemistry 51:8256–8266. [DOI] [PubMed] [Google Scholar]
- 29. Trelle MB, Madsen JB, Andreasen PA, Jorgensen TJ (2014) Local transient unfolding of native state PAI‐1 associated with serpin metastability. Angew Chem Int Ed Engl 53:9751–9754. [DOI] [PubMed] [Google Scholar]
- 30. Sharp AM, Stein PE, Pannu NS, Carrell RW, Berkenpas MB, Ginsberg DS, Lawrence DA, Read RJ (1999) The active conformation of plasminogen activator inhibitor 1, a target for drugs to control fibrinolysis and cell adhesion. Structure 7:111–118. [DOI] [PubMed] [Google Scholar]
- 31. Stout TJ, Graham H, Buckley DI, Matthews DJ (2000) Structures of active and latent pai‐1: a possible stabilizing role for chloride ions. Biochemistry 39:8460–8469. [DOI] [PubMed] [Google Scholar]
- 32. Jensen JK, Thompson LC, Bucci JC, Nissen P, Gettins PGW, Peterson CB, Andreasen PA, Morth JP (2011) Crystal structure of plasminogen activator inhibitor‐1 in an active conformation with normal thermodynamic stability. J Biol Chem 286:29709–29717. [DOI] [PMC free article] [PubMed] [Google Scholar]
- 33. Cazzolli G, Wang F, a Beccara S, Gershenson A, Faccioli P, Wintrode PL (2014) Serpin latency transition at atomic resolution. Proc Natl Acad Sci USA 111:15414–15419. [DOI] [PMC free article] [PubMed] [Google Scholar]
- 34. Blouse GE, Perron MJ, Kvassman J, Yunus S, Thompson JH, Betts RL, Lutter LC, Shore JD (2003) Mutation of the highly conserved tryptophan in the serpin breach region alters the inhibitory mechanism of plasminogen activator inhibitor‐1. Biochemistry 42:12260–12272. [DOI] [PubMed] [Google Scholar]
- 35. Ibarra CA, Blouse GE, Christian TD, Shore JD (2003) The contribution of the exosite residues of plasminogen activator inhibitor‐1 to proteinase inhibition. J Biol Chem 279:3643–3650. [DOI] [PubMed] [Google Scholar]
- 36. Blouse GE, Dupont DM, Schar CR, Jensen JK, Minor KH, Anagli JY, Gårdsvoll H, Ploug M, Peterson CB, Andreasen PA (2009) Interactions of plasminogen activator inhibitor‐1 with vitronectin involve an extensive binding surface and induce mutual conformational rearrangements. Biochemistry 48:1723–1735. [DOI] [PubMed] [Google Scholar]
- 37. Komissarov AA, Andreasen PA, Bodker JS, Declerck PJ, Anagli JY, Shore JD (2005) Additivity in effects of vitronectin and monoclonal antibodies against helix F of plasminogen activator inhibitor‐1 on its reactions with target proteinases. J Biol Chem 280:1482–1489. [DOI] [PubMed] [Google Scholar]
- 38. Gibson A, Baburaj K, Day DE, Verhamme IM, Shore JD, Peterson CB (1997) The use of fluorescent probes to characterize conformation changes in the interaction between vitronectin and plasminogen activator inhibitor‐1. J Biol Chem 272:5112–5121. [DOI] [PubMed] [Google Scholar]
- 39. Li SH, Gorlatova NV, Lawrence DA, Schwartz BS (2008) Structural differences between active forms of plasminogen activator inhibitor type 1 revealed by conformationally sensitive ligands. J Biol Chem 283:18147–18157. [DOI] [PMC free article] [PubMed] [Google Scholar]
- 40. Olson ST, Swanson R, Day DE, Verhamme IM, Kvassman J, Shore JD (2001) Resolution of michaelis complex, acylation, and conformational change steps in the reactions of the serpin, plasminogen activator inhibitor‐1, with tissue plasminogen activator and trypsin. Biochemistry 40:11742–11756. [DOI] [PubMed] [Google Scholar]
- 41. Ferrari S, Costi PM, Wade RC (2003) Inhibitor specificity via protein dynamics: insights from the design of antibacterial agents targeted against thymidylate synthase. Chem Biol 10:1183–1193. [DOI] [PubMed] [Google Scholar]
- 42. Cardinale D, Guaitoli G, Tondi D, Luciani R, Henrich S, Salo‐Ahen OM, Ferrari S, Marverti G, Guerrieri D, Ligabue A, Frassineti C, Pozzi C, Mangani S, Fessas D, Guerrini R, Ponterini G, Wade RC, Costi MP (2011) Protein‐protein interface‐binding peptides inhibit the cancer therapy target human thymidylate synthase. Proc Natl Acad Sci USA 108:E542–E549. [DOI] [PMC free article] [PubMed] [Google Scholar]
- 43. Gao F, Kight AD, Henderson R, Jayanthi S, Patel P, Murchison M, Sharma P, Goforth RL, Kumar TK, Henry RL, Heyes CD (2015) Regulation of structural dynamics within a signal recognition particle promotes binding of protein targeting substrates. J Biol Chem 290:15462–15472. [DOI] [PMC free article] [PubMed] [Google Scholar]
- 44. Melanson M, Sood A, Török F, Török M (2013) Introduction to spin label electron paramagnetic resonance spectroscopy of proteins. Biochem Mol Biol Educ 41:156–162. [DOI] [PubMed] [Google Scholar]
- 45. Larson AG, Naber N, Cooke R, Pate E, Rice SE (2010) Conserved L5 loop establishes the pre‐powerstroke conformation of the Kinesin‐5 motor, Eg5. Biophys J 98:2619–2627. [DOI] [PMC free article] [PubMed] [Google Scholar]
- 46. Keijer J, Linders M, Wegman JJ, Ehrlich HJ, Mertens K, Pannekoek H (1991) On the target specificity of plasminogen activator inhibitor 1: the role of heparin, vitronectin, and the reactive site. Blood 78:1254–1261. [PubMed] [Google Scholar]
- 47. Flemmig M, Melzig MF (2012) Serine‐proteases as plasminogen activators in terms of fibrinolysis. J Pharm Pharmacol 64:1025–1039. [DOI] [PubMed] [Google Scholar]
- 48. Madison EL, Goldsmith EJ, Gerard RD, Gething MH, Sambrook JF, Bassel‐Duby RS (1990) Amino acid residues that affect interaction of tissue‐type plasminogen activator with plasminogen activator inhibitor 1. Proc Natl Acad Sci USA 87:3530–3533. [DOI] [PMC free article] [PubMed] [Google Scholar]
- 49. Komissarov AA, Zhou A, Declerck PJ (2007) Modulation of serpin reaction through stabilization of transient intermediate by ligands bound to a‐helix F. J Biol Chem 282:26306–26315. [DOI] [PubMed] [Google Scholar]
- 50. Gettins PGW, Olson ST (2009) Exosite determinants of serpin specificity. J Biol Chem 284:20441–20445. [DOI] [PMC free article] [PubMed] [Google Scholar]
- 51. Hagglof P, Bergstrom F, Wilczynska M, Johansson LB, Tor N (2004) The reactive‐center loop of active PAI‐1 is folded close to the protein core and can be partially inserted. J Mol Biol 335:823–832. [DOI] [PubMed] [Google Scholar]
- 52. Aulicky P, Rabinstein A, Seet RC, Neumann J, Mikulik R (2012) Dosing of tissue plasminogen activator often differs from 0.9 mg/kg, but does not affect the outcome. J Stroke Cerebrovasc Dis 22:1293–1297. [DOI] [PubMed] [Google Scholar]
- 53. Adibhatla RM, Hatcher JF (2008) Tissue plasminogen activator (tPA) and matrix metalloproteinases in the pathogenesis of stroke: therapeutic strategies. CNS Neurol Disord Drug Targets 7:243–253. [DOI] [PMC free article] [PubMed] [Google Scholar]
- 54. Parcq J, Bertrand T, Baron AF, Hommet Y, Anglès‐Cano E, Vivien D (2013) Molecular requirements for safer generation of thrombolytics by bioengineering the tissue‐type plasminogen activator A chain. J Thromb Haemost 11:539–546. [DOI] [PubMed] [Google Scholar]
- 55. Harston GWJ, Sutherland BA, Kennedy J, Buchan AM (2010) The contribution of L‐arginine to the neurotoxicity of recombinant tissue plasminogen activator following cerebral ischemia: a review of rtPA neurotoxicity. J Cereb Blood Flow Metab 30:1804–1816. [DOI] [PMC free article] [PubMed] [Google Scholar]
- 56. Cho E, Lee K, Seo J, Byun CJ, Chung S, Suh DC, Carmeliet P, Koh J, Kim JS, Lee J (2012) Neuroprotection by urokinase plasminogen activator in the hippocampus. Neurobiol Dis 46:215–224. [DOI] [PubMed] [Google Scholar]
- 57. Preissner KT, Heimburger N, Anders E, Muller‐Berghaus G (1986) Physicochemical, immunochemical and functional comparison of human S‐protein and vitro‐ nectin. Evidence for the identity of both plasma proteins. Biochem Biophys Res Commun 134:951–956. [DOI] [PubMed] [Google Scholar]
- 58. Bittorf SV, Williams EC, Mosher DF (1993) Alteration of vitronectin. Characterization of changes induced by treatment with urea. J Biol Chem 268:24838–24846. [PubMed] [Google Scholar]
- 59. Zhuang P, Li H, Williams JG, Wagner NV, Seiffert D, Peterson CB (1996) Characterization of the denaturation and renaturation of human plasma vitronectin: II. Investigation into the mechanism of formation of multimers. J Biol Chem 271:14333–14343. [DOI] [PubMed] [Google Scholar]
- 60. Edelhoch H (1967) Spectroscopic determination of tryptophan and tyrosine in proteins. Biochemistry 6:1948–1954. [DOI] [PubMed] [Google Scholar]
- 61. Lynn GW, Heller WT, Mayasundari A, Minor KH, Peterson CB (2005) A model for the three‐dimensional structure of human plasma vitronectin from small‐angle scattering measurements. Biochemistry 44:565–574. [DOI] [PubMed] [Google Scholar]
- 62. Thompson LC, Goswami S, Ginsberg DS, Day DE, Verhamme IM, Peterson CB (2011) Metals affect the structure and activity of human plasminogen activator inhibitor‐1. I. modulation of stability and protease inhibition. Protein Sci 20:353–365. [DOI] [PMC free article] [PubMed] [Google Scholar]
- 63. Shore JD, Day DE, Francis‐Chmura AM, Verhamme IM, Kvassman J, Lawrence DA, Ginsberg DS (1995) A fluorescent probe study of plasminogen activator inhibitor‐1: evidence for reactive center loop insertion and its role in the inhibitory mechanism. J Biol Chem 270:5395–5398. [DOI] [PubMed] [Google Scholar]
- 64. Eaton S, Eaton G (1977) Electron paramagnetic resonance sample cell for lossy samples. Anal Chem 49:1277–1278. [Google Scholar]
- 65. Columbus L, Hubbell WL (2002) A new spin on protein dynamics. Trends Biochem Sci 27:288–295. [DOI] [PubMed] [Google Scholar]