

Abstract
Missing regions in X‐ray crystal structures in the Protein Data Bank (PDB) have played a foundational role in the study of intrinsically disordered protein regions (IDPRs), especially in the development of in silico predictors of intrinsic disorder. However, a missing region is only a weak indication of intrinsic disorder, and this uncertainty is compounded by the presence of ambiguous regions, where more than one structure of the same protein sequence “disagrees” in terms of the presence or absence of missing residues. The question is this: are these ambiguous regions intrinsically disordered, or are they the result of static disorder that arises from experimental conditions, ensembles of structures, or domain wobbling? A novel way of looking at ambiguous regions in terms of the pattern between multiple PDB structures has been demonstrated. It was found that the propensity for intrinsic disorder increases as the level of ambiguity decreases. However, it is also shown that ambiguity is more likely to occur as the protein region is placed within different environmental conditions, and even the most ambiguous regions as a set display compositional bias that suggests flexibility. The results suggested that ambiguity is a natural result for many IDPRs crystallized under different conditions and that static disorder and wobbling domains are relatively rare. Instead, it is more likely that ambiguity arises because many of these regions were conditionally or partially disordered.
Keywords: protein data bank, PDB, intrinsically disordered protein, intrinsically disordered protein region, disorder prediction, missing residues, X‐ray crystallography
Abbreviations
- CASP
critical assessment of protein structure prediction
- DisProt
a database of proteins with experimentally validated intrinsically disordered regions
- DSSP
define secondary structure of proteins
- IDP
intrinsically disordered protein
- IDPR
intrinsically disordered protein region
- MoRF
molecular recognition feature
- PDB
protein data bank.
Introduction
The Protein Data Bank (PDB) is the foremost archive of three‐dimensional structural information for proteins and nucleic acids. The PDB has experienced impressive growth since its creation in 1971, and as of July 2015, there were over 110,000 entries. PDB structures are obtained primarily by X‐ray crystallography (89% of structures) and nuclear magnetic resonance (10% of structures), with a small number of structures obtained by electron microscopy and other methods. In this study, we have focused on the missing residues from X‐ray crystal structures where multiple PDB structures representing the same sequence are available.
Missing residues in the three‐dimensional structure occur due to regions of low or poorly defined electron density that cannot be resolved into a single point in space. Oftentimes, this is due to dynamic atomic movement resulting in non‐coherent X‐ray scattering, and therefore it is not surprising that these missing regions were some of the first to be called “disordered” by the scientific community.1 However, it is important to note that this early use of the word was meant to encompass a wide range of structural possibilities. A missing region in the electron density map of a crystal structure indicates the lack of a single stable structure, but it is not a direct measure of the cause. This “disorder” was divided roughly by Bennett in 1984 into dynamic and static disorder.2 Dynamic disorder, he proposed, was caused by continual motion in the protein, whereas static disorder encompassed all other possibilities, such as multiple stable conformations or crystal packing imperfections. In 1998, Garner et al. introduced the term domain wobble to describe missing regions that result from cooperative movements of a structurally intact unit, which are typically facilitated by a small flexible hinge.3 They also differentiated these regions, along with structural ensembles, from intrinsic disorder.
Intrinsically disordered proteins (IDPs) and intrinsically disordered protein regions (IDPRs) are typically defined by a lack of stable three‐dimensional structure under physiological conditions; however, within this definition, there are a number of different possibilities. IDPRs can be classified by their biophysical functions, such as entropic chain and display site functions.4 IDPs/IDPRs can also be classified by cellular function and are overrepresented in processes such as cell signaling and gene regulation.5, 6 IDPRs have sequence characteristics that are distinct from structured regions, and it has also been shown that IDPRs can be further clustered into sequence‐based “flavors.”7 There appears to be some relationship between these three axes (biophysical function, cellular function, and sequence characteristics), but the identification and development of these relationships is still in its early stages.8 A precise definition of intrinsic disorder is further complicated by the presence of conditionally (dis)ordered regions9 and partially disordered regions. Conditionally disordered regions are intrinsically disordered under some conditions and structured under others. This most often manifests as a disorder‐to‐order transition upon binding, which is often facilitated by molecular recognition features (MoRFs).10 There are also many examples of proteins that have transient or cryptic disorder, which is functionally relevant disorder that arises only under certain conditions.11 Partially disordered or semi‐disordered12 regions display intermediate amounts of highly flexible, residual, and/or transient secondary structure. Both conditional disorder and partial disorder are difficult to detect experimentally and predictively.
It has long been understood that not all missing regions in X‐ray crystal structures are intrinsically disordered. Static disorder, wobbly/mobile domains, packing imperfections, and missing regions that arise from experimental conditions would not be considered intrinsically disordered. Therefore, for the sake of clarity, we will refer to protein regions with missing electron density as missing regions and consider these as distinct from, but often correlated with, IDPRs.
Bioinformatics tools have played a large part in establishing the field of intrinsic disorder, and in the study of IDPs/IDPRs, particularly at the proteome level, where high‐throughput experimental methods to recognize intrinsic disorder are lacking. In order to help fill this gap, over 60 in silico predictors of intrinsic disorder have been developed.13, 14 Predictors of intrinsic disorder typically use sequence‐based features to predict the likelihood that a particular residue or region is intrinsically disordered. The experimental identification of IDPRs often requires a consensus of methods that may leave some uncertainty as to the nature of the disorder and the precise location. Therefore, the development of datasets of known intrinsically disordered regions that can be used to train predictors is a slow and arduous process. DisProt15 provides the largest and most well‐known database of experimentally verified intrinsically disordered regions. However, at 694 entries (as of July 2015), its coverage is infinitesimal compared with the predicted amount of intrinsic disorder in various proteomes, and it is unlikely to be fully representative. Several groups have compiled NMR‐based datasets as well;16, 17 however, the largest dataset of experimentally indicated IDPRs continues to come from X‐ray crystal structures in the PDB.
While one can address the problem of scarce experimental data by using missing regions as an indication of disorder, missing electron density is also a weaker indication of an IDPR than NMR or a consensus of multiple methods. Therefore, the use of data from the PDB for training and testing predictors introduces some uncertainty. It is likely that noise in the training and testing sets for disorder predictors is currently the largest bottleneck to increased accuracy. For instance, the Critical Assessment of protein Structure Prediction (CASP) competition, which measures the accuracy of disorder predictors, uses missing regions in newly published X‐ray crystal structures to measure the accuracy of competing predictors, despite the acknowledgement that these missing regions could arise for multiple reasons, including annotation errors.18 Disorder predictors are often refined for best performance against CASP datasets, but this does not necessarily mean that they are best optimized to predict in vivo intrinsic disorder. The fidelity of datasets of IDPRs is of utmost importance; therefore, it is critical that we continue to examine the best ways to extract genuine intrinsic disorder data from the PDB.
Several studies have examined intrinsic disorder in the PDB.19, 20, 21, 22, 23 Of particular interest to us were the ambiguous or dual personality fragments, defined in 2007 by Le Gall19 and Zhang,20 respectively. These are regions in PDB chains where multiple structures of the same sequence show a conflict between missing and observed assignments. The PDB currently contains nearly three times as many entries as it did in 2007, when Le Gall and Zhang published their works. With this expanded source data, we were able to further investigate these ambiguous regions by preparing a large dataset that consists only of UniProt sequences that have at least two structures (PDB chains) available. Furthermore, using precompiled information from the PDB providing per‐residue assignments of missing residues and secondary structure has allowed us to simplify this analysis and provide an easy‐to‐use method for proteomics studies that make use of PDB data.
Results and Discussion
Characterization of the missing regions
Our base dataset consists of PDB chains that contain identical sequence residues in at least some portion of the chain, where those residues can be mapped to all or part of a UniProt identifier. A PDB chain is a single contiguous peptide or protein in a PDB file, where some PDB files may contain multiple heterologous or homologous chains in complex. We have developed a method that allows us to classify missing regions in these PDB chains according to the pattern the missing residues display when those chains disagree. Our method employs the following steps, which are outlined in Figure 1:
Figure 1.

The classification scheme for PDB sequence regions used in this study.
Create a representative sequence for each PDB chain composed of missing residues, uncharacterized residues, and secondary structure information.
Create a representation of the UniProt sequence by compiling information over all PDB chains and recording only observed, missing, and uncharacterized assignments.
For each missing region in the UniProt sequence, assign a category (conserved, contained, conflicting, overlapping, or discarded), established by the pattern of missing residues between PDB chains.
We used the following definitions for a single‐residue column across multiple PDB chains:
Uncharacterized: No PDB chain has an observed or missing residue in this position.
Characterized: At least one PDB chain has an observed or missing residue in this position.
Observed: At least one PDB chain has an observed residue in this position, and no PDB chains have a missing residue in this position.
Missing residue: At least one PDB chain has a missing residue in this position.
Missing region: There are at least three contiguous missing residues from the composite of all structures.
The missing region categories were assigned based on the following criteria, and in the following order:
Conserved: The contiguous missing residues are present in all PDB chains.
Conflicting: At least one PDB chain was completely observed in the missing region.
Contained: At least one PDB chain had the full length of the missing region, and all other regions were the same length or contained within (but not completely conserved).
Overlapping: The missing regions overlap or are contiguous, but no one structure has a missing region that contains all others.
If there was a missing region in only one structure and there was not a fully characterized region in any of the other structures, the missing region was assigned as discarded because we felt this left insufficient information for comparison.
Ambiguous regions have greater secondary structure variation
Ambiguous regions, by definition, are missing regions that have observed residues in some of their associated PDB chains. Therefore, we were able to compare the difference in the secondary structure assignments between the observed portions of the ambiguous regions and the fully observed regions in our dataset. Secondary structure assignments are provided in a single file by the PDB (available in the Supporting Information materials) and are calculated by the Define Secondary Structure of Proteins (DSSP) program.24 These are not secondary structure predictions, but rather they are calculated by rigorously defined geometrical restraints based on the three‐dimensional structure of the protein.25 When no defined geometrical restraints are met, the secondary structure for that residue position is left blank by DSSP. These irregular assignments are not devoid of information, however, because the lack of assignment indicates that these regions have low curvature and lack hydrogen‐bonded structure.25 We assigned the letter P to these residues and found that they were very highly represented in ambiguous regions. In addition to irregular assignments (P), ambiguous regions are also enriched in hydrogen‐bonded turns (T) and bends (S), while observed regions are enriched in alpha helices (H) and beta sheets (E) [Fig. 2(A)]. A list of secondary structure, missing residue, and uncharacterized assignments and their abbreviations is provided in Table 1.
Figure 2.

Analysis of secondary structure in observed versus missing regions. (A) The relative fraction of secondary structure assignments on a per‐residue basis across all PDB structures with uncharacterized and missing residues removed. (B) The 10 highest‐occurring secondary structure combinations in ambiguous region columns and the relative fraction in ambiguous and observed residue columns. (C) The cumulative distribution of Shannon entropy by secondary structure in residue columns. (D) The number of unique secondary structure elements per residue column.
Table 1.
Definitions Of Secondary Structure Elements Used in this Study
| Secondary structure abbreviations |
|---|
|
P = low curvature without H‐bonded structure H = α‐helix B = residue in isolated β‐bridge E = extended strand, participates in β ladder G = 3‐helix (310 helix) I = 5 helix (π‐helix) T = hydrogen‐bonded turn S = bend – = uncharacterized X = not observed (missing) |
Ambiguous regions are more likely to have secondary structure variation between different PDB chains in a single‐residue column [Fig. 2(B–D)]. Figure 2(B) shows the top 10 most common secondary structure combinations (including those columns with only one secondary structure assignment) in an ambiguous residue column position. Surprisingly, the combination of P and S is actually more common than a beta sheet assignment. The pairs PS, PE, ST, and PH all commonly occur in the same residue position between multiple structures in ambiguous regions. This suggests that between the different PDB chains in an ambiguous region, recognizable secondary structure elements are relaxing to the point where they no longer have a recognized secondary structure type. Figure 2(C) shows the Shannon entropy of the secondary structure within residue columns of observed and ambiguous regions. The Shannon entropy measures the amount of information within a text string, and therefore it increases in proportion to the variety and relative proportion of secondary structure assignments in a single‐residue position.26 Nearly 90% of the observed regions had only one secondary structure assignment in a residue column, and over 40% of the ambiguous regions had at least two different secondary structure assignments [Fig. 2(C,D)].
Therefore, results described in this section suggest that:
Ambiguous regions have greater variation in the secondary structure between multiple PDB files of the same sequence than observed regions.
Irregular secondary structure, which has low curvature, is highly represented in ambiguous regions.
Different types of missing regions that are classified by the pattern of missing residues have distinct characteristics
The missing regions in this study are defined as an all‐or‐nothing composite of the missing residues amongst all PDB chains associated with a particular UniProt ID. About 73% (13,194/19,153) of the UniProt IDs in our set had a missing region of at least three residues in length, with an average of 2.3 (31,531/13,914) regions per UniProt ID within that set. Each missing region was assigned a category, depending on the pattern of missing residues between PDB chains mapped to the same UniProt ID. The quantities of each region sorted by category are provided in Table 2. About 62% of the missing regions were less than 10 residues in length, with distinctive differences in the length distribution between each missing region type [Fig. 3(A)]. Conflicting regions, which have at least one PDB chain that is completely observed, were the shortest on average, and also occurred most often (77%) between multiple files [Fig. 3(D)]. The overlapping pattern was the longest on average, and was quite rare, with only 1708 examples in our set. Overlapping patterns are composed of 53% uncharacterized residues, yet occur only slightly more often on the ends of the protein [Fig. 3(B)]. Additionally, 76% are produced between different PDB files [Fig. 3(D)], in a similar proportion to the conflicting regions. This suggests that the overlapping pattern may often be an artifact of variable truncation of the PDB chain between multiple files and rarely a “naturally occurring” pattern.
Table 2.
Characterization of the Datasets Analyzed in this Study
| Missing region type | Number of regions | Number of residues |
|---|---|---|
| Conserved | 4744 | 55,040 |
| Contained (ambiguous) | 12,088 | 1,78,277 |
| Conflicting (ambiguous) | 11,848 | 1,02,410 |
| Overlapping (ambiguous) | 1708 | 42,837 |
| Discarded | 1143 | 15,845 |
Figure 3.
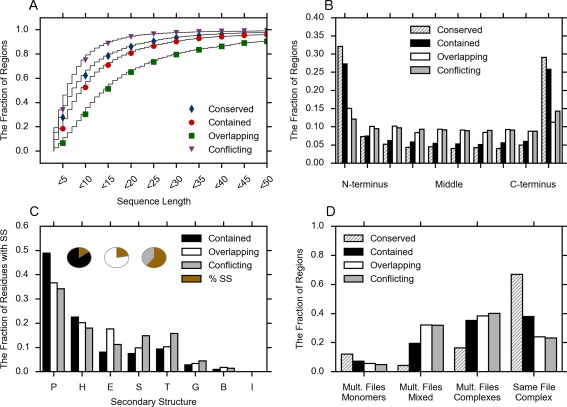
Analysis of sequence and PDB file characteristics sorted by missing region type. (A) The cumulative length distribution of missing regions by missing region type. (B) The fraction of regions occurring at different locations along the length of the full protein sequence. The full sequence is divided into 10 sections, and the missing region location is defined as the midpoint of the missing region. (C) The relative secondary structure composition, excluding uncharacterized and missing residues. (Inset) The fraction of residues that are not uncharacterized or missing and are therefore assigned a secondary structure or are irregular. (D) The fraction of missing regions occurring in different PDB file combinations. Mult. Files refers to PDB chains attached to a single UniProt ID that were obtained from more than one PDB file. Mult. Files Monomers refers to missing regions obtained from PDB files containing only one PDB chain. Mult. Files Mixed refers to missing regions that are obtained from multiple PDB files where at least one PDB file had a single PDB chain and at least one PDB file had more than one associated PDB chain. Mult. Files Complexes refers to PDB chains obtained from multiple files that all had more than one PDB chain. Same File Complex refers to PDB chains obtained from a single file.
Contained regions, where at least one PDB chain has a longest missing region that encompasses all others, were more than 2.5 times as likely to occur as completely conserved regions, and were the most commonly occurring pattern overall [Table 2]. While contained and conserved regions have similar amino acid compositions (Fig. 4), they come from very different file combinations. Conserved regions arise from multiple PDB chains within the same file 67% of the time, far more often than any other pattern. It is likely that many of these are symmetric oligomers, and the identical missing regions arise from identical environmental conditions and interaction circumstances. Conserved regions are rarely seen in situations where PDB chains are pulled from both complex files and monomer files (4%, 208 regions) [Fig. 3(D)]. This suggests that full conservation of a missing region may be somewhat delicate, and when different environmental factors are present, including different or absent binding partners, the missing region may take on variable lengths, as seen in the contained pattern.
Figure 4.
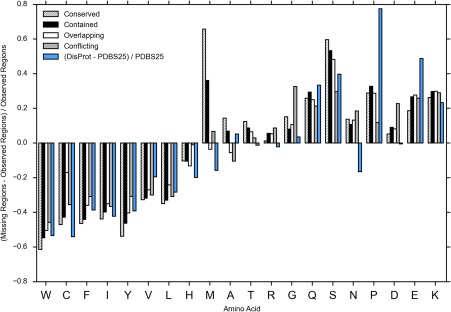
The amino acid composition of missing regions relative to the observed residues. DisProt versus PDB select 25 is provided as a reference.
None of the ambiguous region types display the same secondary structure composition as the observed regions [Figs. 2(A) and 3(C)]. The vast majority of the residues in the contained regions are missing [Fig. 3(C), inset]. However, when residues were observed in the contained regions, almost 50% of the secondary structure assignments were irregular (P), indicating low curvature in these regions. The conflicting regions have fewer missing residues, and therefore more assigned secondary structure, but do not show an increase in helical regions (H) or beta sheets (E), as might be expected if experimental artifacts caused the conflicting regions. Instead, where secondary structure is assigned, conflicting regions show more turns (T) and bends (S).
Figure 4 displays the amino acid composition of each missing region type versus sequence residues from the observed regions. It is displayed using Vihinen's27 flexibility index, which sorts amino acids from least to most flexible. It is clear that all missing region types display a composition bias away from globularity and toward flexibility. The differences between the missing region types scale roughly with conserved being the most biased and conflicting being the least (Fig. 4). Both conserved and contained regions show a high bias toward Methionine, which is likely due to their increased likelihood of occurring in the N terminus [Fig. 3(B)]. All the missing region types show a remarkably similar amino acid bias to DisProt. However, there are some differences, such as a reduced amount of Proline in the missing regions compared with DisProt.
We drew the following conclusions from the results reported in this section:
Different missing region types have different secondary structure characteristics and different amino acid compositions, and reside in different locations along the primary sequence.
Missing residues between PDB files show greater variation when there is experimental variation between PDB files.
The contained pattern appears to be a common result when PDB chains are crystallized under different contexts.
Disorder prediction correlates with missing residue conservation between multiple PDB chains
We measured the fraction of predicted disorder for observed regions, uncharacterized regions, and each missing region type using the predictors IUPred‐short, ESpritz X‐ray, and DynaMine, displayed in Table 3. Further information on these predictors is available in the Materials and Methods section. The disorder predictors, despite using different training sets and prediction methods, were in close agreement, both in the overall percentages, and by a per‐residue pairwise comparison of prediction scores, which yielded agreement between 84% and 92% (Supporting Information materials). As expected, the highest prediction of disorder was within the conserved regions. However, predictions for contained regions were very close, while conflicting regions had the lowest number of predicted disordered residues of the missing region types. Observed regions had very low prediction scores, further validating the sequence‐based differences between observed and missing regions. The MoRF and binding predictors followed a similar trend, which would be expected, given these predictors are geared toward binding residues within disordered regions. Uncharacterized regions were also predicted to be significantly more disordered than observed regions. One surprising result is that uncharacterized residues were predicted to be within a MoRF 15% of the time by ANCHOR. This may be because uncharacterized regions are frequently in N and C terminal regions.
Table 3.
Disorder Content and Content of Disorder‐Based Binding Sites in the Datasets Analyzed in this Study
| The fraction of residues predicted to be disordered or binding | ||||||||
|---|---|---|---|---|---|---|---|---|
| Disorder predictor | MoRF/binding site predictor | |||||||
| Region type | IUPred short | ESpritz X‐ray | DynaMine | ANCHOR | DisoRDP DNA | DisoRDP Prot | DisoRDP RNA | Morf pred |
| Conserved | 0.43 | 0.48 | 0.47 | 0.06 | 0.07 | 0.04 | 0.07 | 0.10 |
| Contained | 0.39 | 0.41 | 0.41 | 0.07 | 0.07 | 0.05 | 0.08 | 0.08 |
| Overlapping | 0.29 | 0.29 | 0.29 | 0.08 | 0.06 | 0.05 | 0.07 | 0.03 |
| Conflicting | 0.15 | 0.12 | 0.19 | 0.02 | 0.04 | 0.01 | 0.08 | 0.03 |
| Observed | 0.05 | 0.03 | 0.06 | 0.02 | 0.02 | 0.00 | 0.06 | 0.01 |
| Uncharacterized | 0.23 | 0.23 | 0.23 | 0.15 | 0.04 | 0.07 | 0.06 | 0.01 |
We found that the average of the disorder scores was a misleading calculation, however. The majority of the missing regions are predicted to be either 100% ordered or 100% disordered, with little in between (Fig. 5). The most dramatic example is the ESpritz X‐ray prediction for conflicting regions: 80% of the regions are predicted to be 100% ordered, 13% are predicted to be 100% disordered, and only 7% are somewhere in between. Figure 5 presents an interesting perspective on the differences between each predictor in terms of “spread.” DynaMine tends to show the largest fraction of regions between 0% and 100%, with Espritz X‐ray showing the smallest fraction, and IUPred between the two.
Figure 5.

The fraction of the set of each missing region type versus the fraction of predicted disorder for a given missing region. A Savitzky–Golay filter was applied to smooth intermediate values for clearer viewing.
Therefore, data reported in this section clearly show that:
Missing regions, as well as uncharacterized regions, are predicted on average to be more disordered than observed regions.
The amount of average predicted disorder for each missing region type scales with the level of missing residue conservation (with conserved regions being the most conserved, and conflicting regions being the least conserved) in the region.
In most cases, missing regions in the dataset are predicted to be either 100% disordered or 100% ordered, with little in between, and the average disorder scores are mostly determined by the relative fractions of each.
Indications of static disorder and wobbly domains are rare in the PDB
One interpretation for the narrow split between regions predicted to be entirely ordered or entirely disordered could be that the line between the two is a rough divider between static and dynamic disorder. In order to investigate this, we felt the best candidate subset of our data for static disorder was conflicting regions that were predicted to be 100% ordered by a 3/3 consensus of IUPred‐short, ESpritz X‐ray, and DynaMine. This subset was composed of 7033 regions, representing 59% of the total conflicting regions. If we start with the assumption that static disorder occurs in regions that are still essentially structured, then it would make sense that these regions should have the same amino acid composition as the observed regions. We compared the amino acid composition to the observed region composition, and found that this subset had a composition bias suggestive of flexibility, though less so than other missing regions or conflicting regions as a whole [Fig. 6(A)]. This result suggests that static disorder may be uncommon, and that prediction of structure by disorder predictors may not be the best indicator of static disorder. Instead, many of these conflicting regions may arise from conditionally or partially disordered residues, which are difficult to detect by disorder predictors.
Figure 6.

An analysis of possible static disorder. (A) The composition of conflicting missing regions predicted to be ordered by a 3/3 consensus of IUPred‐short, ESpritz X‐ray, and DynaMine. DisProt versus PDB select 25 is provided for reference. (B) The relative fraction of long missing regions (>49 residues) that fall into each disorder distribution. Ends refers to disorder scores only occurring in the last 20% of the missing region, when those residues do not occupy a tail position. Tails refers to disorder scores in a missing region occurring only at the ends of the PDB chain. Centered refers to disorder scores only occurring in the center 60% of the protein. Dispersed refers to all other cases with five or more disordered residues. If there are fewer than five disordered residues, the region is considered Ordered.
In order to investigate the probable incidence of wobbling domains, we examined long missing regions at least 50 residues in length as a subset. Domain wobble describes the movement of a large structured region, typically facilitated by a smaller flexible region at the edges of the domain. As a result of this behavior, we expected that domain wobble may have a pattern of predicted disorder at one or both of the ends of the domain, and predicted structure in the center. Therefore, for this subset of our data containing long missing regions, we looked at the pattern of predicted disorder, by a 2/3 consensus of IUPred‐short, ESpritz X‐ray, and DynaMine.
We then examined the distribution of the disorder scores across each individual missing region [Fig. 6(B)]. We divided the missing region into three segments, consisting of the first 20%, the middle 60%, and the last 20% of the protein. If there were at least five disordered residues by consensus, the location along the protein of those residues was recorded. If all residues occurred within the first or last 20% of the region, and they all occurred at the beginning or end of the protein chain (the starting point and ending point were defined as the first and last characterized residue from all the PDB chains), then these regions were assigned as Tails. If all disordered residues occurred in the first and last 20% of the region and some or all were not on a tail region, then these were assigned as Ends. If all disordered residues occurred in the middle 60% of the protein, these were assigned as Centered. All others were considered to be Dispersed, which includes 100% disordered regions. All those with fewer than five disordered residues were labeled as Ordered.
We expected that wobbly domains would have disordered residues concentrated at one or both ends (but not in a tail region), therefore indicating a small flexible hinge that could move the larger structured region. The incidence of this pattern was low overall, with only 43 out of 865 regions displaying a possible hinge and large movable domain pattern. Much more common was a dispersed pattern, with 410 regions displaying a spread‐out pattern of predicted disordered residues, and only 253 regions predicted to be completely ordered. This supports the conclusion that domain wobble is probably rare, and it is more likely that many of these regions are conditionally or partially disordered.
We drew the following conclusions for this section:
Conflicting regions that are predicted to be 100% ordered still display composition bias toward flexibility.
Long missing regions rarely display a predicted hinge pattern that would be suggestive of domain wobble.
Static disorder and domain wobble are probably rare in the PDB.
Conclusions
We have introduced a method for easily creating and categorizing a dataset of missing regions when there are multiple PDB chains attached to a single UniProt identifier. This classification scheme further divides ambiguous regions, those where PDB structures disagree as to whether a given residue is missing or observed, into three categories: conflicting, contained, and overlapping. This classification scheme may be useful in the investigation of individual proteins, large sets of proteins, and the development and refinement of disorder prediction software. Furthermore, we have provided analysis that will help clarify the nature of ambiguous missing regions.
Our analysis provides further validation that there is a measurable difference between missing regions and observed regions, which indicates increased flexibility. Missing regions have a greater variation in secondary structure, an amino acid composition biased in favor of intrinsic disorder, and a significantly higher fraction of residues that are predicted to be disordered. Furthermore, it appears that the extent of these differences roughly scales with the level of ambiguity in the region. Fully conserved regions show the strongest indications of intrinsic disorder, followed by contained, overlapping, and conflicting patterns. However, our analysis also shows that ambiguity is more likely to arise as different PDB chains with the same sequence are exposed to greater environmental differences. Our results indicate that perfect conservation in a missing region should not necessarily be correlated to higher confidence that a region is intrinsically disordered. Variable lengths of the missing region between different files may be a very natural result when intrinsically disordered regions are exposed to different environments. Additionally, conflicting regions should not necessarily be discarded from IDP sets, as they may simply be an indication of conditional disorder placed within different contexts. In other words, whether the missing region displays a pattern of conservation, ambiguity, or conflict may in some cases be a function of the differences between the source files rather than the extent of the disorder. We found little evidence of static disorder and domain wobble, and suspect that the incidence is probably quite low. Instead, it is likely that the ambiguous regions in the PDB are a rich source of conditional and partial disorder.
In summary, results reported in our study support the following main conclusions:
In the majority of cases, the characteristics of missing regions indicate protein intrinsic disorder instead of static disorder, domain wobble, or experimental artifacts.
The presence of an ambiguous region and the degree of ambiguity in that region is more likely to indicate varying levels of conditional or partial disorder, rather than static disorder.
Materials and Methods
PDB files, PDB chains, and UniProt identifiers
PDB files contain coordinates for a molecular structure (usually a protein) in three‐dimensional space. A single file may have one structure, or it may contain multiple homogenous or heterogeneous structures in complex. Each structure is assigned a chain identifier, and in this study, we call these individual structures PDB chains, to distinguish them from the PDB file, which may contain multiple chains. In most cases, some or all of a PDB chain can be mapped to a UniProt identifier,28 which provides sequence information for the entire protein. However, it is often the case that the PDB chain does not contain the entire UniProt sequence, or it may happen that a single PDB chain contains mappings to multiple UniProt identifiers, or has additional non‐mapped residues. Therefore, we treat the PDB file, the PDB chain, and the UniProt identifier as three separate entities. A PDB file may be mapped to multiple PDB chains, a single UniProt identifier may be mapped to multiple PDB chains and multiple PDB files, and multiple UniProt identifiers may be mapped to a single PDB chain.
Parsing and preparation of the dataset
The initial dataset was obtained from the SIFTS project, which provides a mapping between PDB chains and UniProt identifiers29 (Supporting Information materials). This mapping allows us to match sequence regions between multiple PDB files with different residue numbering schemes. The missing residues and secondary structure assignments for each PDB file are available in a precompiled text file provided by the PDB (Supporting Information materials). By using this precompiled information, we were able to avoid directly parsing the PDB files, thus greatly simplifying the method. From this starting point, we performed the following filtering:
Remove obsolete PDB files and obsolete UniProt entries, and retain only X‐ray crystallography files of individual proteins, protein complexes, or proteins and nucleic acid complexes.
Remove any entries with unclear mappings between the UniProt and PDB files, or where the mapping spanned fewer than four residues.
Remove any PDB files that do not have any secondary structure information available.
Remove any PDB chain that was not a 100% match with the corresponding region of the mapped UniProt entry.
Remove any UniProt ID that does not have at least two corresponding PDB chains.
Remove any UniProt ID that had a sequence longer than 10,000 residues or that contained non‐standard amino acids (for consistency with disorder prediction).
Due to the growth of the PDB, we felt the initial dataset was large enough to be able to ensure that all regions of PDB chains could be perfectly aligned by sequence with the corresponding region of the UniProt sequence. Therefore, we hope to minimize any confounding effects from sequence variation, and include only true ambiguous regions. We also differ from previous studies in that we did not filter our dataset to remove homologs or fragments, nor did we filter based on date or resolution, as our primary objective was to provide a comprehensive survey of missing regions in the PDB.
Dataset statistics
Our final dataset consisted of 19,153 UniProt entries, representing 54,937 PDB files and 1,47,800 PDB chains. 5% of the residues were missing and 34% of the residues were uncharacterized, which means they were not crystallized in the experiment. Therefore, it is not surprising that the set of PDB chains was significantly shorter overall than the corresponding set of UniProt sequences. The shortest PDB chain was 4 residues in length, and the longest PDB chain was 4187 residues in length, with an average length of 250 residues across all PDB chains. The shortest UniProt sequence was 7 residues in length, and the longest was 7737 residues in length, with an average length of 419 residues.
The assignment of missing residues, uncharacterized residues, and secondary structure
We created a representative sequence of secondary structure assignments, uncharacterized residues, and missing residues for each PDB chain. Where a residue was not characterized, we used a dash character, where the residue was missing, we used an X character, and where the residue was observed but not assigned a secondary structure designation, we used a P character. The remaining secondary structure designations were from DSSP24, 25 [Table 1]. The PDB chains could then be directly aligned to compare the missing regions (Fig. 1).
In our analysis, we have considered both the individual residues in each PDB chain, as well as a single composite of the PDB chains that is attached to a residue position on the UniProt sequence. We distinguish these two by referring to a position in the UniProt entry that spans all associated PDB chains as a residue column or a residue position.
Execution of the method in python
An implementation of this method was written in the programming language Python using the Pandas data analysis library.30 It is available on GitHub at https://github.com/shellydeforte/PDB. The data used in the analysis, including the composite of secondary structures, missing regions, and uncharacterized regions, and the calculated disorder and binding scores, are available in the Supporting Information materials.
Amino acid composition
The amino acid composition was obtained from composition profiler31 using 10,000 bootstrap iterations. It is displayed using the flexibility index proposed by Vihinen et al.27
Disorder, binding, and MoRF predictions
We used ESpritz X‐ray,17 IUPred‐short,32, 33 and DynaMine16, 34 to predict intrinsic disorder in our dataset. We chose these predictors because they are all fast, perform well on short regions, and do not use multiple sequence alignments. Furthermore, each predictor used a different training set in its development, including a dataset based on missing regions in X‐ray crystal structures (ESpritz X‐ray), purely globular regions (IUPred Short), and NMR chemical shifts (DynaMine). We chose these predictors because we felt they would be best at highlighting distinct physicochemical features and would not be biased by specific sequence patterns that may be present in the PDB. However, because the ESpritz X‐ray training set was most likely to have crossover with our dataset, we compared the ESpritz X‐ray training set to our dataset and found that there were 2029 PDB chains in common, representing only 1.4% of our total dataset. Therefore, ESpritz X‐ray should not be overly biased toward our dataset.
In order to predict binding propensity and the presence of MoRFs, we used the DNA, RNA, and protein binding predictor DisoRDPbind,35 as well as the MoRF predictors ANCHOR36, 37 and a new fast version of MoRFpred.38 All disorder and binding scores were treated as binary (either ordered or disordered), with the threshold set based on published materials of the predictor in question.
GLOSSARY
Ambiguous/dual personality region: A missing region that is characterized by conflicting information concerning the presence of missing residues, between multiple PDB structures of the same sequence.
Dynamic disorder: Disorder that is characterized by missing regions that arise from perpetual motion at the backbone level, in a region of the crystallized protein. The presence of dynamic disorder does not necessarily indicate that this region is intrinsically disordered in vivo.
Static disorder: Disorder that is characterized by missing regions that arise for reasons other than dynamic disorder. These possibilities include an ensemble of stable structures, wobbling domains, and crystal packing imperfections. Static disorder is exclusive from intrinsic disorder.
Domain wobble: A missing region that arises from the wholesale movement of a structured domain, typically facilitated by a small flexible hinge.
Conditionally disordered region: An intrinsically disordered region that is structured under some circumstances and disordered under others.
Partially disordered region: An intrinsically disordered region that displays significant residual secondary structure.
Transient/cryptic disorder: Conditional intrinsic disorder that arises due to environmental triggers, and typically provides a functional advantage.
Conserved region: A missing region that is identical between all crystal structures.
Contained region: An ambiguous missing region where at least one crystal structure contains the full length of the missing region, and all others are contained within.
Overlapping region: An ambiguous missing region that is composed of multiple missing regions in crystal structures which overlap or are contiguous, where no one crystal structure contains a missing region that encompasses all.
Conflicting region: An ambiguous missing region where at least one crystal structure is fully observed in the region and one crystal structure is fully missing in the region.
Supporting information
Supporting Information
Supporting Information
Acknowledgment
S. DeForte would like to thank Michelle Welcks for her assistance with the implementation of the method in Python.
The authors declare no competing interests.
Brief Statement: This study demonstrates a novel way of examining missing regions in the Protein Data Bank (PDB) where multiple PDB structures are available for a single protein sequence and these structures show conflicting information between observed and missing residues. We found that ambiguity in the structural properties of a given region is common and the degree of ambiguity is proportional to the propensity toward disorder. Furthermore, we show that static disorder and wobbling domains are probably rare, and it is likely that most ambiguous regions are conditionally or partially disordered.
References
- 1. Arnone A, Bier CJ, Cotton FA, Day VW, Hazen EE, Richardson DC, Yonath A, Richardson JS (1971) A high resolution structure of an inhibitor complex of the extracellular nuclease of Staphylococcus aureus. I. Experimental procedures and chain tracing. J Biol Chem 246:2302–2316. [PubMed] [Google Scholar]
- 2. Bennett WS, Huber R (1984) Structural and functional aspects of domain motions in proteins. CRC Crit Rev Biochem 15:291–384. [DOI] [PubMed] [Google Scholar]
- 3. Garner E, Cannon P, Romero P, Obradovic Z, Dunker AK (1998) Predicting disordered regions from amino acid sequence: common themes despite differing structural characterization. Genome Inform Ser Workshop Genome Inform 9:201–213. [PubMed] [Google Scholar]
- 4. van der Lee R, Buljan M, Lang B, Weatheritt RJ, Daughdrill GW, Dunker AK, Fuxreiter M, Gough J, Gsponer J, Jones DT, Kim PM, Kriwacki RW, Oldfield CJ, Pappu RV, Tompa P, Uversky VN, Wright PE, Babu MM (2014) Classification of intrinsically disordered regions and proteins. Chem Rev 114:6589–6631. [DOI] [PMC free article] [PubMed] [Google Scholar]
- 5. Uversky VN, Oldfield CJ Dunker AK (2005) Showing your ID: intrinsic disorder as an ID for recognition, regulation and cell signaling. J Mol Recognit 18:343–384. [DOI] [PubMed] [Google Scholar]
- 6. Wright PE, Dyson HJ (2015) Intrinsically disordered proteins in cellular signalling and regulation. Nat Rev Mol Cell Biol 101:18–29. [DOI] [PMC free article] [PubMed] [Google Scholar]
- 7. Vucetic S, Brown CJ, Dunker AK, Obradovic Z (2003) Flavors of protein disorder. Proteins 52:573–584. [DOI] [PubMed] [Google Scholar]
- 8. Cozzetto D, Jones DT (2013) The contribution of intrinsic disorder prediction to the elucidation of protein function. Curr Opin Struct Biol 23:467–472. [DOI] [PubMed] [Google Scholar]
- 9. Bardwell JC, Jakob U (2012) Conditional disorder in chaperone action. Trends Biochem Sci 37:517–525. [DOI] [PMC free article] [PubMed] [Google Scholar]
- 10. Vacic V, Oldfield CJ, Mohan A, Radivojac P, Cortese MS, Uversky VN, Dunker AK (2007) Characterization of molecular recognition features, MoRFs, and their binding partners. J Proteome Res 6:2351–2366. [DOI] [PMC free article] [PubMed] [Google Scholar]
- 11. Jakob U, Kriwacki R, Uversky VN (2014) Conditionally and transiently disordered proteins: awakening cryptic disorder to regulate protein function. Chem Rev 114:6779–6805. [DOI] [PMC free article] [PubMed] [Google Scholar]
- 12. Zhang T, Faraggi E, Li Z, Zhou Y (2013) Intrinsically semi‐disordered state and its role in induced folding and protein aggregation. Cell Biochem Biophys 67:1193–1205. [DOI] [PMC free article] [PubMed] [Google Scholar]
- 13. He B, Wang K, Liu Y, Xue B, Uversky VN, Dunker AK (2009) Predicting intrinsic disorder in proteins: an overview. Cell Res 19:929–949. [DOI] [PubMed] [Google Scholar]
- 14. Li J, Feng Y, Wang X, Liu W, Rong L, Bao J (2015) An overview of predictors for intrinsically disordered proteins over 2010‐2014. Int J Mol Sci 16:23446–23462. [DOI] [PMC free article] [PubMed] [Google Scholar]
- 15. Sickmeier M, Hamilton JA, LeGall T, Vacic V, Cortese MS, Tantos A, Szabo B, Tompa P, Chen J, Uversky VN, Obradovic Z, Dunker AK (2007) DisProt: the database of disordered proteins. Nucleic Acids Res 35:D786–D793. [DOI] [PMC free article] [PubMed] [Google Scholar]
- 16. Cilia E, Pancsa R, Tompa P, Lenaerts T, Vranken WF (2013) From protein sequence to dynamics and disorder with DynaMine. Nat Commun 4:2741 [DOI] [PubMed] [Google Scholar]
- 17. Walsh I, Martin AJ, Di Domenico T, Tosatto SC (2012) ESpritz: accurate and fast prediction of protein disorder. Bioinformatics 28:503–509. [DOI] [PubMed] [Google Scholar]
- 18. Monastyrskyy B, Kryshtafovych A, Moult J, Tramontano A, Fidelis K (2014) Assessment of protein disorder region predictions in CASP10. Proteins 82 Suppl 2 :127–137. [DOI] [PMC free article] [PubMed] [Google Scholar]
- 19. Le Gall T, Romero PR, Cortese MS, Uversky VN, Dunker AK (2007) Intrinsic disorder in the Protein Data Bank. J Biomol Struct Dyn 24:325–342. [DOI] [PubMed] [Google Scholar]
- 20. Zhang Y, Stec B, Godzik A (2007) Between order and disorder in protein structures: analysis of “dual personality” fragments in proteins. Structure 15:1141–1147. [DOI] [PMC free article] [PubMed] [Google Scholar]
- 21. Lobanov MY, Galzitskaya OV (2011) Disordered patterns in clustered Protein Data Bank and in eukaryotic and bacterial proteomes. PLoS One 6:e27142. [DOI] [PMC free article] [PubMed] [Google Scholar]
- 22. Oldfield CJ, Xue B, Van YY, Ulrich EL, Markley JL, Dunker AK, Uversky VN (2013) Utilization of protein intrinsic disorder knowledge in structural proteomics. Biochim Biophys Acta 1834:487–498. [DOI] [PMC free article] [PubMed] [Google Scholar]
- 23. Walsh I, Giollo M, Di Domenico T, Ferrari C, Zimmermann O, Tosatto SC (2015) Comprehensive large‐scale assessment of intrinsic protein disorder. Bioinformatics 31:201–208. [DOI] [PubMed] [Google Scholar]
- 24. Touw WG, Baakman C, Black J, te Beek TA, Krieger E, Joosten RP, Vriend G (2015) A series of PDB‐related databanks for everyday needs. Nucleic Acids Res 43:D364–D368. [DOI] [PMC free article] [PubMed] [Google Scholar]
- 25. Kabsch W, Sander C (1983) Dictionary of protein secondary structure: pattern recognition of hydrogen‐bonded and geometrical features. Biopolymers 22:2577–2637. [DOI] [PubMed] [Google Scholar]
- 26. Shannon CE (1948) A mathematical theory of communication. Bell Syst Tech J 27:379–423. [Google Scholar]
- 27. Vihinen M, Torkkila E, Riikonen P (1994) Accuracy of protein flexibility predictions. Proteins 19:141–149. [DOI] [PubMed] [Google Scholar]
- 28. Consortium U (2014) Activities at the Universal Protein Resource (UniProt). Nucleic Acids Res 42:D191–D198. [DOI] [PMC free article] [PubMed] [Google Scholar]
- 29. Velankar S, Dana JM, Jacobsen J, van Ginkel G, Gane PJ, Luo J, Oldfield TJ, O'Donovan C, Martin MJ, Kleywegt GJ (2013) SIFTS: structure integration with function, taxonomy and sequences resource. Nucleic Acids Res 41:D483–D489. [DOI] [PMC free article] [PubMed] [Google Scholar]
- 30. McKinney W (2010) Data structures for statistical computing in Python. Proc 9th Python Sci Conf, pp. 51–56.
- 31. Vacic V, Uversky VN, Dunker AK, Lonardi S (2007) Composition Profiler: a tool for discovery and visualization of amino acid composition differences. BMC Bioinform 8:211 [DOI] [PMC free article] [PubMed] [Google Scholar]
- 32. Dosztányi Z, Csizmók V, Tompa P, Simon I (2005) The pairwise energy content estimated from amino acid composition discriminates between folded and intrinsically unstructured proteins. J Mol Biol 347:827–839. [DOI] [PubMed] [Google Scholar]
- 33. Dosztányi Z, Csizmok V, Tompa P, Simon I (2005) IUPred: web server for the prediction of intrinsically unstructured regions of proteins based on estimated energy content. Bioinformatics 21:3433–3434. [DOI] [PubMed] [Google Scholar]
- 34. Cilia E, Pancsa R, Tompa P, Lenaerts T, Vranken WF (2014) The DynaMine webserver: predicting protein dynamics from sequence. Nucleic Acids Res 42:W264–W270. [DOI] [PMC free article] [PubMed] [Google Scholar]
- 35. Peng Z, Kurgan L (2015) High‐throughput prediction of RNA, DNA and protein binding regions mediated by intrinsic disorder. Nucleic Acids Res 43:e121. [DOI] [PMC free article] [PubMed] [Google Scholar]
- 36. Mészáros B, Simon I, Dosztányi Z (2009) Prediction of protein binding regions in disordered proteins. PLoS Comput Biol 5:e1000376. [DOI] [PMC free article] [PubMed] [Google Scholar]
- 37. Dosztányi Z, Mészáros B, Simon I (2009) ANCHOR: web server for predicting protein binding regions in disordered proteins. Bioinformatics 25:2745–2746. [DOI] [PMC free article] [PubMed] [Google Scholar]
- 38. Yan J, Dunker AK, VN Uversky, L Kurgan (2016) Molecular recognition features (MoRFs) in three domains of life. Mol BioSyst. DOI: 10.1039/C5MB00640F. [DOI] [PubMed] [Google Scholar]
Associated Data
This section collects any data citations, data availability statements, or supplementary materials included in this article.
Supplementary Materials
Supporting Information
Supporting Information