Abstract
Brazzein (Brz) is a small (54 amino acid residue) sweet tasting protein with physical and taste properties superior to other non‐carbohydrate sweeteners. In an investigation of sequence‐dependent functional properties of the protein, we used NMR spectroscopy to determine the three‐dimensional structures and dynamic properties of two Brz variants: one with a single‐site substitution (D40K), which is three‐fold sweeter than wild‐type Brz, and one with a two‐residue insertion between residues 18 and 19 (ins18RI19), which is devoid of sweetness. Although the three‐dimensional folds of the two variants were very similar to wild‐type Brz, they exhibited local conformational and dynamic differences. The D40K substitution abolished the strong inter‐stand H‐bond between the side chains of residues Gln46 and Asp40 present in wild‐type Brz and increased the flexibility of the protein especially at the mutation site. This increased flexibility presumably allows this site to interact more strongly with the G‐protein coupled human sweet receptor. On the other hand, the Arg‐Ile insertion within Loop9–19 leads to distortion of this loop and stiffening of the adjacent site whose flexibility appears to be required for productive interaction with the sweet receptor.
Keywords: sweet protein, low calorie sweetener, human sweet receptor, dynamics, hydrogen bonding, nuclear magnetic resonance spectroscopy
Short abstract
Abbreviations
- Brz
wild‐type brazzein
- Brz‐D40K
mutation of Asp40 (D40) to Lys (K)
- Brz‐ins18RI19
brazzein variant with insertion of the di‐peptide Arg‐Ile between residues 18 and 19.
Introduction
Historically, table sugar (sucrose) has become a part of human life for improving taste quality as well as a rich source of energy. Excess intake of sugar leads to metabolic disorders such as obesity, type II diabetes, and increased risk of heart disease. Several popular artificial sweeteners, including aspartame, saccharin, sucralose, and neotame, have been developed as alternatives to sugar; however, the use of artificial, low‐calorie sweeteners has been linked to increased risk of type II diabetes.1 The search continues for naturally derived, low‐calorie sweeteners with high taste quality and minimal metabolic side effects.2
Brazzein (Brz), which was isolated originally from the fruit of West African plant, Pentadiplandra brazzeana Baillon, is one of the most promising candidates for a protein‐based, low‐calorie sweetener because of its high potency, structural stability, and excellent taste qualities.3, 4 We have developed approaches for producing recombinant Brz in large quantities for physiological, structural, and biophysical studies.5, 6 The predominant form Brz consists of 54 amino acid residues and is about 2,000 times sweeter than a 2% sucrose solution.7 Our NMR solution structures of Brz isolated from the fruit and of Brz produced recombinantly from Escherichia coli cells4, 8 were equivalent and showed that the protein adopts a cysteine‐stabilized αβ (CSαβ) fold stabilized by 17 inter‐strand α‐helical hydrogen bonds and four disulfide bridges. Together, these structural elements contribute to the high heat (100°C) and cold (−16°C) stability of Brz over a wide pH range (2.5–11.0).3, 5, 9, 10, 11 A recent X‐ray crystallographic study (PDB ID: 4HE7) of the protein yielded structural model that agreed with the solution structure (PDB ID: 2LY5) within< 0.8 Å rmsd for the Cα carbon atoms.12
Our previous studies identified three key sites of interaction between Brz and the human sweet receptor.7, 8, 13 Site 1 is located between Loop43 (between β‐strands I and II); Site 2 consists of the N‐ and C‐termini plus Glu36 and Loop33; and Site 3 consists of the loop between residues 9 and 19. We proposed a model in which Brz interacts through multiple binding points with Venus Fly Trap Model (VFTM) of T1R2 domain and the cysteine rich domain of T1R3 of the T1R2‐T1R3 hetero dimeric receptor complex.13, 14 However, because no high‐resolution structure has been determined for the human sweet receptor it has been challenging to pinpoint its exact interaction sites with Brz.
As a means for refining our understanding of structure‐function relationships of Brz, we describe the three‐dimensional solution structures and dynamic properties of two Brz variants, one (Brz‐D40K) that elicits three‐fold higher sweetness potency compared with wild‐type Brz and one (Brz‐ins18RI19) that elicits no sweetness7, 13 and compare their structure/dynamic properties to those of wild‐type Brz.
Results and Discussion
Solution structure of Brz‐D40K
The positions of the four disulfide (S‐S) bridges in Brz were previously determined by biochemical and biophysical experiments.4, 5, 11 Chemical shifts of 13Cα and 13Cβ of Cys residues are very distinctive and can be used to identify their oxidation state.15, 16 In Brz‐D40K, the cysteine 13Cβ chemical shifts were in the 35.5–45.7 ppm region indicating that all Cys side chains were oxidized and participating in S‐S bridges; the cysteine 13Cα chemical shifts of Brz‐D40K were in the 57.8–60.2 ppm chemical shift region expected for oxidized residues in α‐helices and 51.4–56.7 ppm chemical shift region expected for oxidized residues in β‐strands.
A total of 945 distance constrains derived from the cross peaks of three‐dimensional NOESY data, along with 64 dihedral angles derived from assigned 1H, 15N, 13Cα, 13Cβ, and 13C′ chemical shifts by the TALOS+17 were used along with the disulfide pairings to determine the three‐dimensional solution structure of Brz‐D40K (Fig. 1). The structure contains a mixed α/β fold very similar to that of Brz. The structure consists of three β‐strands [K5–V7 (β1), R33–K40 (β2), and N44–D50 (β3)] and two helices [V13‐Q17 (α1) and A19‐K30 (α2)] (Fig. 1). The three β‐strands are arranged in anti‐parallel orientation [β1(↑), β3 (↓), β2 (↑)], and disulfide bridges link different secondary structural elements: β1–β3, α1–β2, α2–β3, and α2–α3. The statistics for the structure (Table 1) attest to its high quality: 18.7 constraints per residue, 4.2 long‐range constraints per residue, backbone rmsd of 0.16 Å for regular secondary structures and 0.7 Å for all structured residues (4–50), and high quality factors (Z‐score, MolProbity clash scores, and Ramachandran scores).
Figure 1.
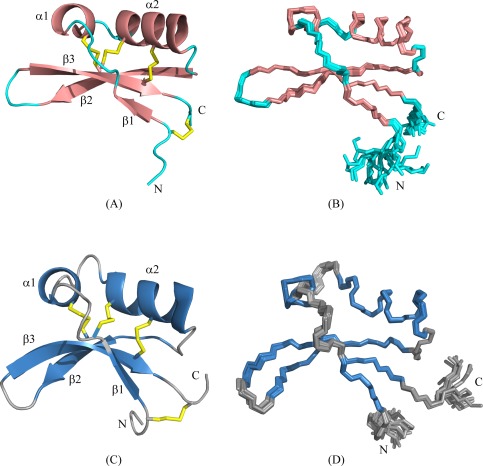
Solution NMR structures of the Brz variants. (A) The lowest energy CYANA conformer of Brz‐D40K showing the regular secondary structure elements in salmon color, flexible loops in cyan and the disulfide bridges in yellow color. (B) Overlay of the 20 lowest energy CYANA conformers of Brz‐D40K. (C) The lowest energy CYANA conformer of Brz‐ins18RI19 showing the regular secondary structure elements in sky blue color, flexible loops in gray, and the disulfide bridges in yellow color. (D) Overlay of the 20 lowest energy CYANA conformers of Brz‐ins18RI19. The N‐ and C‐terminals are denoted by N‐ and C‐, respectively.
Table 1.
Statistics for the NMR Structures of the Two Brazzein Variants
| Conformational restricting distance constraints | Brz‐D40K | Brz‐ins18RI19 |
|---|---|---|
| Intra residue [i = j] | 330 | 364 |
| Sequential [(i – j) = 1] | 279 | 245 |
| Medium Range [1 < (i – j) ≤ 5] | 119 | 144 |
| Long Range [(i – j) > 5] | 217 | 226 |
| Total | 945 | 979 |
| Dihedral angle constraints (°) | ||
| φ | 32 | 35 |
| ψ | 32 | 35 |
| Number of constraints per residue | 18.7 | 18.7 |
| Number of long‐range constraints per residue | 4.18 | 4.03 |
| CYANA target function (Å) | 1.36 ± 0.15 | 1.97 ± 0.12 |
| Average r.m.s.d. to the mean CYANA coordinates (Å) | ||
| Regular secondary structure elements, backbone heavy | 0.15 ± 0.07a | 0.12 + 0.03b |
| Regular secondary structure elements, all heavy atoms | 0.61 ± 0.09a | 0.68 + 0.07b |
| Backbone heavy atoms N, Cα, C′ | 0.16 ± 0.07c | 0.17 + 0.04d |
| All heavy atoms | 0.70 ± 0.09c | 0.75 + 0.06d |
| PROCHECK rawscore (φ and Ψ/all dihedral angles)27 | −0.67/−0.94e | −0.81/−1.05f |
| PROCHECK Z‐scores (φ and Ψ/all dihedral angles) | −2.32/−5.56e | −2.87/−6.21f |
| MOLPROBITY (raw score/Z‐score)28 | 13.03/−0.71e | 15.76/−1.18f |
| Ramachandran plot summary ordered residue ranges (%) | ||
| Most favored regions | 91.4e | 83.7f |
| Allowed regions | 8.2 | 13.2 |
| Disallowed regions | 0.4 | 3.1 |
| Average number of distance constraints violations per CYANA conformer [Å] | ||
| 0.2 – 0.5 | 0 | 0 |
| >0.5 | 0 | 0 |
| Average number of dihedral‐angle constraint violations per CYANA conformer > 5° | 0 | 0 |
Residues 4–8, 33–39, 45–50 (β strands), 12–17, 19–30 (α‐helices).
Residues 4–8, 35–41, 46–52 (β strands), 12–17, 22–32 (α‐helices).
Residues 4–50.
Residues 4–52.
Residues 4–53.
Residues 3–54.
Solution structure of Brz‐ins18RI19
Similar methods were used in determining the structure of Brz‐ins18RI19. The 13Cβ chemical shifts of the cysteine residues (36.0–45.0 ppm) served to verify that they were oxidized and in disulfide bridges. As expected, the cysteine 13Cα chemical shifts of residues in α‐helices were in the 57.8–60.2 ppm range and those in β‐strands were in the 51.4–56.7 ppm range. A total of 979 distance constrains along with 70 dihedral angle constraints and the di‐sulfide pairings were used to determine the solution structure of Brz‐ins18RI19 (Fig. 1), which is similar to the structures of Brz and Brz‐D40K. The structure consists of three β‐stands [K5–V7 (β1), E38–D42 (β2), and R45–D52 (β3)] and two α‐helices [V13–Q17 (α1) and Q23–K32 (α2)]. The structural statistics (Table 1) are an indicative of a high quality structure: 18.7 constraints per residue, 4.0 long‐range constraints per residue, and a backbone rmsd of 0.12 Å for residues in regular secondary structures and 0.75 Å for all structured residues (4–52).
Comparison of the structures of Brz‐D40K and Brz‐ins18RI19with that of Brz
Comparison of 1H,15N‐HSQC spectra of each variant with that of wild‐type Brz revealed a number of differences in amide 1H and 15N chemical shifts [Fig. 2(A,B)]. These chemical shift differences could indicate changes in the local chemical environment or more significant structural perturbations between the two proteins. The weighted rmsd values of the chemical shifts of the amide protons for each variant from Brz calculated between the two isoforms are shown in Figure 3(C,D) and clearly indicate that the major differences are localized and occur at the mutational sites. The backbone coordinates for the 31 residues of Brz and Brz‐D40K involved in regular secondary structural elements overlay with an rmsd of 0.87Å, while those of Brz and Brz‐ins18RI19 overlay with an rmsd of 0.95 Å. The three‐dimensional folds of all three variants are essentially identical with the exception of loop regions (Site 1 in Brz‐D40K, and Site 3 in Brz‐ins18RI19).
Figure 2.
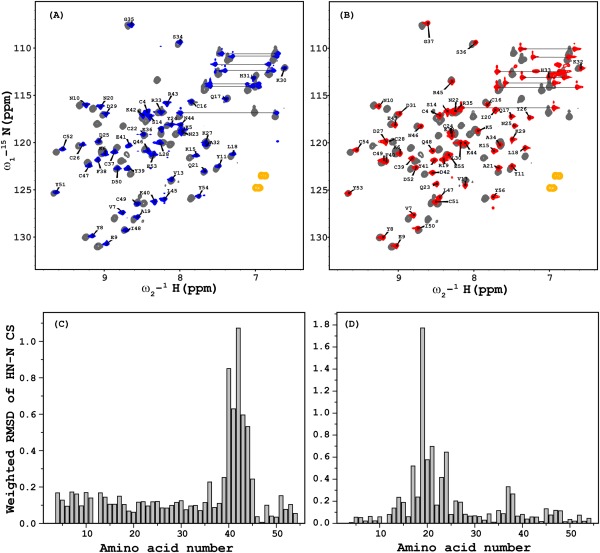
Overlay of 2D 1H‐15NHSQC spectra recorded on a Varian 600 MHz NMR spectrometer equipped with a cryogenic probe of (A) Brz‐D40K (blue) and Brz (gray) and (B) Brz‐ins18RI19 (red) and Brz (gray); the assigned amide resonances are labeled for mutants. Weighted rmsd chemical shift differences between the corresponding amide groups plotted against the corresponding amino acid number are shown for Brz‐D40K versus Brz (C) and Brz‐ins18RI19 vs.Brz (D). As expected, the largest chemical shift differences are observed at the amino acid substitution sites. The weighted rmsd was calculated using the formula ([0.5[Δδ(1HN)2+ (0.2 Δδ(15N))2]]1/2).
Figure 3.
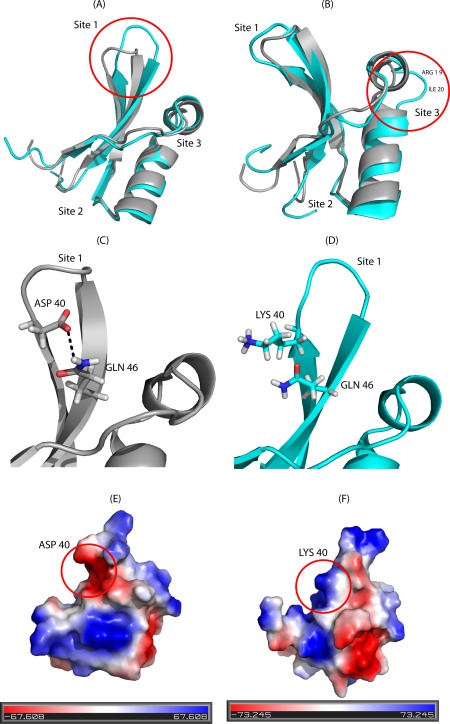
Comparison of the NMR structure of Brz with those of the sweeter variant (Brz‐D40K) and the non‐sweet variant (Brz‐ins18RI19). (A) Superposed lowest energy conformers of Brz‐D40K (cyan) and Brz (gray) (pdb id: 2LY5). The region of structural difference at Site 1 is shown by a red circle. (B) Superimposed lowest energy conformers of Brz‐ins18RI19 (cyan) and Brz (gray) (pdb id: 2LY5); the red circle encloses the Site 3 region in which the introduced dipeptide (RI) causes a bulge or extended loop exposed to solvent. (C) Side chain‐side chain H‐bond between D40 and Q46 observed in Brz (pdb id: 2LY5). (D) In Brz‐D40K, the side chain of Lys40 is solvent exposed. (E) Electrostatic potential surface Brz and (F) Brz‐D40K; the negative patch on the surface of Brz at residue 40 is replaced by a positive patch in Brz‐D40K.
Previously, we showed that Loop43 (Site1), which joins strands β1–β2, plays a critical role in interacting with subunits T1R2 and T1R3 of the sweet receptor to elicit the sweet response.8, 13 The structural difference in this loop is clearly depicted in Figure 3(A) to illustrate the key role of the D40K mutation in increasing the sweetness of Brz. In wild‐type Brz, the side chain carboxylate of D40 interacts with the side chain amide of Q46 to form a strong inter‐strand side chain‐side chain H‐bond as shown in Figure 3(C). This side chain interaction is also confirmed in the Brz‐ins18RI19 variant by the observation of NOESY cross peaks linking HB2/HB3 of D42 with HE2/HE3 of Q48. This key H‐bond interaction appears to rigidify this part of the protein in Brz, while its loss in Brz‐D40K results in increased mobility and solvent accessibility along with a more “closed” conformation in the Loop43 region [Fig. 3(D)]. Thus, in Brz‐D40K, this site becomes more accessible possibly allowing for electrostatic interaction between the side chains of K40 and R2‐D456 of the T1R2 receptor as predicted by the wedge model proposed by Temussi (Fig. 6).18 In this model, the distance between the γ‐carbon of D40 of Brz and the γ‐carbon of R2‐D456 is < 5 Å. Substitution of an acidic residue (D40) with a basic residue (K40) allows for a more favorable interaction with R2‐D456, and this likely accounts for the increased sweetness of this variant. The electrostatic potential maps [Fig. 3(E,F)] clearly show that the negatively charged surface patch near residue 40 in Brz is replaced by a positively charged surface patch in Brz‐D40K, which may interact more effectively with the negatively charged surface of the sweet receptor near residue R2‐D456. Interaction with R2‐D456 may also explain why the double mutant (Brz‐E41K/K42E) has enhanced sweetness over Brz.13 The double mutant moves the positively charged lysine side chain closer to the side chain of R2‐D456 according to the wedge model, and this enhanced interaction may be responsible for the increased sweet response.
Figure 6.
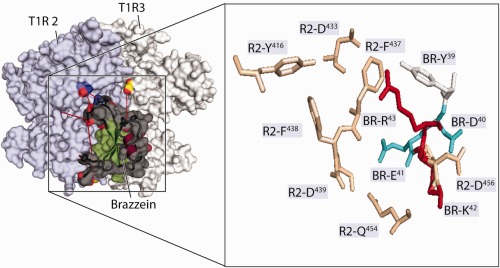
Wedge model of the interaction of Brz the subunits of the hetero‐dimeric human sweet receptor. Shown are homology models of the VFTMs of subunits T1R2 (light blue) and T1R3 (gray). The zoomed region inside the box shows Brz side chain interaction sites (Site 3) with T1R2‐VFTM. The open cleft of T1R2 faces left, and the closed cleft of T1R3, which is behind T1R2 in this image, faces right. Some of the residues whose substitutions have been shown to alter Brz activity are shown as stick models. In the model, Brz is shown docked in proximity to areas of potential binding to the sweet receptor. Brz is bound to the back of T1R2 VFTM along the axis of its hinge region. BR‐D40 is located near R2‐D456. Brz residue numbers are designated by “BR,” and T1R2 residue numbers are designated by “R2.”
In the Brz‐ins18RI19 variant, the insertion of two residues between helices α1 and α2 increases the length of loop9–19 (Site3) but does not alter the overall conformation of the protein. However, the bulging of loop9–19 as shown in Figure 3(B) also changes the conformation of residues in Site 1 (Loop43), and this may be responsible for altering the site of interaction with the sweet receptor required for the sweet response.
Backbone dynamics of Brz‐D40K and Brz‐ins18RI19variants
It is well accepted that studying proteins in solution by NMR provides the means to elucidate their dynamic properties, which often play a crucial functional role. In the present work, we measured spin‐lattice relaxation (T 1) and spin‐spin relaxation (T 2) times and heteronuclear NOEs to investigate the role of dynamics in the sweet properties of the sweeter Brz‐D40K and the non‐sweet Brz‐ins18RI19 variants of Brz. Previously, we showed that the non‐sweet variant Brz‐R43A, which removes a positive charge at residue 43 in Site 1, decreases the backbone flexibility compared with Brz; this result provided the first correlation between the flexibility of Site 1 and sweet receptor activation.8, 19 Figures 4 and 5 show that both variants of Brz have T 1 values around 400 ms similar to wild‐type protein, whereas the average T 2 value is increased in Brz‐D40K (T 2 = 200 ms) as compared with Brz (T 2 = 190 ms), suggesting an increase of backbone motion. In particular, residues 35–42 from Site 1 of Brz‐D40K show much larger T 2 and smaller heteronuclear NOE values compared with Brz, indicating that this portion of the backbone is more flexible in Brz‐D40K than in Brz. These results are consistent with the loss in the Brz‐D40K variant of the interstrand H‐bond between the carboxylate and amide side chain groups of D40/Q46 present in Brz [Fig. 3(C,D)]. The increase inflexibility at Site 1, in addition to the positively charged residue (K40), correlate with the increased sweetness of Brz‐D40K. By contrast, the T 2 values for Brz‐ins18RI19 (T 2 = 175 ms) are decreased compared to Brz, indicating increased rigidity in the non‐sweet variant. In contrast to Brz‐D40K, Brz‐ins18RI19 shows less flexibility in Site 1 residues 35–42 (Fig. 5). Given that increased flexibility in Site 1 correlates with increased sweetness, the reduced flexibility of this region in Brz‐ins18RI19 may explain its inability to activate the sweet receptor.
Figure 4.
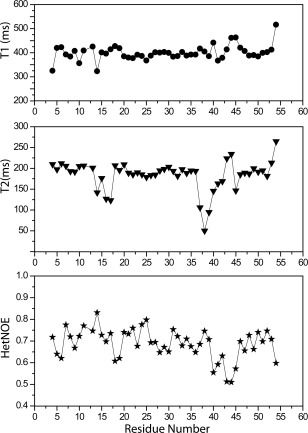
Spin‐lattice (T 1) and spin‐spin (T 2) relaxation times and heteronuclear NOE values for Brz‐D40K.
Figure 5.
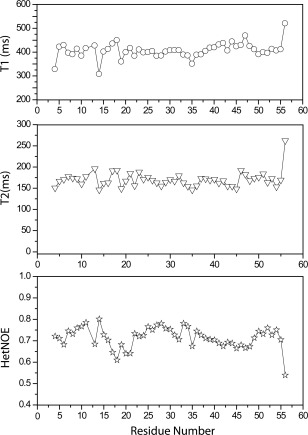
Spin‐lattice (T 1) and spin‐spin (T 2) relaxation times and heteronuclear NOE values for Brz‐ins18RI19.
The current NMR experimental data from the mutants are consistent with the newly proposed wedge model advanced by Temussi for the interaction of Brz with the sweet receptor.18 Figure 6 represents the interaction between of Site 1 of Brz and the homology model of the VFTMs of subunits T1R2 and T1R3 of the human sweet receptor. The zoomed region in Figure 6 shows interactions of Brz side chains (designated by “BR”) in loop 43 of Site 1 with residues of the VFTM of T1R2 (designated by “R2”). In this refined model, Brz is docked in proximity to the back of the clam‐shaped T1R2 subunit. This model is most consistent with our proposed multisite Brz‐receptor interaction model and observations using site directed mutations in T1R2 and functional activity assay.5 Several residues of Brz shown by mutagenesis to be critical for Brz activity are represented as stick models. The side chains BR‐D40 and BR‐E41 are shown to be in close proximity to those of R2‐D456 and R2‐Q454, respectively. From this model, it can be rationalized that conformational flexibility in Site 1 of Brz‐D40K is important for the formation of a salt bridge between BR‐K40 and R2‐D456 and for the complementary binding interaction with the back lobe of T1R2. Replacement of the negative patch at residue 40 in Brz by a positive patch in Brz‐D40K results in a clear alteration in the surface charge map, and this change may lead to increased activation of the receptor.
Conclusions
We have determined the solution structure and dynamics of the sweeter (Brz‐D40K) and non‐sweet (Brz‐ins18RI19) variants of Brz and have compared them to those of the wild‐type protein (Brz). All three proteins have a similar three‐dimensional fold. A key H‐bond present in Brz between the side‐chains of D40 and Q46 is lost in Brz‐D40K resulting in increased mobility, particularly in residues at Site 1, as shown by differences in the measured NMR relaxation parameters. This increased flexibility frees the side chain of K40 to make a proposed electrostatic interaction with D456 of subunit T1R2 of the sweet receptor that activates the receptor (Fig. 6). In Brz‐ins18RI19, the modification leads to a bulge in Loop9–19 of Site 3 causing a conformational change that leads to decreased flexibility of Loop43 of Site 1 as shown by NMR relaxation parameters. These alterations appear to be responsible for the failure of Brz‐ins18RI19 to elicit a sweet response. Our results suggest that interaction of Site 1 of Brz with the VFTM region of T1TR2 region is key to activating the receptor leading to a sweet response.
Materials and Methods
Protein production
Mutations were introduced into the synthetic gene coding for the SUMO‐Brz fusion as previously described.5 Brz samples labeled uniformly with 13C and 15N were produced as previously described.6 The variant Brz proteins were cleaved from the fusion by SUMO protease. The labeled proteins were purified by reversed‐phase high‐pressure liquid chromatography as previously described.5
NMR sample preparation
NMR samples contained 1.5 mM [U‐15N, U‐13C]‐Brazzein mutants in 90% H2O/10% 2H2O, with the pH adjusted to 5.2 by adding 0.1N NaOH or 0.1N HCl as needed.
NMR spectroscopy
NMR data were recorded at 25°C on a Varian 600 MHz spectrometer equipped with a cryogenic probe. A series of 2D 1H‐15N HSQC spectra were recorded to optimize the sample conditions by inspecting the chemical shift distribution and intensity of amide resonances. A series of 2D and 3D hetero nuclear NMR spectra were recorded and used to assign the backbone resonances. Initially, 2D 1H‐15N HSQC and 3D HNCO data sets were used to identify the number of spin systems, and these spin systems were used to pick the peaks in 3D HNCACB and 3D CBCA(CO)NH spectra that were subsequently used as input to the PINE server to determine sequence specific backbone resonance assignments.20 In addition, backbone resonance assignments were confirmed on the basis of 15N‐resolved 1H‐1H NOESY. 2D 1H‐13C HSQC, 3D HBHA(CO)NH, 3D HC(CO)NH, 3D C(CO)NH experiments were used to assign the side chain and HB and HA resonances. 3D 15N‐edited 1H‐1H NOESY (100 ms mixing time), and 3D 13C‐edited 1H‐1H NOESY (120 ms) experiments were used to derive the distance constraints to refine the three‐dimensional structure of protein.21 Standard pulse sequences were used to record steady state [1H]‐15N NOE and 15N relaxation (T 1, T 2) data.22 To determine the 15N T 1 values, multiple NMR spectra were recorded with relaxation delays of 50, 100, 200, 300, 400, 600, 800, 1000, 1300, and 1600 ms for Brz‐D40K and 10, 100, 200, 400, 600, 800, 1000, and 1400 for Brz‐ins18RI19. To determine 15N T 2 values, multiple NMR spectra were recorded with delays of 10, 30, 50, 70, 90, 110, 130, 150, 170, 190, and 230 ms for Brz‐D40K and 10, 30, 50, 70, 90, 110, 150, and 210 for Brz‐ins18RI19. The relaxation rates were calculated by least squares fitting of peak heights versus relaxation delay to a single exponential decay. The reported error estimates are standard deviations derived from fitting the data. Steady state [1H]‐15N NOE values were calculated from the ratio of peak heights in a pair of NMR spectra acquired with and without proton saturation.
Structure calculation and analysis
15N‐resolved 1H‐1H 3D NOESY and 13C resolved 1H‐1H 3D NOESY spectra were used to derive the intramolecular distance restraints used in the structure calculations. Backbone dihedral angle restraints φ and ψ were derived from assigned 1H, 15N, 13Cα, 13Cβ, 13C′ chemical shifts by using TALOS+ program.17 CYANA software versions 2.1/3.0 were used for automatic NOESY peaks assignments and structure calculation.23 NOESY peaks assigned automatically by CYANA were used as a guide to further refine the structure. Programs MOLMOL24 and PYMOL were used, respectively, to calculate the root mean square deviation (rmsd) and for graphical analysis.25 The PSVS server was used to check the quality of the structure.26
Accession numbers
The coordinates and NMR‐derived constraints have been deposited in the Protein Data Bank (www.wwpdb.org) as entries 2N66 and 2N69, for Brz‐D40K and Brz‐ins18RI19, respectively. Chemical shifts, have been deposited in the Biological Magnetic Resonance Bank (www.bmrb.wisc.edu) as entries 25753 and 25755, for Brz‐D40K and Brz‐ins18RI19, respectively.
Acknowledgments
NMR data were collected at the National Magnetic Resonance Facility (Madison). KKS acknowledges Dr. Jagdeesh, Dr. Kunwar, and the Director‐CSIR‐IICT for their continuous encouragement and support.
References
- 1. Suez J, Korem T, Zeevi D, Zilberman‐Schapira G, Thaiss CA, Maza O, Israeli D, Zmora N, Gilad S, Weinberger A, Kuperman Y, Harmelin A, Kolodkin‐Gal I, Shapiro H, Halpern Z, Segal E, Elinav E (2014) Artificial sweeteners induce glucose intolerance by altering the gut microbiota. Nature 514:181–186. [DOI] [PubMed] [Google Scholar]
- 2. Yang QH, Zhang ZF, Gregg EW, Flanders D, Merritt R, Hu FB (2014) Added sugar intake and cardiovascular diseases mortality among US adults. JAMA Intern Med 174:516–524. [DOI] [PMC free article] [PubMed] [Google Scholar]
- 3. Ming D, Hellekant G (1994) Brazzein, a new high‐potency thermostable sweet protein from Pentadiplandra brazzeana B. FEBS Lett 355:106–108. [DOI] [PubMed] [Google Scholar]
- 4. Caldwell JE, Abildgaard F, Dzakula Z, Ming D, Hellekant G, Markley JL (1998) Solution structure of the thermostable sweet‐tasting protein brazzein. Nat Struct Biol 5:427–431. [DOI] [PubMed] [Google Scholar]
- 5. Assadi‐Porter FM, Aceti DJ, Cheng H, Markley JL (2000) Efficient production of recombinant brazzein, a small, heat‐stable, sweet‐tasting protein of plant origin. Arch Biochem Biophys 376:252–258. [DOI] [PubMed] [Google Scholar]
- 6. Assadi‐Porter FM, Patry S, Markley JL (2008) Efficient and rapid protein expression and purification of small high disulfide containing sweet protein brazzein in E‐Coli. Protein Express Purif 58:263–268. [DOI] [PMC free article] [PubMed] [Google Scholar]
- 7. Assadi‐Porter FM, Aceti DJ, Markley JL (2000) Sweetness determinant sites of brazzein, a small, heat‐stable, sweet‐tasting protein. Arch Biochem Biophys 376:259–265. [DOI] [PubMed] [Google Scholar]
- 8. Cornilescu CC, Cornilescu G, Rao HY, Porter SF, Tonelli M, DeRider ML, Markley JL, Assadi‐Porter FM (2013) Temperature‐dependent conformational change affecting Tyr11 and sweetness loops of brazzein. Proteins Struct Funct Bioinform 81:919–925. [DOI] [PMC free article] [PubMed] [Google Scholar]
- 9. Assadi‐Porter FM, Abildgaard F, Blad H, Markley JL (2003) Correlation of the sweetness of variants of the protein brazzein with patterns of hydrogen bonds detected by NMR spectroscopy. J Biol Chem 278:31331–31339. [DOI] [PubMed] [Google Scholar]
- 10. Zhao GQ, Zhang Y, Hoon MA, Chandrashekar J, Erlenbach I, Ryba NJ, Zuker CS (2003) The receptors for mammalian sweet and umami taste. Cell 115:255–266. [DOI] [PubMed] [Google Scholar]
- 11. Kohmura M, Ota M, Izawa H, Ming D, Hellekant G, Ariyoshi Y (1996) Assignment of the disulfide bonds in the sweet protein brazzein. Biopolymers 38:553–556. [DOI] [PubMed] [Google Scholar]
- 12. Nagata K, Hongo N, Kameda Y, Yamamura A, Sasaki H, Lee WC, Ishikawa K, Suzuki E, Tanokura M (2013) The structure of brazzein, a sweet‐tasting protein from the wild African plant Pentadiplandra brazzeana. Acta Cryst D69:642–647. [DOI] [PubMed] [Google Scholar]
- 13. Assadi‐Porter FM, Maillet EL, Radek JT, Quijada J, Markley JL, Max M (2010) Key amino acid residues involved in multi‐point binding interactions between Brazzein, a sweet protein, and the T1R2‐T1R3 human sweet receptor. J Mol Biol 398:584–599. [DOI] [PMC free article] [PubMed] [Google Scholar]
- 14. Jiang P, Ji Q, Liu Z, Snyder LA, Benard LM, Margolskee RF, Max M (2004) The cysteine‐rich region of T1R3 determines responses to intensely sweet proteins. J Biol Chem 279:45068–45075. [DOI] [PubMed] [Google Scholar]
- 15. Wishart DS, Nip AM (1998) Protein chemical shift analysis: a practical guide. Biochem Cell Biol 76:153–163. [DOI] [PubMed] [Google Scholar]
- 16. Sharma D, Rajarathnam K (2000) 13C NMR chemical shifts can predict disulfide bond formation. J Biomol NMR 18:165–171. [DOI] [PubMed] [Google Scholar]
- 17. Shen Y, Delaglio F, Cornilescu G, Bax A (2009) TALOS+: a hybrid method for predicting protein backbone torsion angles from NMR chemical shifts. J Biomol NMR 44:213–223. [DOI] [PMC free article] [PubMed] [Google Scholar]
- 18. Temussi PA (2011) Determinants of sweetness in proteins: a topological approach. J Mol Recog 24:1033–1042. [DOI] [PubMed] [Google Scholar]
- 19. Assadi‐Porter F, Tonelli M, Radek JT, Cornilescu CC, Markley JL (2008) How sweet it is: detailed molecular and functional studies of brazzein, a sweet protein and its analogs. ACS Sym Ser 979:560–572. [Google Scholar]
- 20. Bahrami A, Assadi AH, Markley JL, Eghbalnia HR (2009) Probabilistic interaction network of evidence algorithm and its application to complete labeling of peak lists from protein NMR spectroscopy. PLoS Comput Biol 5:e1000307. [DOI] [PMC free article] [PubMed] [Google Scholar]
- 21. Sattler M, Schleucher J, Griesinger C (1999) Heteronuclear multidimensional NMR experiments for the structure determination of proteins in solution employing pulsed field gradients. Prog Nuclear Magn Reson Spect 34:93–158. [Google Scholar]
- 22. Kanelis V, Farrow NA, Kay LE, Rotin D, Forman‐Kay JD (1998) NMR studies of tandem WW domains of Nedd4 in complex with a PY motif‐containing region of the epithelial sodium channel. Biochem Cell Biol 76:341–350. [DOI] [PubMed] [Google Scholar]
- 23. Guntert P (2004) Automated NMR structure calculation with CYANA. Methods Mol Biol 278:353–378. [DOI] [PubMed] [Google Scholar]
- 24. Koradi R, Billeter M, Wuthrich K (1996) MOLMOL: a program for display and analysis of macromolecular structures. J Mol Graph 14:51. [DOI] [PubMed] [Google Scholar]
- 25. DeLano WL (2009) PyMOL molecular viewer: updates and refinements. Abstr Pap Am Chem S 238. [Google Scholar]
- 26. Bhattacharya A, Tejero R, Montelione GT (2007) Evaluating protein structures determined by structural genomics consortia. Proteins 66:778–795. [DOI] [PubMed] [Google Scholar]
- 27. RA Laskowski, MW MacArthur, DS Moss, JM Thornton (1993) PROCHECK: A Program to Check the Stereochemical Quality of Protein Structures. J Appl Cryst 26 (Part II):283–291. [Google Scholar]
- 28. VB Chen, WB Arendall, JJ Headd, DA Keedy, RM Immormino, GJ Kapral, LW Murray, JS Richardson, DC Richardson (2010) MolProbity: all‐atom structure validation for macromolecular crystallography. Acta Crystallogr D Biol Crystallogr 66 (Pt 1):12–21. [DOI] [PMC free article] [PubMed] [Google Scholar]


