Abstract
A reversible green fluorogenic protein‐fragment complementation assay was developed based on the crystal structure of UnaG, a recently discovered fluorescent protein. In living mammalian cells, the nonfluorescent fragments complemented and rapidly became fluorescent upon rapamycin‐induced FKBP and Frb protein interaction, and lost fluorescence when the protein interaction was inhibited. This reversible fluorogenic reporter, named uPPI [UnaG‐based protein‐protein interaction (PPI) reporter], uses bilirubin (BR) as the chromophore and requires no exogenous cofactor. BR is an endogenous molecule in mammalian cells and is not fluorescent by itself. uPPI may have many potential applications in visualizing spatiotemporal dynamics of PPIs.
Keywords: protein‐protein interaction, fluorescent reporter, protein‐fragment complementation assay, green fluorescent protein
Introduction
Protein‐protein interactions (PPIs) are involved in the formation and dissociation of protein complexes that carry out almost every major biological process.1 Some have been identified biochemically, but global proteomic methods have identified many more putative protein associations.2, 3, 4 These methods will ultimately establish protein interactome.5, 6, 7, 8, 9 To gain a deeper understanding of PPIs in biological processes, it will be helpful to visualize their spatiotemporal dynamics using imaging‐based approaches.
To image PPIs, protein‐fragment complementation assay (PCA) was previously developed based on the discovery that two fragments of β‐galactosidase in E. coli complement and restore enzyme activity.10 Variants of the complementing β‐galactosidase fragments, which have sufficiently low affinity so that the complementation reports rather than drives association of test proteins, were later discovered.11 Such complementing β‐galactosidase fragments were demonstrated to monitor rapamycin‐induced formation of FKBP12 and FRAP protein complex in mammalian cells.12 PCA based on several other enzymes was also demonstrated to monitor FKBP and Frb complex formation, including dihydrofolate reductase,13 β‐lactamase,14, 15 luciferase,16 thymidine kinase,17 TEV (tobacco etch virus) protease.18 Nonenzymatic protein‐based PCA, such as ubiquitin, was also developed to sense protein interactions.19, 20
PCA based on fluorescent proteins enables us to visualize spatiotemporal dynamics of PPIs in living cells. The green fluorescent protein (GFP) from the jellyfish Aequorea victoria as well as its red homologs has been investigated as a candidate for PCA, but two main limitations have discouraged its use. First, complementation of GFP fragments is irreversible,21, 22 suggesting that the association is so strong that it may perturb interaction of test proteins. Second, the intrinsic association of the fragment pair results in high background fluorescence in the absence of interactions of linked test proteins.21, 22
Results and Discussion
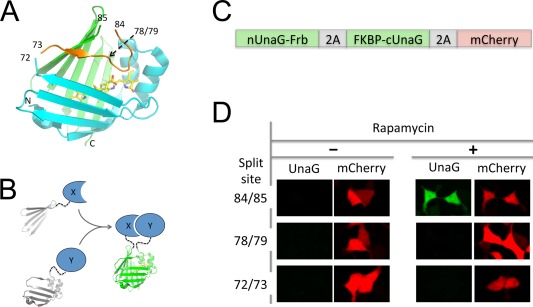
In this work, we describe a reversible green‐fluorescent PCA based on a fluorescent protein named UnaG that was recently cloned from Japanese eel.23 UnaG incorporates endogenous bilirubin (BR) as the chromophore and is green fluorescent. BR is a tetrapyrrole bilin and free BR is not fluorescent. It is derived from biliverdin by biliverdin reductase,24 and biliverdin is the immediate product of heme catabolism by heme oxygenase.25 UnaG belongs to the fatty‐acid‐binding protein family. UnaG is composed of two short alpha helices and ten beta strands forming a beta barrel. Based on the crystal structure, we identified a region between residues 72 and 85 that mainly forms a loop, like a “lid” sitting on top of the deeply buried chromophore [Fig. 1(A)] (Supporting Information Movies 1–3). We then selected three split sites: one on each end and one in the middle of the loop [Fig. 1(A)]. Each fragment pair was fused to two interacting proteins to test whether complementation restores fluorescence [Fig. 1(B)]. Specifically, the N and C‐terminal fragments of each pair were fused to Frb and FKBP, respectively [Fig. 1(C)]. To produce equal amounts of the two fragments and to have an internal control for each measurement, we engineered a construct that generated a polycistronic message that encodes both fragments and mCherry. The three coding sequences were separated by T2A sites [Fig. 1(C)], a “self cleaving” peptide.26
Figure 1.

Structure‐guided design of a reversible green fluorogenic PCA. A. Structure‐guided selection of 3 split sites of UnaG. B. Schematic diagram of UnaG‐based PCA. C. Construct of Rapamycin‐inducible UnaG complementation assay. Frb and FKBP are fused to the two parts of split UnaG, separated by a T2A site. mCherry is coexpressed with a T2A site. D. Live cell imaging of the three split UnaG constructs.
Transfection of HEK293 cells, a human embryonic kidney cell line, for expression of the polycistronic construct yielded bright red mCherry fluorescence [Fig. 1(D)]. In the absence of rapamycin, no green fluorescence was observed for any of the three pairs, suggesting that the UnaG fragment pairs had low intrinsic affinity [Fig. 1(D)]. Upon addition of rapamycin, which induces association of FKBP and Frb, the fragment pair with split site between residues 84 and 85 became fluorescent [Fig. 1(D)]. We named this pair as uPPI (UnaG‐based PPI reporter). The other two fragment pairs did not fluoresce in the presence of rapamycin.
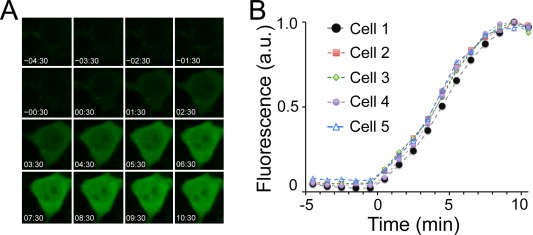
To examine the kinetics of uPPI fluorescence, we conducted time‐lapse fluorescence imaging on living HEK293 cells without addition of exogenous BR. We analyzed green fluorescence of five representative cells (Supporting Information Fig. S1) after addition of rapamycin (at t = 0 min.). Fluorescence was detected at 1 minute and plateaued within 10 minutes [Fig. 2(A)] (Supporting Information Movies 4–8), with a half‐maximal time value (T 1/2) ∼5 min [Fig. 2(B)]. In contrast, mCherry fluorescence was relatively stable (Supporting Information Movies 4–8) and normalization of green fluorescence to the red fluorescence of mCherry yielded similar values (Supporting Information Fig. S2). The rate of fluorescence acquisition for uPPI (T 1/2 = 5 min.) was significantly greater that the early GFP‐based PCA (T 1/2 = 50 min.).22 A recently developed split Venus based PCA showed 50–100% fluorescence increase at 10 min upon rapamycin induction,27 which is still significantly slower than uPPI. A possible reason for the kinetic difference is that whereas GFP requires chromophore maturation that can take up to an hour,28, 29 UnaG incorporates endogenous BR that is a preformed chromophore. uPPI, which is an intrinsically faster reporter than GFP‐based PCA, should therefore have better temporal resolution for monitoring PPIs.
Figure 2.

Kinetics of UnaG complementation assay upon formation of FKBP and Frb complex. A. Time‐lapse fluorescence images of HEK293 cells expressing the UnaG fragments. Numbers in images refer to time (minutes:seconds). B. Time‐dependent green fluorescence upon addition of rapamycin.
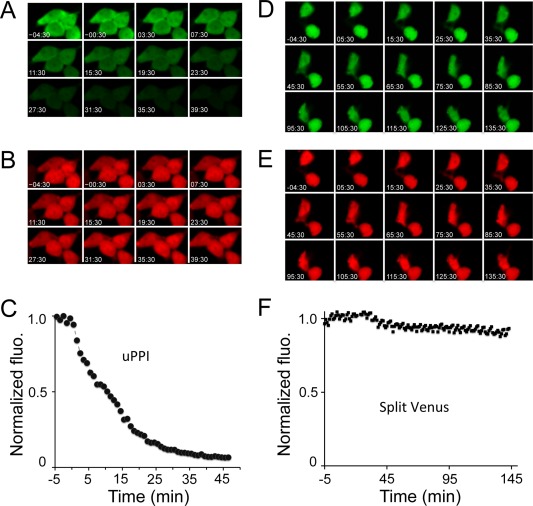
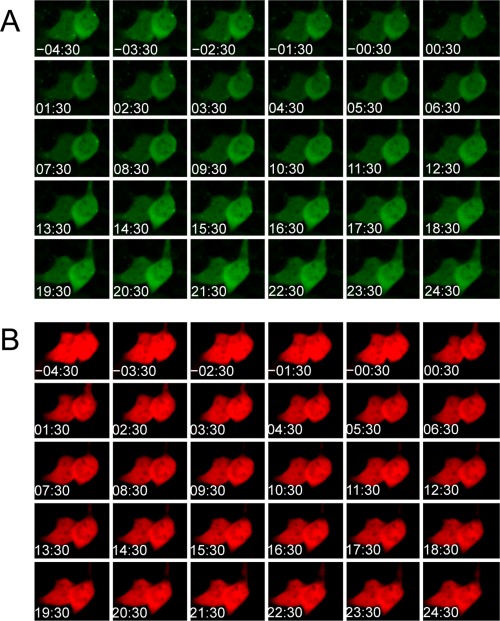
To investigate whether uPPI is reversible, we inhibited the FKBP and Frb interaction using FK506. Addition of FK506 decreased the green fluorescence over time [Fig. 3(A)] (Supporting Information Movie 9). As a comparison, the red fluorescence was relatively stable [Fig. 3(B)] (Supporting Information Movie 9). Kinetics of normalized green fluorescence by the red fluorescence averaged from a cluster of 4 cells (Supporting Information Fig. 3) revealed a T 1/2 = 9 min [Fig. 3(C)]. In contrast, the split Venus based PCA indicated that the fluorescence was irreversible [Fig. 3(D–F)] (Supporting Information Movie 10), which is consistent with previous studies.27, 30 As a control for uPPI, we also added buffer solution without the inhibitor. Both green and red fluorescence was relatively stable [Fig. 4(A,B)] (Supporting Information Movie 11). These results indicate that uPPI fluorescence is reversible within 10 minutes of inhibition of PPI.
Figure 3.

Kinetics of UnaG complementation assay upon inhibition of FKBP and Frb complex. The cells were preincubated with 100 nM rapamycin, which was washed away before addition of the FKBP and Frb inhibitor FK506, followed by time lapse imaging. A. Time‐lapse green fluorescence images of HEK293 cells expressing the UnaG fragments. B. Time‐lapse red fluorescence images of HEK293 cells. C. Time‐dependent green fluorescence normalized by mCherry upon addition of the FKBP and Frb inhibitor FK506. D. Time‐lapse green fluorescence images of HEK293 cells expressing the split Venus fragments fused to FKBP and Frb. E. Time‐lapse red fluorescence images of HEK293 cells coexpressed with the split Venus fused to FKBP and Frb. F. Time‐dependent green fluorescence normalized by mCherry upon addition of the FKBP and Frb inhibitor FK506. Numbers in images (A ‐ D) refer to time (minutes:seconds).
Figure 4.

Kinetics of UnaG complementation assay upon addition of HBSS without FK506. A. Time‐lapse green fluorescence images of HEK293 cells expressing the UnaG fragments. B. Time‐lapse red fluorescence images of HEK293 cells. The cells were preincubated with 100 nM rapamycin, which was washed away before addition of HBSS without FK506. Numbers in images refer to time (minutes:seconds).
In summary, using a structure‐guided approach, we developed a reversible green‐fluorescent PCA that uses endogenous BR in mammalian cells. Our results indicate that uPPI overcomes the two main limitations of GFP‐based PCA: its fluorescence signal develops quickly upon the interaction of linked protein sequences with little background fluorescence, and it is reversible. Furthermore, since UnaG fluorescence is oxygen independent,23 uPPI might be useful for imaging protein interactions in cells under hypoxia. Recently a reversible infrared‐fluorescent PCA based on a bacterial phytochrome‐derived infrared fluorescent protein was reported.31 Together, it should now be possible to image two pairs of PPIs simultaneously, which is essential to visualize spatiotemporal dynamics of signaling pathways that are usually composed of more than two protein components.
Materials and Methods
Gene construction
All plasmid constructs were created by standard molecular biology techniques and confirmed by sequencing the cloned fragments thoroughly. Each Split‐UnaG construct consists of three components (FKBP‐cUnaG, nUnaG‐Frb, and mCherry), coexpressed using two Thosea asigna virus 2A‐cleavage sites (T2A). Restriction sites were added to give the following configuration: HindIII‐Kozak‐FKBP‐ClaI‐(SGG)x2‐KpnI‐cUnaG‐BamHI T2A EcoRI‐nUnaG‐XhoI‐(SGG)x2‐AscI‐Frb‐NotI T2A mCherry‐XbaI. The Split‐UnaG constructs were cloned into the pcDNA3.1 vector using HindIII/XbaI (Life Technologies) for mammalian expression. Codon optimized FKBP and Frb were gifts from James A. Wells (UCSF).
Mammalian cell cultures
The HEK293T/17 (ATCC CRL‐11268) was obtained from ATCC. Cells were passaged in Dulbecco's Modified Eagle medium supplemented with 10% Foetal Bovine Serum, nonessential amino acids, penicillin (100 units/mL) and streptomycin (100 μg/mL). All culture supplies were obtained from the UCSF Cell Culture Facility.
HEK293T/17 cells were transiently transfected with Split‐UnaG constructs with the calcium phosphate method. Cells were grown in 35 mm glass bottom microwell (14 mm) dishes (MatTek Corporation). Transfection was performed when cells were cultured to ∼40‐50% confluence. For each transfection, 4.3 μg of plasmid DNA was mixed with 71 μL of 1X Hank's Balanced Salts buffer (HBS) and 4.3 μL of 2.5M CaCl2. Cells were imaged 24 h after transient transfection, when they reached ∼90% confluency.
Confocal microscopy
For characterization of Split‐UnaG in cultured mammalian cells, transfected HEK293T/17 cells were imaged in 35 mm glass bottom microwell dishes on a Nikon Eclipse Ti inverted microscope equipped with a Yokogawa CSU‐W1 confocal scanner unit (Andor), a digital CMOS camera ORCA‐Flash4.0 (Hamamatsu), a ASI MS‐2000 XYZ automated stage (Applied Scientific Instrumentation) and a Nikon Plan Apo λ 20X air (N.A. 0.75) objective. Laser inputs were provided by an Integrated Laser Engine (Spectral Applied Research) equipped with laser lines (Coherent) 488 nm (6.3 mW) for Split‐UnaG imaging and 561 nm (3.5 mW) for mCherry imaging. The confocal scanning unit was equipped with the following emission filters: 525/50‐nm for Split‐UnaG imaging and 610/60‐nm for mCherry imaging. Images were acquired with exposure times of 2 s for Split‐UnaG and 500 ms mCherry, respectively. Image acquisition was controlled by the NIS‐Elements Ar Microscope Imaging Software (Nikon). Images were processed using the ImageJ software (NIH).
Characterization of split‐UnaG in cultured mammalian cells
HEK293T/17 cells transiently transfected with Split‐UnaG were imaged in 35 mm glass bottom dishes ∼24 h after transfection. For snapshots [Fig. 1(D)], Rapamycin+ samples had been treated with 100 nM rapamycin (Calbiochem) for 3 h prior to imaging. Cells were imaged in HBSS. Time‐lapse microscopy was performed with the aid of an environmental control unit incubation chamber (InVivo Scientific), which maintained at 37°C. For time‐lapse imaging of protein complementation (Fig. 2), cells were pre‐incubated in HBSS for 30 min. Rapamycin (100 nM) was added to the sample 4.5 min after the time‐lapse began and image acquisition continued for ∼10 min until the UnaG signal plateaued. Images were acquired every 1 min. For time‐lapse imaging of protein dissociation (Fig. 3), cells were pre‐incubated in rapamycin (100 nM) in HBSS for 1 h to induce strong UnaG signal. Cells were then washed twice with HBSS to remove unbound rapamycin. 500 nM FK506 (Enzo Life Sciences) was added to the sample 4.5 min after the time‐lapse began and continued for ∼40 min until the UnaG signal disappeared. For the split Venus, the imaging was continued for 150 min. Images were acquired every 1 min. As a control, buffer solution without FK506 was added to the washed sample, followed by similar imaging. The imaging parameters are described in the Confocal microscopy section.
Supporting information
Supporting Information
Supporting Information
Supporting Information
Supporting Information
Supporting Information
Supporting Information
Supporting Information
Supporting Information
Supporting Information
Supporting Information
Supporting Information
Supporting Information
Acknowledgment
The authors thank Bo Huang for the synthesized UnaG plasmid, James A. Wells for providing the FKBP and Frb plasmid and Thomas B. Kornberg for constructive comments.
References
- 1. Alberts B (1998) The cell as a collection of protein machines: preparing the next generation of molecular biologists. Cell 92:291–294. [DOI] [PubMed] [Google Scholar]
- 2. Babu M, Vlasblom J, Pu S, Guo X, Graham C, Bean BDM, Burston HE, Vizeacoumar FJ, Snider J, Phanse S, Fong V, Tam YYC, Davey M, Hnatshak O, Bajaj N, Chandran S, Punna T, Christopolous C, Wong V, Yu A, Zhong G, Li J, Stagljar I, Conibear E, Wodak SJ, Emili A, Greenblatt JF (2012) Interaction landscape of membrane‐protein complexes in Saccharomyces cerevisiae. Nature 489:585–589. [DOI] [PubMed] [Google Scholar]
- 3. Havugimana PC, Hart GT, Nepusz T, Yang H, Turinsky AL, Li Z, Wang PI, Boutz DR, Fong V, Phanse S, Babu M, Craig SA, Hu P, Wan C, Vlasblom J, Dar V, Bezginov A, Clark GW, Wu GC, Wodak SJ, Tillier ERM, Paccanaro A, Marcotte EM, Emili A (2012) A census of human soluble protein complexes. Cell 150:1068–1081. [DOI] [PMC free article] [PubMed] [Google Scholar]
- 4. Guruharsha KG, Rual J‐F, Zhai B, Mintseris J, Vaidya P, Vaidya N, Beekman C, Wong C, Rhee DY, Cenaj O, McKillip E, Shah S, Stapleton M, Wan KH, Yu C, Parsa B, Carlson JW, Chen X, Kapadia B, VijayRaghavan K, Gygi SP, Celniker SE, Obar RA, Artavanis‐Tsakonas S (2011) A protein complex network of Drosophila melanogaster. Cell 147:690–703. [DOI] [PMC free article] [PubMed] [Google Scholar]
- 5. Seebacher J, Gavin A‐C (2011) SnapShot: Protein‐protein interaction networks. Cell 144:1000, 1000.e1. [DOI] [PubMed] [Google Scholar]
- 6. Bonetta L (2010) Protein‐protein interactions: Interactome under construction. Nature 468:851–854. [DOI] [PubMed] [Google Scholar]
- 7. Perkel JM (2010) Protein‐protein interaction technologies toward a human interactome. Science 329:463–465. [Google Scholar]
- 8. Stumpf MPH, Thorne T, de Silva E, Stewart R, An HJ, Lappe M, Wiuf C (2008) Estimating the size of the human interactome. Proc Natl Acad Sci U S A 105:6959–6964. [DOI] [PMC free article] [PubMed] [Google Scholar]
- 9. Rual J‐F, Venkatesan K, Hao T, Hirozane‐Kishikawa T, Dricot A, Li N, Berriz GF, Gibbons FD, Dreze M, Ayivi‐Guedehoussou N, Klitgord N, Simon C, Boxem M, Milstein S, Rosenberg J, Goldberg DS, Zhang LV, Wong SL, Franklin G, Li S, Albala JS, Lim J, Fraughton C, Llamosas E, Cevik S, Bex C, Lamesch P, Sikorski RS, Vandenhaute J, Zoghbi HY, Smolyar A, Bosak S, Sequerra R, Doucette‐Stamm L, Cusick ME, Hill DE, Roth FP, Vidal M (2005) Towards a proteome‐scale map of the human protein‐protein interaction network. Nature 437:1173–1178. [DOI] [PubMed] [Google Scholar]
- 10. Ullmann A, Perrin D, Jacob F, Monod J (1965) Identification par complémentation in vitro et purification d'un segment peptidique de la β‐galactosidase d'Escherichia coli. J Mol Biol 12:918–923. [DOI] [PubMed] [Google Scholar]
- 11. Ullmann A, Jacob F, Monod J (1967) Characterization by in vitro complementation of a peptide corresponding to an operator‐proximal segment of the beta‐galactosidase structural gene of Escherichia coli. J Mol Biol 24:339–343. [DOI] [PubMed] [Google Scholar]
- 12. Rossi F, Charlton CA, Blau HM (1997) Monitoring protein‐protein interactions in intact eukaryotic cells by beta‐galactosidase complementation. Proc Natl Acad Sci U S A 94:8405–8410. [DOI] [PMC free article] [PubMed] [Google Scholar]
- 13. Pelletier JN, Campbell‐Valois FX, Michnick SW (1998) Oligomerization domain‐directed reassembly of active dihydrofolate reductase from rationally designed fragments. Proc Natl Acad Sci U S A 95:12141–12146. [DOI] [PMC free article] [PubMed] [Google Scholar]
- 14. Galarneau A, Primeau M, Trudeau L‐E, Michnick SW (2002) Beta‐lactamase protein fragment complementation assays as in vivo and in vitro sensors of protein protein interactions. Nat Biotechnol 20:619–622. [DOI] [PubMed] [Google Scholar]
- 15. Wehrman T, Kleaveland B, Her J‐H, Balint RF, Blau HM (2002) Protein–protein interactions monitored in mammalian cells via complementation of β‐lactamase enzyme fragments. Proc Natl Acad Sci U S A 99:3469–3474. [DOI] [PMC free article] [PubMed] [Google Scholar]
- 16. Paulmurugan R, Umezawa Y, Gambhir SS (2002) Noninvasive imaging of protein–protein interactions in living subjects by using reporter protein complementation and reconstitution strategies. Proc Natl Acad Sci U S A 99:15608–15613. [DOI] [PMC free article] [PubMed] [Google Scholar]
- 17. Massoud TF, Paulmurugan R, Gambhir SS (2010) A molecularly engineered split reporter for imaging protein‐protein interactions with positron emission tomography. Nat Med 16:921–926. [DOI] [PMC free article] [PubMed] [Google Scholar]
- 18. Wehr MC, Laage R, Bolz U, Fischer TM, Grünewald S, Scheek S, Bach A, Nave K‐A, Rossner MJ (2006) Monitoring regulated protein‐protein interactions using split TEV. Nat Methods 3:985–993. [DOI] [PubMed] [Google Scholar]
- 19. Fang D, Kerppola TK (2004) Ubiquitin‐mediated fluorescence complementation reveals that Jun ubiquitinated by Itch/AIP4 is localized to lysosomes. Proc Natl Acad Sci U S A 101:14782–14787. [DOI] [PMC free article] [PubMed] [Google Scholar]
- 20. Johnsson N, Varshavsky A (1994) Split ubiquitin as a sensor of protein interactions in vivo. Proc Natl Acad Sci U S A 91:10340–10344. [DOI] [PMC free article] [PubMed] [Google Scholar]
- 21. Hu C‐D, Kerppola TK (2003) Simultaneous visualization of multiple protein interactions in living cells using multicolor fluorescence complementation analysis. Nat Biotechnol 21:539–545. [DOI] [PMC free article] [PubMed] [Google Scholar]
- 22. Hu C‐D, Chinenov Y, Kerppola TK (2002) Visualization of interactions among bZIP and Rel family proteins in living cells using bimolecular fluorescence complementation. Mol Cell 9:789. [DOI] [PubMed] [Google Scholar]
- 23. Kumagai A, Ando R, Miyatake H, Greimel P, Kobayashi T, Hirabayashi Y, Shimogori T, Miyawaki A (2013) A bilirubin‐inducible fluorescent protein from eel muscle. Cell 153:1602–1611. [DOI] [PubMed] [Google Scholar]
- 24. Maines MD (2005) New insights into biliverdin reductase functions: Linking heme metabolism to cell signaling. Physiology 20:382–389. [DOI] [PubMed] [Google Scholar]
- 25. Kikuchi G, Yoshida T, Noguchi M (2005) Heme oxygenase and heme degradation. Biochem Biophys Res Commun 338:558–567. [DOI] [PubMed] [Google Scholar]
- 26. Szymczak AL, Workman CJ, Wang Y, Vignali KM, Dilioglou S, Vanin EF, Vignali DAA (2004) Correction of multi‐gene deficiency in vivo using a single “self‐cleaving” 2A peptide‐based retroviral vector. Nat Biotechnol 22:589–594. [DOI] [PubMed] [Google Scholar]
- 27. Robida AM, Kerppola TK (2009) Bimolecular fluorescence complementation analysis of inducible protein interactions: effects of factors affecting protein folding on fluorescent protein fragment association. J Mol Biol 394:391–409. [DOI] [PMC free article] [PubMed] [Google Scholar]
- 28. Tsien RY (2009) Constructing and exploiting the fluorescent protein paintbox (Nobel Lecture). Angew Chem Int Ed Engl 48:5612–5626. [DOI] [PubMed] [Google Scholar]
- 29. Tsien RY (1998) The green fluorescent protein. Annu Rev Biochem 67:509–544. [DOI] [PubMed] [Google Scholar]
- 30. Kodama Y, Hu C‐D (2010) An improved bimolecular fluorescence complementation assay with a high signal‐to‐noise ratio. Biotechniques 49:793–805. [DOI] [PubMed] [Google Scholar]
- 31. Tchekanda E, Sivanesan D, Michnick SW (2014) an infrared reporter to detect spatiotemporal dynamics of protein‐ protein interactions. Nat Methods 1–9. [DOI] [PubMed] [Google Scholar]
Associated Data
This section collects any data citations, data availability statements, or supplementary materials included in this article.
Supplementary Materials
Supporting Information
Supporting Information
Supporting Information
Supporting Information
Supporting Information
Supporting Information
Supporting Information
Supporting Information
Supporting Information
Supporting Information
Supporting Information
Supporting Information


