Abstract
Inbreeding (mating between relatives) can dramatically reduce the fitness of offspring by causing parts of the genome to be identical by descent. Thus, measuring individual inbreeding is crucial for ecology, evolution and conservation biology. We used computer simulations to test whether the realized proportion of the genome that is identical by descent (IBDG) is predicted better by the pedigree inbreeding coefficient (FP) or by genomic (marker-based) measures of inbreeding. Genomic estimators of IBDG included the increase in individual homozygosity relative to mean Hardy–Weinberg expected homozygosity (FH), and two measures (FROH and FE) that use mapped genetic markers to estimate IBDG. IBDG was more strongly correlated with FH, FE and FROH than with FP across a broad range of simulated scenarios when thousands of SNPs were used. For example, IBDG was more strongly correlated with FROH, FH and FE (estimated with ⩾10 000 SNPs) than with FP (estimated with 20 generations of complete pedigree) in populations with a recent reduction in the effective populations size (from Ne=500 to Ne=75). FROH, FH and FE generally explained >90% of the variance in IBDG (among individuals) when 35 K or more SNPs were used. FP explained <80% of the variation in IBDG on average in all simulated scenarios, even when pedigrees included 20 generations. Our results demonstrate that IBDG can be more precisely estimated with large numbers of genetic markers than with pedigrees. We encourage researchers to adopt genomic marker-based measures of IBDG as thousands of loci can now be genotyped in any species.
Introduction
Biologists have long recognized that inbred individuals (those whose parents are closely related) often have lower fitness than the offspring of unrelated parents (Darwin, 1868; Ives and Whitlock, 2002). The cumulative effects of inbreeding on individual fitness can reduce the population growth rate and the probability of persistence (O'Grady et al., 2006; Kenney et al., 2014). Effects of inbreeding on individual fitness and population dynamics make measuring individual inbreeding a crucial part of many studies in ecology, evolution and conservation biology.
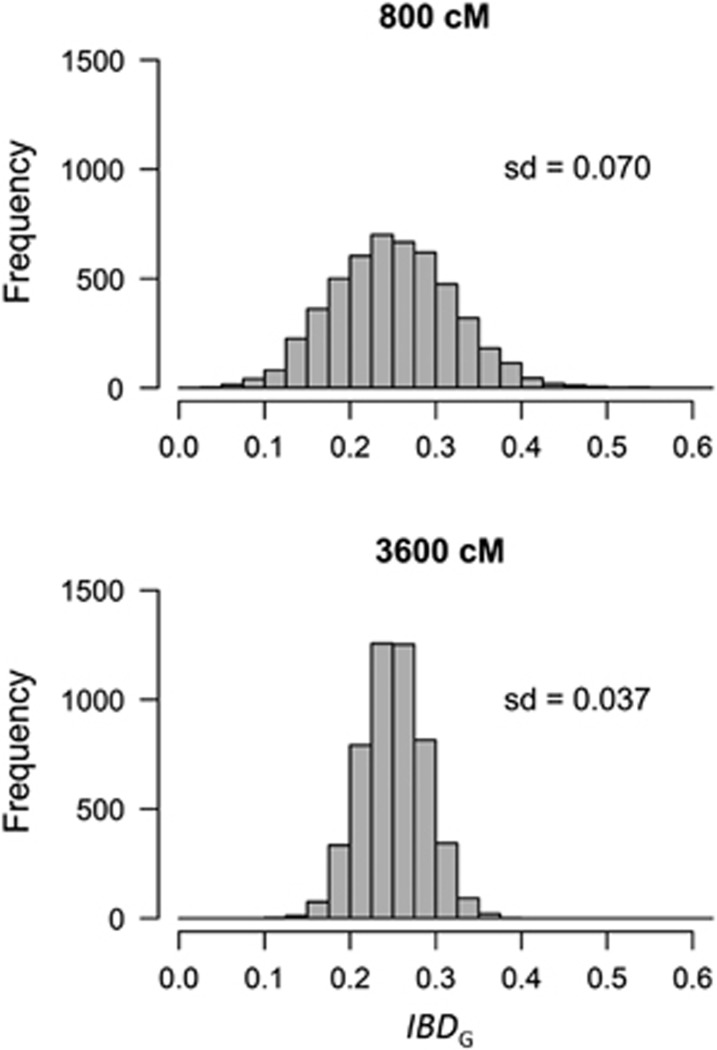
Inbred individuals have lower genome-wide heterozygosity because a fraction of loci are ‘identical by descent' (IBD). A locus is identical by descent if it carries two gene copies that both originated from a single copy in a common ancestor of the parents. All measures of individual inbreeding seek to predict the proportion of the genome that is identical by descent (IBDG). The classical measure of individual inbreeding is the pedigree inbreeding coefficient FP (Wright, 1922; Keller and Waller, 2002). FP predicts the IBDG due to the known common ancestors of parents and assumes that the pedigree founders are unrelated and non-inbred. FP has often been considered as the best measure of individual inbreeding (Pemberton, 2004, 2008). However, FP may be an imprecise measure of IBDG because IBDG can vary substantially among individuals with the same pedigree (for example, siblings, Figure 1 and Supplementary Figure S1) (Franklin, 1977; Hill and Weir, 2011; Forstmeier et al., 2012). The standard deviation of IBDG among individuals with the same pedigree is highest in species with few chromosomes and short genetic maps (Franklin, 1977; Stam, 1980; Hill and Weir, 2011; Figure 1 and Supplementary Figure S1). Furthermore, FP cannot account for inbreeding caused by distant ancestors not included in a pedigree.
Figure 1.
The distribution of IBDG among 5000 simulated offspring of full siblings with 20 chromosomes of equal length, and 800 cM (upper panel) or 3600 cM (lower panel) genomes.
The increasing availability of large-scale molecular genetic data might make it possible to more precisely estimate IBDG with genetic markers than with pedigrees (Keller et al., 2011; Hoffman et al., 2014). For example, IBDG can be estimated as the increase in individual homozygosity relative to Hardy–Weinberg expected homozygosity (FH) (Purcell et al., 2007). Other measures of IBDG use mapped genetic markers to identify IBD chromosome segments (referred to here as IBD tracts), which are characterized by long contiguous runs of homozygosity (ROH) at mapped genetic markers (Chapman and Thompson, 2003; McQuillan et al., 2008). The FROH statistic estimates IBDG as the proportion of the genome within inferred ROH that satisfy user-defined criteria (for example, number of SNPs, physical length and SNP density) (Purcell et al., 2007; McQuillan et al., 2012). Leutenegger et al. (2003) introduced a maximum likelihood estimator (FE) that uses mapped genetic markers and a hidden Markov model to identify putative IBD tracts and to estimate IBDG.
A thorough evaluation of the relative performance of pedigree- versus marker-based measures of IBDG in small populations would advance our understanding of how individual inbreeding should be measured in natural populations of conservation concern as we enter an era when thousands of loci can be genotyped for any organism. Using simulations, Keller et al. (2011) found that the number of homozygous rare alleles within an individual was more strongly correlated with marker-based measures of inbreeding than with FP. However, they simulated large populations with 220 cM genomes and only 2 chromosomes. Thus, their results likely underestimate the precision of FP as a measure of IBDG in humans and other species with much longer genetic maps and more chromosomes (Figure 1 and Supplementary Figure S1; Franklin, 1977).
Our objective was to test whether IBDG is predicted better by pedigrees or by genetic markers in small populations. Specifically, we evaluated the precision and bias of FP, FROH, FE and FH in small populations that are of the greatest concern for conservation with genomic characteristics typical of mammals. Our simulations accounted for the depth of the pedigree used to estimate FP, the number of markers used to estimate FROH, FE and FH, the genetic map length of the genome and demographic history. We emphasize comparisons of the performance of FP versus the marker-based measures of IBDG.
Materials and methods
Computer simulation model
We used a stochastic, individual-based simulation program (Kardos et al., 2014) for R version 3.0.1 (R Core Team, 2013). We simulated a sexually reproducing, random mating, non-selfing species with non-overlapping generations. We simulated hermaphrodites to avoid temporal fluctuations in the effective populations size (Ne) due to stochastic variation in the sex ratio. We simulated recombination and kept track of the ancestral origin of each chromosome segment, which was known to the base pair. We simulated genomic characteristics typical of mammals, including 3 Gb genomes with 20 chromosomes of equal size, and mutation with a base change probability of 1.2 × 10⁻⁸ per base pair per generation. We simulated only 20 chromosomes because chromosome number does not strongly affect the standard deviation of IBDG among individuals with the same pedigree σ(IBDG)) when genetic map lengths are in the range we simulated (Supplementary Figure S1). We used two different recombination rates to evaluate the effect of genetic map length on the precision of FP, FROH, FE and FH. We simulated genomes with 1.2 cM/Mb (that is, an average of approximately 0.012 recombinations per Mb per meiosis) which is similar to humans (Dumont and Payseur, 2008) and resulted in a genetic map length of 3600 cM. We also simulated genomes with 0.27 cM/Mb which is typical of the lower end of the distribution of recombination rates among mammals (Dumont and Payseur, 2008) and resulted in a genetic map length of 800 cM.
Our model of recombination follows the simulations of Chapman and Thompson (2003) and is based on Fisher's theory of junctions (Fisher, 1965). We assume no interference, that the number of crossovers along a chromosome is Poisson distributed, and that the recombination probability is constant across the genome and among individuals.
Population founders were unrelated and non-inbred. Thus, IBDG for an individual is relative to the population founders. Founders for each simulated population were drawn from a hypothetical source population in Hardy–Weinberg equilibrium. Allele frequencies at 400 K (K=1000) SNPs in the source populations were assigned so that the mean expected heterozygosity (He) was approximately 0.3 at the end of the simulations before SNP filtering steps (see below). To account for the effects of SNP heterozygosity (Miller et al., 2014) on our results, we repeated simulations of populations with 3600 cM genomes with founder allele frequencies assigned so that He was only approximately 0.2, and analyzed these data without filtering based on minor allele frequency (MAF) (beyond removing fixed loci). SNP positions were determined using a random number generator so that each nucleotide position in the genome was equally likely to be polymorphic in the source population. Individual founder genotypes were assigned by randomly choosing two alleles at each locus based on their frequencies in the source population (see Kardos et al., 2014 for further details on the assignment of founder genotypes). Simulation output included IBDG and genotypes at 300–350 K diallelic SNPs, which were left after removing loci with MAF<0.05 for each individual in the final generation. SNPs with MAF<0.05 were removed to maximize the information content of the genotypes. Statistical analyses were performed only on individuals from the last generation to hold the number of pedigree generations used to estimate FP constant among individuals within each analysis, and to hold the sample sizes for statistical tests constant across all simulations. An R script for the simulations is available in Dryad (see Data Accessibility).
Defining IBDG
We defined IBDG as the realized proportion of the physical genome in IBD tracts. IBDG was measured without error because the exact boundaries of IBD tracts were known to the base pair. Thus, IBDG is a parameter representing the true individual genomic inbreeding. The IBDG was calculated from the simulated genomic data once for each individual. The mean and variance of IBDG for each simulated scenario are shown in Supplementary Table S2.
Simulated demographic scenarios
We simulated two demographic scenarios to account for differences in the variance of IBDG, and to mimic populations where researchers are often interested in inbreeding and its effects on fitness. First, we simulated partially isolated populations with a constant local Ne of 75 for 150 generations, receiving occasional immigrants (m=0.013, one immigrant per generation on average). This scenario mimics small populations on habitat islands with occasional immigration from a large source population. Immigrants were unrelated to each other and to residents. Immigrants were drawn from the same hypothetical source population as the founders and thus had genotypes drawn from the same allele frequency distribution as the founders. Second, we simulated closed populations that were large (constant Ne=500) for 90 generations, and experienced a reduction in size to Ne=75 for 10 additional generations. We ran 20 replicate simulations for each scenario.
We wanted to test whether our results were substantially different when all inbreeding was due to recent ancestors. Therefore, we reran the simulations as described above, except now running the simulations for only 20 generations (not 100–150 generations as above). Here, all inbreeding is due to recent (within 20 generations) ancestors, and FP estimated with a 20 generation pedigree accounts for all common ancestors of parents. For these simulations, partially isolated populations had a constant local Ne of 75 for 20 generations, and received one immigrant per generation on average (m=0.013). Populations with recently reduced Ne were again closed (m=0) and had Ne=500 for the first 10 generations, then Ne=75 for the last 10 generations.
Linkage disequilibrium pruning
Before estimating FROH, FE and FH, we used the—indep-pairwise function in PLINK version 1.07 (Purcell et al., 2007) to reduce linkage disequilibrium among the 300–350 K SNPs remaining after MAF-based filtering. We conducted ‘LD pruning' because FE assumes all markers are in linkage equilibrium (Polašek et al., 2010). Additionally, FROH is typically estimated after LD pruning to avoid detecting fixed or nearly fixed ROH arising due to ancient population processes (for example, selective sweeps) (for example, McQuillan et al., 2012). For LD pruning, we used a sliding window of 25 SNPs, a step size of 10 SNPs and we removed one SNP from each pair in a window above the LD threshold of r2=0.5. Our results were not substantively affected by increasing the size of the sliding window for LD pruning to 50 SNPs, or by using a more stringent LD pruning threshold (r2=0.25) (data not shown).
We conducted statistical analyses on 500 SNPs to 100 K SNPs randomly sampled from those remaining after MAF- and LD-based filtering. We used only up to 100 K SNPs because preliminary simulations showed that using more loci did not substantively affect our results (data not shown). Mean He after filtering based on MAF and LD was 0.31 in partially isolated populations with 3600 cM genomes, and 0.33 on average in partially isolated populations with 800 cM genomes. He was 0.35 on average in populations with recently reduced Ne. These levels of SNP heterozygosity are similar to large SNP chip data sets from mammals and birds (for example, Deatwyler et al., 2010; Kawakami et al., 2014). In our simulations of populations with low heterozygosity SNPs (He≈0.2), the mean realized He after removing fixed loci and LD pruning was 0.21 in populations with recently reduced Ne and 0.19 in partially isolated populations.
Estimators of IBDG
We used three marker-based measures of IBDG. We used the—homozyg function in PLINK to estimate FROH using 5–100 K SNPs. PLINK uses a sliding window approach and user defined criteria to identify ROH, which are inferred to be putative IBD tracts. FROH is estimated as the proportion of the genome in ROH, and ranges from zero to one. Thus, FROH is directly proportional to IBDG. We used only ⩾5 K SNPs to estimate FROH because we believed that SNP density would be too low to reliably detect ROH when fewer loci are used, regardless of the parameter settings used in PLINK. For example, fewer than two SNPs are expected to occur in an 8-Mb IBD tract on average when only 500 randomly distributed SNPs are used in a 3-Gb genome. We adjusted the required number of SNPs and SNP density (maximum Kb per SNP on average within an ROH) per inferred ROH based on the number of loci used (Supplementary Table S1). We allowed a single heterozygous position in any inferred ROH to account for the occasional mutation occurring within otherwise IBD chromosome segments. Initial testing showed that adjusting PLINK parameters according to the number of SNPs and LD pruning substantially improved the performance of FROH when ⩽25 K SNPs were used. Consistent with our definition of IBDG above, we estimated FROH as the sum of the lengths of all detected ROH detected by PLINK divided by the physical genome size (3 Gb).
The second measure of IBDG we used (FH) measures the excess in the observed number of homozygous genotypes within an individual relative to the mean number of homozygous genotypes expected under random mating:
 |
where O(Homi) is the observed number of homozygous loci for the ith individual, andE(Hom)is the Hardy–Weinberg expected mean number of homozygous genotypes across m loci (Keller et al., 2011). The average O(Hom) is expected to equal E(Hom) on average in random mating populations. FH can thus take negative values (like some other marker-based measures of inbreeding or relatedness; Wang, 2014), and will be centered near zero in random mating populations when allele frequencies are taken from the current sample of individuals. FH should thus be considered as a proxy rather than a direct estimator of IBDG, which is a proportion with range 0–1. We estimated FH using the—het function in PLINK.
The third marker-based estimator (FE) is implemented in the program FEstim and uses maximum likelihood and a hidden Markov model to determine the values of IBDG that maximize the likelihood of the observed genotypes at mapped loci (Leutenegger et al., 2003). FE has a theoretical range of 0–1 and is thus directly proportional to IBDG. Starting values for both FE and the IBD rate of change parameter were 0.1. Default FEstim settings were used for other parameters. FEstim did not consistently run to completion on data from partially isolated populations when more than 10 K SNPs were used, even when using more stringent LD pruning settings in PLINK (LD threshold of r2=0.25, and a sliding window size of 50 SNPs). This is likely due to higher LD remaining among closely linked SNPs in the partially isolated populations than in populations with recently reduced Ne after LD pruning (Supplementary Figure S2). Using more stringent LD pruning thresholds (for example, r2=0.1) left too few SNPs to usefully compare FE and the other IBDG estimators. Thus, we present results from FE in partially isolated populations for 10 K and fewer SNPs only. Allele frequencies used to estimate FH and FE were from the 75 individuals in the last generation of each simulation. We used the kinship2 package in R to estimate FP for each individual using 3–20 generations of pedigree.
Comparing the performance of FP, FH, FE and FROH
We used the proportion of variance in IBDG explained by FROH, FE, FH and FP (r2) from linear regression models to evaluate the precision of FROH, FE, FH and FP (N=all 75 individuals from the last simulated generation). We conducted separate regressions of FROH, FH, FE and FP versus IBDG for individuals in the final generation of each simulated population. We used two-tailed t-tests to determine whether the mean r2 from regressions with IBDG (among 20 replicate simulations) was statistically significantly different for FROH, FH, FE and FP. We compared all possible combinations of pedigree depth (for FP) and number of SNP used (for FH, FE, and FROH) when testing if the mean r2 with IBDG was statistically significantly different for FP, FH, FE and FROH. We also used t-tests to determine whether the mean r2 from regressions with IBDG was statistically significantly different for FROH, FE, FH and FP when the genetic map length was 800 cM instead of 3600 cM, and when simulations were run for 20 generations instead of 100–150 generations.
We measured bias of the IBDG estimators as the mean amount by which FP, FH, FE and FROH over- or under-estimated IBDG (that is, the mean of the values of FP FH, FE or FROH minus IBDG). Note that FH is expected to underestimate IBDG when allele frequencies are taken from the current population and mating occurs at random. Thus, we expect FH to underestimate IBDG in our simulated random mating populations. We also wanted to measure bias of the estimated differences in IBDG among individuals. For this we estimated the ratio of the standard deviation of each of the estimators (FP, FH, FE and FROH) to the standard deviation of IBDG to measure bias of the estimated differences in IBDG among individuals. A ratio of the standard deviation of an estimator to the standard deviation of IBDG near 1 indicates that the estimated differences in IBDG among individuals are unbiased. Ratios of below or above 1 indicate that estimated differences in IBDG among individuals are substantially under- or overestimated.
Results
We first present results on the precision and bias of FP, FH, FE and FROH in simulations of 3600 cM genomes where inbreeding was due to both recent and distant ancestors (that is, simulations ran for 100–150 generations). We then summarize how the results change when inbreeding is due only to recent ancestors (that is, simulations ran for only 20 generations), when genetic map length is shortened to 800 cM, and finally when SNP He≈0.2 (instead of He≈0.3).
Precision of IBDG estimators
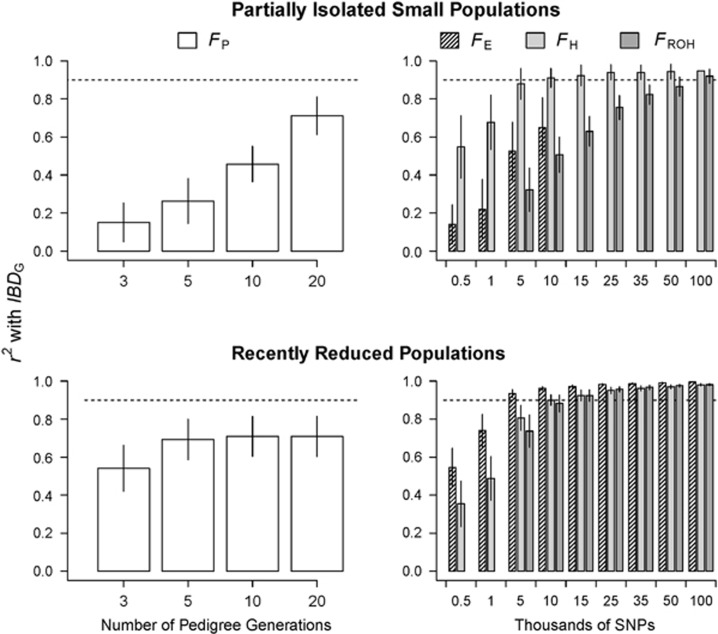
FP had low precision in both demographic scenarios (Figure 2). The mean r2 from regressions of FP versus IBDG across 20 simulation repetitions (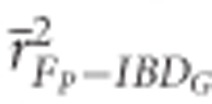 ) was 0.72 in partially isolated populations and 0.71 in populations with recently reduced Ne when pedigrees included 20 generations. Using more than five pedigree generations had little effect on
 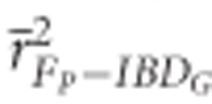 in populations with recently reduced Ne. However,
 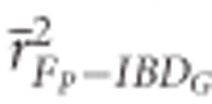 increased when deeper pedigrees were used in partially isolated populations.
Figure 2.
Barplots of the mean r2 (±1 s.d. among 20 simulated populations) from regressions of FP, FE, FH and FROH versus IBDG. The data shown are from 20 partially isolated populations (top row) and also 20 populations with recently reduced Ne (bottom row) and 3600 cM genomes. Dashed lines at r2=0.9 are to aid comparison of r2 for FP, FH, FE and FROH.
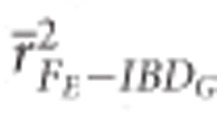
FROH and FH had high precision in both demographic scenarios when large number of SNPs were used. The mean r2 from regressions with IBDG was statistically significantly higher for FH (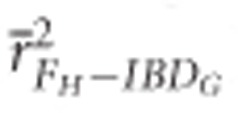 ) than for FE (
 ) or FROH (
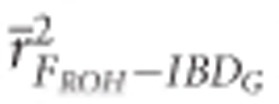 ) in partially isolated populations for all numbers of loci used (P<0.05, Figure 2).
 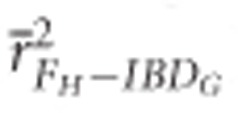 was >0.9 when 10 K or more SNPs were used in both demographic scenarios.
 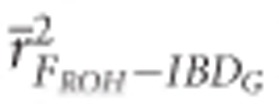 was >0.9 when 100 K SNPs were used in partially isolated populations, and when ⩾15 K SNPs were used in populations with recently reduced Ne.
 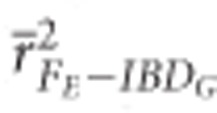 was always statistically significantly higher than
 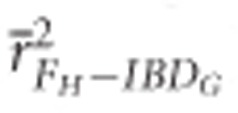 and
and  in populations with recently reduced Ne (P<0.001).
FROH, FE and FH were always more precise than FP when large numbers of SNPs were used. For example, 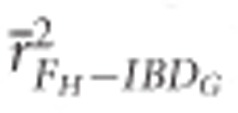 measured with ⩾5 K SNPs and
  measured with ⩾35 K SNPs were both statistically significantly higher than
 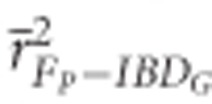 based on 20 generation pedigrees in partially isolated populations (P<0.001; Figure 2). The mean r2 from regressions with IBDG was statistically significantly higher for FROH, FE and FH estimated with ⩾10 K SNPs than for FP estimated with 20 generations in populations with recently reduced Ne (P<0.001).
Bias of IBDG estimators
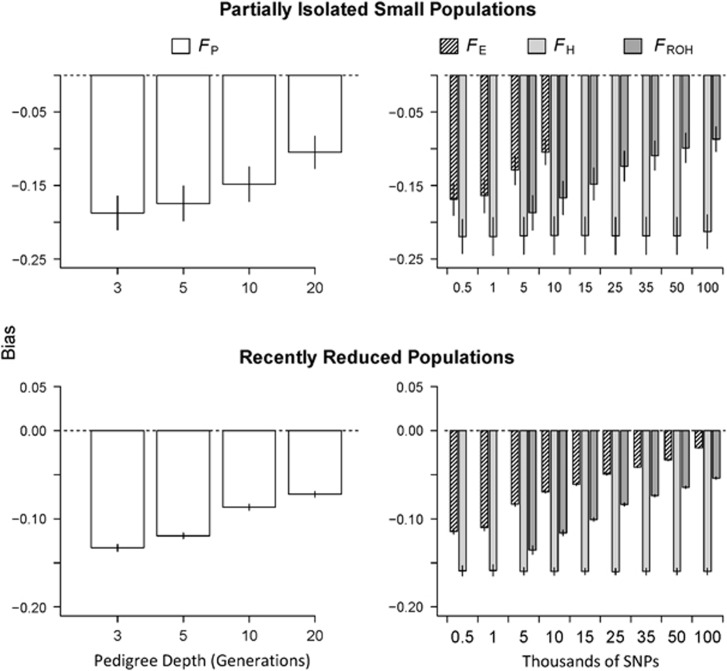
FP consistently underestimated IBDG in both simulated demographic scenarios (Figure 3). For example, FP underestimated IBDG by 0.19 with 3 generation pedigrees, and by 0.1 with 20 generation pedigrees on average in partially isolated populations. FP was less downwardly biased in populations with recently reduced Ne where FP underestimated IBDG by 0.13 and 0.07 on average when pedigrees included 3 and 20 generations, respectively.
Figure 3.
Barplots of the mean bias of FP, FH, FE and FROH (±1 s.d. among 20 simulated populations). Bias was measured as the mean error (FP, FH, FE or FROH minus IBDG) across all individuals in each simulated population. The data shown are from 20 partially isolated populations (top row) and 20 populations with recently reduced Ne (bottom row) and 3600 cM genomes.
Marker-based estimators were all substantially downwardly biased when few SNPs were used, and this downward bias was largest in partially isolated populations (Figure 3). FE and FROH became less downwardly biased when larger numbers of SNPs were used. For example, FE underestimated IBDG by 0.11 when 500 SNPs were used, and by only 0.02 when 100 K SNPs were used in populations with recently reduced Ne. FROH underestimated IBDG by 0.14 when 5 K SNPs were used, and by 0.05 on average when 100 K SNPs were used in populations with recently reduced Ne. FH was the most downwardly biased of all (P<0.0001) and the number of SNPs had no effect on bias. FH underestimated IBDG by 0.21 on average in partially isolated populations and by 0.16 in populations with recently reduced Ne.
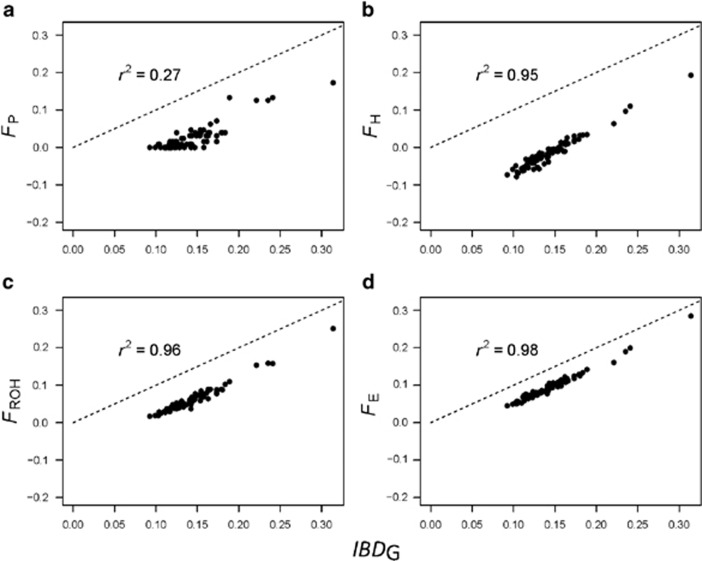
Both FE and FROH were less downwardly biased than FP in both demographic scenarios when large numbers of SNPs were used (Figure 3). FROH estimated with 10 K and 50 K SNPs was less downwardly biased than FP estimated with 3 and 20 generations, respectively, in populations with recently reduced Ne (P<0.0001). FE estimated with 500 and 10 K SNPs was less downwardly biased than FP estimated with 3 and 20 generations, respectively, in populations with recently reduced Ne (P<0.0001). FH had larger downward bias than FP in all cases (Figure 3). The precision and bias of FROH, FE, FH and FP relative to IBDG in a representative population is shown in Figure 4.
Figure 4.
FP (a), FH (b), FROH (c) and FE (d) versus IBDG in a population with recently reduced Ne and 3600 cM genomes. FP was estimated with five generations. FH, FE and FROH were estimated with 25 K SNPs. The dashed lines have intercept of zero and slope of one. Points below the lines represent underestimates of IBDG.
Bias in estimated differences in IBDG among individuals
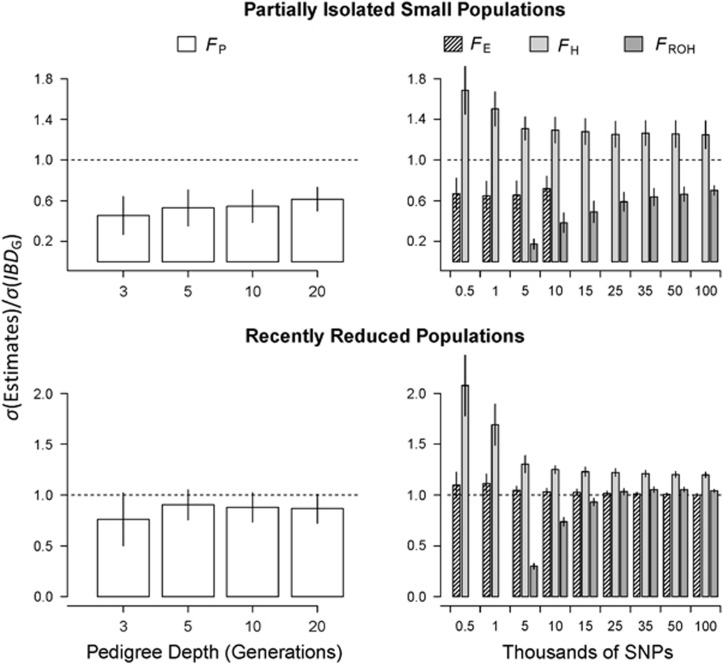
The mean ratio of the standard deviation of FP to the standard deviation of IBDG (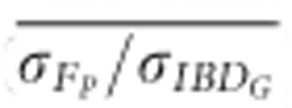 ) across 20 simulation repetitions was <1 in all scenarios (Figure 5).
  was 0.61 in partially isolated populations and 0.86 in populations with recently reduced Ne when pedigrees included 20 generations. Using pedigrees of more than five generations did not substantively affect
  in populations with recently reduced Ne.
Figure 5.
Ratios of the standard deviation of FP, FE, FH and FROH to the standard deviation of IBDG. The data shown are from partially isolated populations (top row) and populations with recently reduced Ne (bottom row) and 3600 cM genomes. The dashed lines represent a ratio of 1. Bars extending above and below the line represent over- and underestimates, respectively, of the difference in IBDG among individuals.
FH always overestimated the differences in IBDG among individuals, particularly when relatively few SNPs were used (Figure 5). For example, the mean ratio of the standard deviation of FH to the standard deviation of IBDG ( ) across 20 simulation repetitions was approximately 1.7 when 5 K SNPs were used, and 1.25 when 15 K SNPs were used in partially isolated populations.
The mean ratio of the standard deviation of FROH to the standard deviation of IBDG ( ) was consistently below 1 in partially isolated populations (Figure 5).
  was 0.70 when 100 K SNPs were used in partially isolated populations. However, in populations with recently reduced Ne,
  was approximately 1.05 on average when ⩾25 K SNPs were used (Figure 5). The mean ratio of the standard deviation of FE to the standard deviation of IBDG (
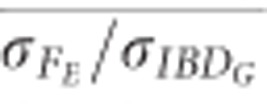 ) was 1.1 when 500 SNPs were used, and 1.0 when 100 K SNPs were used in populations with recently reduced Ne (Figure 5). However,
 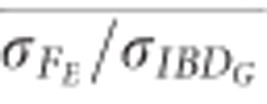 was approximately 0.72 with 10 K SNPs in partially isolated populations.
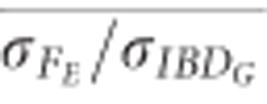 and
and  were always >
  when large numbers of SNPs were used (Figure 5). For example,
 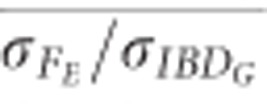 was statistically significantly higher than
  estimated with 20 generations when 10 K SNPs were used in partially isolated populations (P=0.009) and when ⩾500 SNPs were used in populations with recently reduced Ne (P<0.0001).
  was statistically significantly higher than
  estimated with 20 generations when 100 K SNPs were used in partially isolated populations (P=0.003), and when ⩾15 K SNPs were used in populations with recently reduced Ne (P⩽0.025).
In the following sections, we summarize how altering simulation parameters (genetic map length, number of simulated generations and SNP heterozygosity) caused results to differ substantially from those presented above. Detailed results from these scenarios are provided in Supplementary Figures S3–S14.
Effects of the genetic map length on precision and bias
 was always statistically significantly lower in populations with 800 cM genomes than in populations with 3600 cM genomes (P⩽0.005), except when pedigrees included only 3–5 generations in partially isolated populations (Figure 2 and Supplementary Figure S3). For example,
  based on three pedigree generations was 0.54 when the genetic map was 3600 cM, and 0.36 when the genetic map was 800 cM in populations with recently reduced Ne.
FE and FROH always had statistically significantly higher precision in partially isolated populations with 800 cM genomes than with 3600 cM genomes (P<0.002), with the exception of when FROH was estimated with 100 K SNPs (Figure 2 and Supplementary Figure S3). For example  and
and  were 0.83 and 0.88, respectively, when 10 K SNPs were used in partially isolated populations with 800 cM genomes. However,
  and
and  were 0.65 and 0.5, respectively, when 10 K SNPs in partially isolated populations with 3600 cM genomes. FROH and FE were often statistically significantly less downwardly biased when genomes were 800 cM instead of 3600 cM, but these differences in bias were always small (⩽0.06) (Figure 3 and Supplementary Figure S4).
 based on pedigrees including five or more generations was always statistically significantly lower when genomes were 800 cM than when genomes were 3600 cM in populations with recently reduced Ne (P⩽0.001; Figure 5 and Supplementary Figure S5). For example,
  based on pedigrees including five generations was 0.90 with 3600 cM genomes, and 0.75 with 800 cM genomes in populations with recently reduced Ne.
  was 0.2 units higher (closer to 1) on average in partially isolated populations with 800 cM genomes than in partially populations with 3600 cM genomes (P<0.0001, Figure 5 and Supplementary Figure S5).
  was 0.16 units higher (closer to 1) on average with 800 cM genomes than with 3600 cM genomes in partially isolated populations (P<0.002).
Performance of IBDG estimators when inbreeding is due only to recent ancestors
FP was imprecise when all inbreeding was due to recent ancestors (that is, in simulations run for only 20 generations). For example,  estimated with 20 generation pedigrees was 0.78 in partially isolated populations with 3600 cM genomes (Supplementary Figure S6) and 0.53 in partially isolated populations with 800 cM genomes (Supplementary Figure S9).
The precision of the marker-based measures of IBDG in 20 generation simulations was generally very similar to the results described above for simulations that ran for 100–150 generations (Supplementary Figures S6 and S9). However,  was considerably higher in partially isolated populations when the simulations ran for only 20 generations instead of 150 generations (Figure 2 and Supplementary Figure S6).
FROH, FE, FH and FP had lower bias in simulations that ran for only 20 generations (Supplementary Figures S7 and S10) than in simulations that ran for 100–150 generations (Figure 3 and Supplementary Figure S4). In particular, FP estimated with pedigrees including all 20 generations was unbiased, as expected when pedigree founders are unrelated and non-inbred.
The standard deviations of FROH, FE and FP more closely matched the standard deviation of IBDG in simulations of partially isolated populations that ran for only 20 generations instead of 150 generations (Figure 5 and Supplementary Figure S8). For example,  was always <0.65 in partially isolated populations with 3600 cM genomes simulated for 150 generations. However,
  was >0.8 when FP was estimated with ⩾5 generations of pedigree in partially isolated populations simulated for only 20 generations.
  and
and  were always <0.75 in partially isolated populations run for 150 generations. However, in partially isolated populations simulated for only 20 generations,
  was >0.9 for all numbers of loci used, and
  was >0.9 when FROH was estimated with 100 K SNPs.
Effects of SNP heterozygosity
FH and FROH were less precise in simulations with lower heterozygosity (He≈0.2) when relatively few loci were used. For example,  was 0.35 with He≈0.2 and 0.74 with He≈0.3 when 5 K SNPs were used in populations with 3600 cM genomes and recently reduced Ne (Figure 2 and Supplementary Figure S12). However, the number of SNPs necessary for high precision (r2⩾0.9) was unaffected by SNP heterozygosity for any of the marker-based measures of IBDG.
Discussion
Pedigrees have long been the preferred tool to measure individual inbreeding (Pemberton, 2004, 2008). However, we found that the realized IBD proportion of the genome (IBDG) is better predicted by large numbers of genetic markers than by pedigrees. Our results are consistent with two recent studies that used different approaches to evaluate the precision of marker- versus pedigree-based measures of individual inbreeding when using thousands of SNPs. Hoffman et al. (2014) found a moderately high correlation between heterozygosity estimated at >13 000 SNPs and FP (r2=0.74) in oldfield mice (Peromyscus polionotus). However, the predicted r2 between heterozygosity and IBDG (based on estimated identity disequilibrium in their oldfield mice) was ≈1; thus, IBDG was likely more precisely predicted by heterozygosity than by FP in their study population. Keller et al. (2011) found that the number of homozygous rare alleles within an individual was more strongly correlated with marker-based estimates of inbreeding than with FP in large simulated populations with short genetic maps (220 cM) and two chromosomes.
We expanded on previous work (Keller et al., 2011; Hoffman et al., 2014) by evaluating the performance of marker- and pedigree-based measures of IBDG using simulations where IBDG was known for each individual without error. Additionally, we accounted for variation in the genetic map length, population demography, heterozygosity of the genetic markers and pedigree depth. Finally, we specifically simulated relatively small populations that are of the greatest concern for conservation. Our results suggest that marker-based measures of IBDG computed from thousands of loci should be preferred over measures based on FP in future studies of inbreeding depression in natural populations.
Precision and bias
FP had low precision and underestimated the differences in IBDG among individuals in all simulated scenarios. Additionally, FP was always downwardly biased except when pedigrees included 20 generations in simulations that ran for only 20 generations and pedigree founders were thus unrelated and non-inbred (Supplementary Figures S7 and S10). Errors in FP have two major sources. As discussed above, σ(IBDG) can be high among individuals with the same pedigree (Figure 1; Franklin, 1977). High σ(IBDG) partially explains why multiple locus heterozygosity is usually only weakly related to FP, and may also explain why heterozygosity-fitness correlations are sometimes observed when FP-fitness correlations are absent (Forstmeier et al., 2012). Linkage and a finite genetic map length are expected to weaken the correlation between FP and IBDG, but not to cause FP to be downwardly biased.
The downward bias in FP can easily be explained by relatedness and inbreeding of pedigree founders. When founders are related, inbreeding due to common ancestors deeper in an individual's ancestry is not accounted for, thus causing FP to underestimate IBDG. FP will also underestimate IBDG for individuals whose parents have a common ancestor that is an inbred founder. Moving the base population further back in time (that is, including more generations in a pedigree) accounts for a larger proportion of the common ancestors of parents and the inbreeding of those common ancestors, thus decreasing the downward bias of FP (Figure 3 and Supplementary Figure S15). High variance in founder relatedness may reduce the precision of FP by causing variation among individuals in the magnitude of the underestimation of IBDG. A focus of future research should be to determine the relative influence of related or inbred pedigree founders versus linkage and recombination on the imprecision of FP.
All of the marker-based measures of IBDG were highly precise when large number of SNPs were used. Additionally, genetic markers showed lower bias than FP in estimated differences in IBDG among individuals. Thousands of SNPs can currently be typed for any organism, for example, with SNP chips (for example, Kawakami et al., 2014), restriction site-associated DNA sequencing (RAD-seq) (Davey et al., 2011), or by whole genome sequencing (Ellegren, 2014). These technologies along with the increasing number of whole genome reference assemblies make it possible to precisely measure IBDG with molecular markers in any species. Genotyping large numbers of SNPs is still expensive, but this cost will almost always pale in comparison with the expense and difficulty of obtaining deep pedigrees in free-ranging natural populations.
FH was always very strongly correlated with IBDG (r2 near or above 0.9) when 10 K or more SNPs were used (Figure 2 and Supplementary Figure S3). However, as expected, FH underestimated IBDG (Figure 3 and Supplementary Figure S4) and the magnitude of this bias was unaffected by the number of SNPs. This bias can be explained by a discrepancy between the assumed and actual base populations used to estimate FH (Wang, 2014). As mentioned above, FH can take negative values, and is expected to be centered near zero when allele frequencies are estimated from the current population and mating is random (for example, Figure 4). For FH to provide unbiased estimates of IBDG, allele frequencies must be derived from a base population where all individuals would be unrelated if mating occurred randomly (Supplementary Figure S16). Allele frequencies usually can only be estimated using the individuals for which inbreeding measurements are desired. Mean pairwise relatedness can be high in populations with small Ne (Wang, 2014), which are often the focus of studies of inbreeding and inbreeding depression. Thus, researchers should expect FH to substantially underestimate IBDG in most small natural populations.
FP consistently underestimated the differences in IBDG among individuals (Figure 5 and Supplementary Figure S5). This is likely due to pedigrees failing to account for the variation in IBDG due to distant ancestors, and linkage and recombination. We found that FROH and FE had lower bias than FP in estimated differences in IBDG among individuals when large numbers of SNPs were used (for example, Figure 5). Downward bias in estimates of the differences in IBDG (among individuals) might lead to overestimation of the strength of inbreeding depression (Keller, 1998) because of a greater decrease in fitness per unit increase in FP than per unit increase in IBDG. This suggests that the magnitude of inbreeding depression (that is, the number of lethal equivalents, Keller and Waller, 2002) might be overestimated in pedigree-based tests for inbreeding depression. However, estimates of the number of lethal equivalents might have lower bias when using FROH and FE with large numbers of SNPs. The statistical performance of marker- versus pedigree-based estimates of the strength of inbreeding depression should be formally evaluated in future research.
How many SNPs are needed?
The number of markers necessary for precise and low-bias estimates of IBDG in a particular study system will depend on the genome size, whether inbreeding due to distant ancestors is of interest, marker heterozygosity and proportion of missing genotypes, and the variance of IBDG. The ability to reliably detect IBD tracts depends on marker density (SNPs/cM); thus, the necessary number of markers increases with genome map length. Additionally, higher density markers are necessary to detect short IBD tracts caused by distant ancestors or a very high recombination rate (Supplementary Figure S17). The expected correlation between heterozygosity-based measures of individual inbreeding and IBDG increases with heterozygosity and the variance of IBDG (Miller et al., 2014). This was evident in our results where FROH and FH often had higher precision when He was high. Thus, more loci may be necessary for marker-based measures of IBDG to have higher precision than FP in studies where He is low.
The discussion above suggests that there is not a single number of loci that will always achieve high precision and low bias estimates of IBDG. Simulations with genomic and demographic parameters set to match a particular study system can be used to evaluate the number of markers necessary to precisely estimate IBDG. However, we believe the number of SNPs typically available with SNP chips or RAD-seq (⩾104 SNPs, Allendorf et al., 2010) should in most cases provide highly precise estimates of IBDG when used with one or more of the marker-based measures of IBDG included in the present study.
Effects of genetic map length on the performance of IBDG estimators
We found that the advantages of marker-based measures of IBDG over FP are greatest in organisms with short genetic map lengths. The reduced precision of FP among organisms with shorter map lengths is easily attributed to the higher σ(IBDG) because of fewer crossovers per meiosis on average (Franklin, 1977). Unlike FP, FE and FROH were often more strongly correlated with IBDG in populations with shorter genetic maps (Figure 2 and Supplementary Figure S3). The increased precision of FE and FROH in populations with shorter genetic maps likely occurs because the longer IBD tracts resulting from a lower recombination rate (Supplementary Figure S17) are more easily detected by the hidden Markov model and sliding window algorithms used to estimate FROH and FE. These results demonstrate that the marker-based measures of IBDG are sensitive to the higher variance in IBDG in organisms with shorter genetic maps. Therefore, marker-based measures of IBDG should be even more strongly preferred over FP in organisms with short genetic maps.
We simulated genomes typical of mammals in terms of the physical size (3 Gb), number of chromosomes and genetic map length (800–3600 cM; Dumont and Payseur, 2008). FP is will be less precise in species with shorter genetic maps or fewer chromosomes due to higher variance in IBDG among individuals with the same pedigree (Franklin, 1977; Supplementary Figure S1). Thus, the advantage of marker-based measures of IBDG over FP is expected to be greater in species with fewer chromosomes or shorter genetic maps. However, the precision of FP will increase in species with longer genetic maps or more chromosomes, and more loci will be required to have equivalent or higher precision than FP in such cases.
Relative value of FROH, FE and FH
The major advantages of FH are that it does not require mapped genetic markers and it was highly precise in all simulated scenarios when using as few as 10 K SNPs (Figure 2 and Supplementary Figure S3). Physical genome maps are currently available for few taxa (Ellegren, 2014). Therefore, our results are encouraging for studies on organisms lacking genome maps and have no choice but to measure individual inbreeding with unmapped loci (for example, Hoffman et al., 2014).
Though IBDG can be measured precisely with unmapped genetic markers, there are advantages to using mapped markers when they are available. In addition to showing high precision and low bias when large numbers of markers are used, FROH can distinguish inbreeding due to recent versus distant ancestors by including only specific ROH length categories in statistical analyses (for example, Kirin et al., 2010). Inbreeding depression could be caused mainly by inbreeding due to recent ancestors when a large fraction of deleterious recessive alleles are purged over many generations. For example, Szpeich et al. (2013) found that very long ROH (caused mainly by recent ancestors) was more highly enriched for deleterious recessive alleles than short ROH (caused mainly by distant ancestors) in humans. Therefore, tests for inbreeding depression may often be more powerful when FROH is estimated only with very long ROH. However, it could be important to account for inbreeding due to distant ancestors (for example, by including short ROH in FROH, or by using FE or FH) when purging is inefficient at removing the genetic load (for example, when inbreeding depression is caused by many deleterious recessive alleles with small effects).
FE had higher precision and often lower bias than FH and FROH when relatively few markers were used (for example, ⩽10 K SNPs) (Figures 2,3 and 5). Therefore, FE may often be the most powerful measure of IBDG in studies employing relatively few mapped SNPs. However, the current implementation of FE (FEstim) almost always failed to run to completion when >10 K SNPs were used in partially isolated populations, presumably due to high LD remaining among linked SNPs (Supplementary Figure S2). Lowering the Ne of the simulated populations from Ne=75 to Ne=20, which increases the magnitude of LD (Hill, 1981), resulted in FEstim failing to run to completion in the great majority of simulation repetitions in both demographic scenarios (data not shown). This suggests that studies of populations with very small Ne (where strong LD extends across the entire genome) will often be limited to using small numbers of SNPs with FEstim.
Assumptions and limitations
Our simulations assumed no crossover interference. However, interference can be strong in some vertebrates (Broman and Weber, 2000). We are not aware that the effects of interference on the spatial and length distributions of IBD tracts have been investigated. Therefore, it is unclear how interference affects the performance of pedigree- and marker-based measures of IBDG.
We also assumed pedigrees and genotypes were error free. However, genotyping (Pompanon et al., 2005) and pedigree errors (Pemberton, 2008) are common. Incorrect heterozygous versus homozygous calls will increase errors in marker-based statistics. Likewise, incorrect or missing parentage assignments will increase errors in FP (Pemberton, 2008). The effects of genotyping and pedigree errors were beyond the scope of this study. However, plausible rates of genotyping or pedigree errors should be considered in empirical inbreeding studies. Further, we did not simulate inbreeding depression. It is not clear how inbreeding depression, where the most highly inbred individuals are less likely to survive and be sampled in natural populations, might affect the performance of marker- and pedigree-based measures of IBDG. Finally, we simulated genetic markers with He in the approximate range of 0.2–0.3. Using loci with lower heterozygosity is expected to decrease the precision of marker-based estimates of IBDG.
Conclusions
Our results show that marker-based measures of IBDG are substantially more precise and often less biased than FP. This and other recent findings (for example, Hoffman et al., 2014; Keller et al., 2011) are in stark contrast to previous studies that used few genetic markers and did not consider the effects of linkage and recombination on the relative performance of pedigree- versus marker-based measures of inbreeding (for example, Balloux et al., 2004; Slate et al., 2004; Santure et al., 2010). The current explosion of DNA sequence data from non-model organisms is providing the tools necessary to precisely measure IBDG with genetic markers in any organism. We encourage researchers to adopt marker-based measures of IBDG as large numbers of markers and genome maps quickly become available for non-model organisms.
Data archiving
Our simulation program is available in Dryad: http://dx.doi.org/10.5061/dryad.f8p63.
Acknowledgments
MK was supported by the National Science Foundation (NSF) through the Montana Institute on Ecosystems (EPS-1101342) and the Montana Ecology of Infectious Diseases IGERT program (DGE-0504628). GL and FWA were partially supported by NSF grants DEB-0742181 and 1258203. GL was also partially supported by DEB-0723928. We greatly appreciate helpful comments from the reviewers.
The authors declare no conflict of interest.
Footnotes
Supplementary Information accompanies this paper on Heredity website (http://www.nature.com/hdy)
Supplementary Material
References
- Allendorf FW, Hohenlohe PA, Luikart G. (2010). Genomics and the future of conservation genetics. Nat Rev Genet 11: 697–709. [DOI] [PubMed] [Google Scholar]
- Balloux F, Amos W, Coulson T. (2004). Does heterozygosity estimate inbreeding in real populations? Mol Ecol 13: 3021–3031. [DOI] [PubMed] [Google Scholar]
- Broman KW, Weber JL. (2000). Characterization of human crossover interference. Am J Hum Genet 66: 1911–1926. [DOI] [PMC free article] [PubMed] [Google Scholar]
- Chapman N, Thompson E. (2003). A model for the length of tracts of identity by descent in finite random mating populations. Theor Popul Biol 64: 141–150. [DOI] [PubMed] [Google Scholar]
- Daetwyler H, Hickey J, Henshall J, Dominik S, Gredler B et al. (2010). Accuracy of estimated genomic breeding values for wool and meat traits in a multi-breed sheep population. Anim Prod Sci 50: 1004–1010. [Google Scholar]
- Darwin C. (1868) The Variation of Animals and Plants Under Domestication, Vol 2. Murray: London. [Google Scholar]
- Davey JW, Hohenlohe PA, Etter PD, Boone JQ, Catchen JM, Blaxter ML. (2011). Genome-wide genetic marker discovery and genotyping using next-generation sequencing. Nat Rev Genet 12: 499–510. [DOI] [PubMed] [Google Scholar]
- Dumont B, Payseur B. (2008). Evolution of the genomic rate of recombination in mammals. Evolution 62: 276–294. [DOI] [PubMed] [Google Scholar]
- Ellegren H. (2014). Genome sequencing and population genomics in non-model organisms. Trends Ecol Evol 29: 51–63. [DOI] [PubMed] [Google Scholar]
- Fisher RA. (1965) The Theory of Inbreeding, 2nd ed. Oliver & Boyd: Edinburgh. [Google Scholar]
- Forstmeier W, Schielzeth H, Mueller JC, Ellegren H, Kempenaers B. (2012). Heterozygosity–fitness correlations in zebra finches: microsatellite markers can be better than their reputation. Mol Ecol 21: 3237–3249. [DOI] [PubMed] [Google Scholar]
- Franklin I. (1977). The distribution of the proportion of the genome which is homozygous by descent in inbred individuals. Theor Popul Biol 11: 60–80. [DOI] [PubMed] [Google Scholar]
- Hill WG. (1981). Estimation of effective population size from data on linkage disequilibrium. Genet Res 38: 209–216. [Google Scholar]
- Hill WG, Weir BS. (2011). Variation in actual relationship as a consequence of Mendelian sampling and linkage. Genet Res 93: 47–64. [DOI] [PMC free article] [PubMed] [Google Scholar]
- Hoffman JI, Simpson F, David P, Rijks JM, Kuiken T, Thorne MA et al. (2014). High-throughput sequencing reveals inbreeding depression in a natural population. Proc Natl Acad Sci USA 111: 3775–3780. [DOI] [PMC free article] [PubMed] [Google Scholar]
- Ives AR, Whitlock MC. (2002). Inbreeding and metapopulations. Science 295: 454–455. [DOI] [PubMed] [Google Scholar]
- Kardos M, Allendorf FW, Luikart G. (2014). Evaluating the role of inbreeding depression in heterozygosity-fitness correlations: how useful are tests for identity disequilibrium? Mol Ecol Res 14: 519–530. [DOI] [PubMed] [Google Scholar]
- Kawakami T, Backström N, Burri R, Husby A, Olason P, Rice AM et al. (2014). Estimation of linkage disequilibrium and interspecific gene flow in Ficedula flycatchers by a newly developed 50k single-nucleotide polymorphism array. Mol Ecol Res 14: 1248–1260. [DOI] [PMC free article] [PubMed] [Google Scholar]
- Keller LF. (1998). Inbreeding and its fitness effects in an insular population of song sparrows (Melospiza melodia. Evolution 52: 240–250. [DOI] [PubMed] [Google Scholar]
- Keller LF, Waller DM. (2002). Inbreeding effects in wild populations. Trends Ecol Evol 17: 230–241. [Google Scholar]
- Keller MC, Visscher PM, Goddard ME. (2011). Quantification of inbreeding due to distant ancestors and its detection using dense single nucleotide polymorphism data. Genetics 189: 237–249. [DOI] [PMC free article] [PubMed] [Google Scholar]
- Kenney J, Allendorf FW, McDougal C, Smith JLD. (2014). How much gene flow is needed to avoid inbreeding depression in wild tiger populations? Proc Biol Sci 281: 20133337. [DOI] [PMC free article] [PubMed] [Google Scholar]
- Kirin M, McQuillan R, Franklin CS, Campbell H, McKeigue PM, Wilson JF. (2010). Genomic runs of homozygosity record population history and consanguinity. PLOS ONE 5: e13996. [DOI] [PMC free article] [PubMed] [Google Scholar]
- Leutenegger A-L, Prum B, Génin E, Verny C, Lemainque A, Clerget-Darpoux F et al. (2003). Estimation of the inbreeding coefficient through use of genomic data. Am J Hum Genet 73: 516–523. [DOI] [PMC free article] [PubMed] [Google Scholar]
- McQuillan R, Eklund N, Pirastu N, Kuningas M, McEvoy BP, Esko T et al. (2012). Evidence of inbreeding depression on human height. PLoS Genet 8: e1002655. [DOI] [PMC free article] [PubMed] [Google Scholar]
- McQuillan R, Leutenegger AL, Abdel-Rahman R, Franklin CS, Pericic M, Barac-Lauc L et al. (2008). Runs of homozygosity in European populations. Am J Hum Genet 83: 359–372. [DOI] [PMC free article] [PubMed] [Google Scholar]
- Miller J, Malenfant R, David P, Davis C, Poissant J, Hogg J et al. (2014). Estimating genome-wide heterozygosity: effects of demographic history and marker type. Heredity 112: 240–247. [DOI] [PMC free article] [PubMed] [Google Scholar]
- O'Grady JJ, Brook BW, Reed DH, Ballou JD, Tonkyn DW, Frankham R. (2006). Realistic levels of inbreeding depression strongly affect extinction risk in wild populations. Biol Cons 133: 42–51. [Google Scholar]
- Pemberton J. (2004). Measuring inbreeding depression in the wild: the old ways are the best. Trends Ecol Evol 19: 613–615. [DOI] [PubMed] [Google Scholar]
- Pemberton JM. (2008). Wild pedigrees: the way forward. Proc Biol Sci 275: 613–621. [DOI] [PMC free article] [PubMed] [Google Scholar]
- Polašek O, Hayward C, Bellenguez C, Vitart V, Kolčić I, McQuillan R et al. (2010). Comparative assessment of methods for estimating individual genome-wide homozygosity-by-descent from human genomic data. BMC Genom 11: 139. [DOI] [PMC free article] [PubMed] [Google Scholar]
- Pompanon F, Bonin A, Bellemain E, Taberlet P. (2005). Genotyping errors: Causes, consequences and solutions. Nat Rev Genet 6: 847–859. [DOI] [PubMed] [Google Scholar]
- Purcell S, Neale B, Todd-Brown K, Thomas L, Ferreira MA, Bender D et al. (2007). PLINK: a tool set for whole-genome association and population-based linkage analyses. Am J Hum Genet 81: 559–575. [DOI] [PMC free article] [PubMed] [Google Scholar]
- Core Team R. (2013). R: A Language and Environment for Statistical Computing. R Foundation for Statistical Computing: Vienna, Austria. URL http://www.R-project.org/. [Google Scholar]
- Santure AW, Stapley J, Ball AD, Birkhead TR, Burke T, Slate J. (2010). On the use of large marker panels to estimate inbreeding and relatedness: empirical and simulation studies of a pedigreed zebra finch population typed at 771 SNPs. Mol Ecol 19: 1439–1451. [DOI] [PubMed] [Google Scholar]
- Slate J, David P, Dodds KG, Veenvliet BA, Glass BC, Broad TE et al. (2004). Understanding the relationship between the inbreeding coefficient and multilocus heterozygosity: theoretical expectations and empirical data. Heredity 93: 255–265. [DOI] [PubMed] [Google Scholar]
- Stam P. (1980). The distribution of the fraction of the genome identical by descent in finite random mating populations. Genet Res 35: 131–155. [Google Scholar]
- Szpiech ZA, Xu J, Pemberton TJ, Peng W, Zöllner S, Rosenberg NA et al. (2013). Long runs of homozygosity are enriched for deleterious variation. Am J Hum Genet 93: 90–102. [DOI] [PMC free article] [PubMed] [Google Scholar]
- Wang J. (2014). Marker-based estimates of relatedness and inbreeding coefficients: an assessment of current methods. J Evol Biol 27: 518–520. [DOI] [PubMed] [Google Scholar]
- Wright S. (1922). Coefficients of inbreeding and relationship. Am Nat 56: 330–338. [Google Scholar]
Associated Data
This section collects any data citations, data availability statements, or supplementary materials included in this article.


