Abstract
Purpose
The purpose of this study was to evaluate the discrepancy between the near visual acuity (VA) measurements using the EyeHandBook smartphone application and the conventional method of using the near vision card.
Methods
Using similar environmental/examinational conditions, near VA measurements were obtained and compared using the near vision card and the EyeHandBook app for IPhone 5 from 100 subjects. The obtained data were changed to LogMAR format and the relationship between the two techniques was analyzed by paired sample t-test and scatterplot.
Results
With a P-value of<0.0001, our results indicate that the EyeHandBook application running on IPhone 5 overestimates the near VA compared with the conventional near vision card by an average of 0.11 LogMAR unless the measurement done by the near vision card was 20/20.
Conclusions
Owing to vast utilization of portable high-definition screens in VA measurements, eye-care providers have to be mindful of the potential disparity in VA measurement between different platforms, which in our study was likely secondary to the high contrast and brightness levels of the smartphone's high-definition screen when compared with the near vision card.
Introduction
Visual acuity (VA) measurement is the standard psychophysical test of visual function used in many clinical settings and is one of the most crucial analytical steps not only in the process of ophthalmological diagnosis but also as a measurement of treatment effectiveness and as a determinant of prognosis. With this regard, measuring the near VA is the preferred method by many healthcare providers especially if measuring distance. VA is impractical in clinical settings such as VA measurements for non-ambulatory patients. This method of VA testing was described by the American Academy of Ophthalmology as reading the near vision card's characters with one eye at a time, with wearing corrective lenses (if indicated) while holding the card at precisely 36 cm and only crediting the patient for the line with the smallest characters where he/she could identify all of the letters correctly.1
Nevertheless, with the adaptation of the recent advances in technology, physicians and healthcare providers have been adopting new visual activity measurement methods in an effort to improve patient care, while expediting the care-management process and minimizing the number of tools needed for each assessment. As of 2013, about 80% of physicians were using smartphones in their daily practice.2 As of now, in many clinical settings, including emergency and/or non-ambulatory situations, smartphones are used for VA measurements, which are used by the healthcare providers for patient management.3
In 2010, American Academy of Ophthalmology (AAO) collaborated with Cloud Nine Development, LLC (Kansas City, MO, USA), to further develop and improve the free IPhone application called the Eye Handbook.4 In 2012, the IPhone (Cupertino, CA, USA) was found to be the most popular smartphone among Ophthalmologists worldwide.5
The use of smartphone applications to measure and to analyze ophthalmological exam findings has improved the time efficacy, availability, and utility of subjective data/results collection for the healthcare providers. In the past, a few small studies have intended to review the effect of using the larger high-definition screen devices, such as tablets, for VA measurements; however, to the best of our knowledge, using a large sample population, the accuracy and precision of the more portable and readily available devices such as smartphones have never been reviewed/studied. The aim of this study was to evaluate the diagnostic and analytic accuracy of near vision testing using the EyeHandBook IPhone app when compared with the current conventional near vision card measurements.
Material and methods
One hundred subjects aged 18–89 years with unknown past ocular history were randomly selected from the University of Texas Medical Branch Eye Clinic patient pool once the Institutional Review Board approval from the University of Texas Medical Branch was obtained. Inclusion criteria indicated subjects that could be verbally consented, were previously screened to be mentally alert and oriented to the time, place, and person, and had previously documented near VA of at least 20/400 in each eye. The selected subject pool had an equal male to female ratio.
Based on the current AAO guidelines, subjects were asked to read the smallest line on the near vision card (LPO Rosenbaum pocket screener) while holding the card at 36 cm from the eyes and wearing previously obtained corrective lenses for near vision (if any).1 The distance between the near vision card and the subject's eye was measured with a tape meter at the beginning of the test and it was supervised by the examiner throughout the examination to avoid any fluctuations. The examination was performed on one eye at the time, while the other eye was occluded by the examiner using a standard single-end occluder, and subjects' VA measurement was recorded based on the last line for which all letters were correctly identified. Illuminance of the exam rooms was measured to be within 450–600 lx using a Cal-Light 400 Calibrated Precision Lightmeter made by the Cooke Corporation (Romulus, MI, USA).
Next, within the same environmental/lighting settings and using the same eye, subjects were asked to read the smallest line on the EyeHandBook app near vision screen projected by Apple 16 GB IPhone 5 using IOS7 with full brightness level, while holding the phone at 36 cm from the eyes and wearing previously obtained corrective lenses for near vision (if any). The distance between the near vision card and the subject's eye was measured with a tape meter at the beginning of the test and it was supervised by the examiner, throughout the examination, to avoid any changes. The examination was performed while the other eye was occluded by the examiner using a standard single-end occluder and subjects' VA measurement was recorded based on the last line for which all letters were correctly identified.
Both acuity measurement platforms were used sequentially in the selected test eye; however, the order of the VA measurement platform used first as well as the laterality of the tested eye examined first were randomized equally between the subjects.
Visual acuities were next transformed into the LogMAR (Log10 minimum angle resolvable) format using the LogMAR formula.6 The relationship between the conventional and the interventional techniques was analyzed, with significance testing in the form of a paired sample t-test, scatterplot, and a Bland–Altman plot. SPSS version 16.0 (International Business Machines Corporation, Armonk, NY, USA) was used to perform the statistical analyses. No data transformations were required to normalize the sample and analyses were within group.
We certify that all applicable institutional and governmental regulations concerning the ethical use of human volunteers were followed during this research.
Results
Two hundred VA measurements from 100 eyes were obtained using both near vision card and the EyeHandBook app. The LogMAR value of each VA measurement was calculated and the values were recorded to the second decimal place.
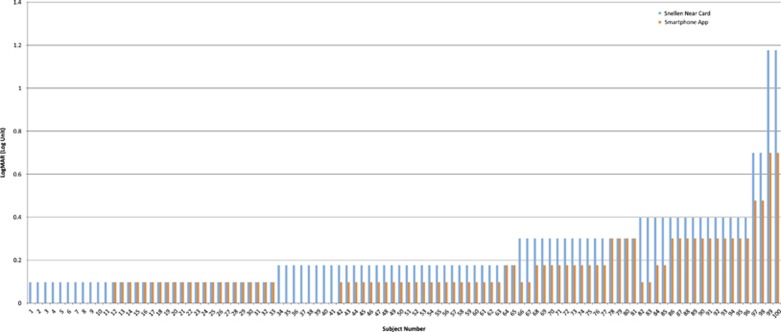
Twenty eyes measured LogMAR of 0.00 (VA of 20/20) by both near vision card and the EyeHandBook app. Measurements by the near card indicated higher LogMAR values (M=0.234, SD=0.186) than the measurements by the EyeHandBook app (M=0.1398, SD=0.132). A bar graph connecting the two VA scores for each individual was constructed and an average of 0.11 LogMAR decrease was noted when VA was measured by the EyeHandBook app vs the near card with the discrepancy more notable in patients with higher near card LogMAR recordings (Figure 1). A paired samples t-test was conducted using SPSS and Microsoft Excel 2010 application t(99)=10.54. P-value of <0.0001 was obtained with a confidence interval of 0.076, 0.11 pointing to a significant group difference.
Figure 1.
Comparison bar graph of the LogMAR VA measurements from the EyeHandBook app running on IPhone 5 versus the near vison card. Subjects' presentation has been arranged based on increasing LogMAR values measured by the near vision card. This figure excludes subjects with LogMAR value of 0.0 for both EyeHandBook app running on IPhone 5 and the near vison card.
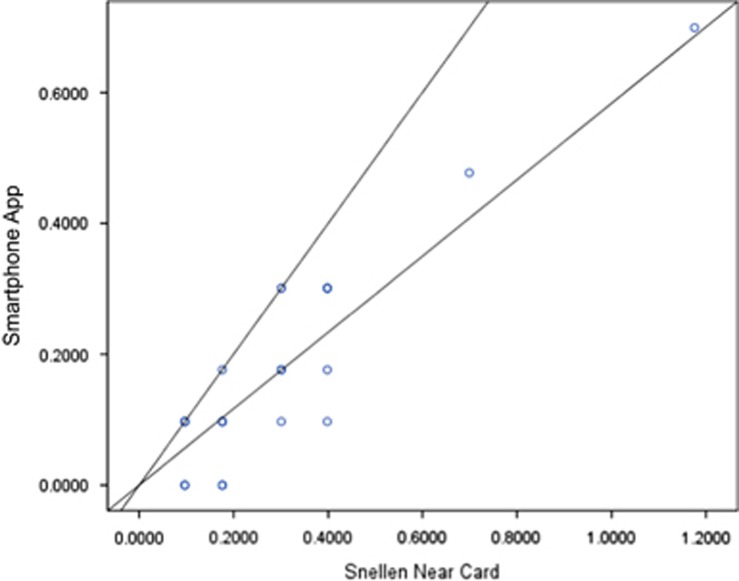
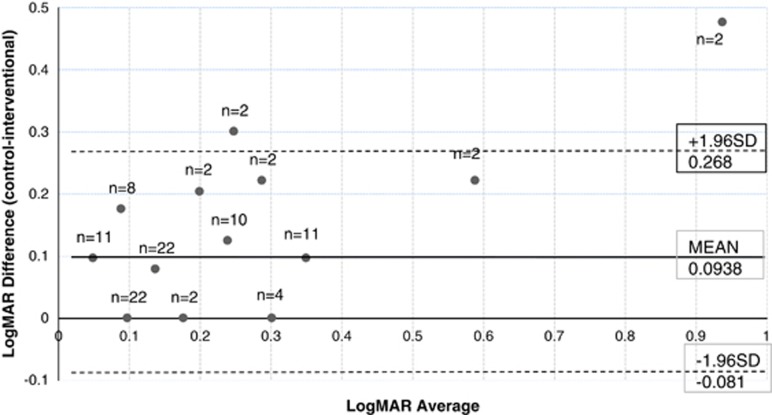
VA measurements in the two different techniques were significantly correlated with each other r(98)=0.897, P=0.000, indicating a direct positive relationship between the two techniques, although they differ in exact measurement. A scatter plot with a 1 : 1 line as well as a regression line was designed using Microsoft Excel 2010 application, which noted the significant discrepancy between the two VA measurement methods (Figure 2). The Bland–Altman plot obtained from the data pool also noted this discrepancy (Figure 3).
Figure 2.
Scatter plot of the VA measurements with correlated 1 : 1 and regression lines from the EyeHandBook app running on IPhone 5 versus the near vison card was obtained using Microsoft Excel 2010 application.
Figure 3.
Bland–Altman plot obtained from the available sample pool comparing the relationship between the LogMAR VA measurements from the EyeHandBook app running on IPhone 5 versus the near vison card.
Discussion
The Bland–Altman plot noted the significant disparity between the two testing methods (Figure 3), and based on our results, in majority of the cases, the EyeHandBook IPhone application consistently overestimates the VA by an average of 0.11 LogMAR when compared with the conventional Snellen near card, whereas the lower the Snellen near-card VA measurements, the higher the overstimulation by the EyeHandBook IPhone application was noted (Figure 1). In addition, analysis of the scatter plot indicates that the majority of the data points fall away from the 1 : 1 line and are more concentrated toward the Snellen near-card axis, also indicating the VA overestimation of the EyeHandBook IPhone application when compared with the conventional near vision card method (Figure 2).
VA has traditionally been defined as the ability to discern two black stimuli separated in space at high contrast compared with the background and, therefore, higher contrast levels have been shown to overestimate VA in diseases such as AMD and glaucoma.7, 8, 9, 10, 11 It has also been noted that the VA measurements in a healthy subject can be overestimated by increasing contrast levels.12 One of the ways to analyze contrast is by measuring contrast ratio, which is the ratio of an image's maximum luminance to its minimum luminance.13 Human retina is capable of detecting a static contrast ratio of 100 : 1, which can further increase to 1 000 000 : 1 by adjustments through the retinal chemistry and pupil within different environmental conditions.14 The contrast ratio of a clean printed Snellen or Early Treatment Diabetic Retinopathy Study (ETDRS) VA chart/card is below 33 : 1, whereas IPhone 5 has a contrast ratio of 1151 : 1.15, 16 Therefore, as in this study the lighting settings and/or environmental illumination factors were kept equal while measuring the VA with each technique, we believe that the mechanism causing this discrepancy between results of these two techniques is the increased contrast level of the smartphone's screen vs the near vision card.
We also suspect a similar discrepancy between the other forms of high-definition screens/smartphones and the near vision card, as the screen resolution, brightness, and contrast levels of many of these devices are superior when compared with the IPhone 5.17
It shall also be noted that in order to provide consistent results compared with the conventional methods, it would be optimal for the devices and tools measuring near VA to be calibrated for the use at 36 cm and represent similar number of characters and distance between the characters themselves within each line equated to the conventional near cards. Based on our observations, the number of characters to measure the VA vary by factor of 1 within each documented acuity line when comparing the EyeHandBook app running on IPhone 5 to the near vision card. This discrepancy, even though minimal, has the potential of causing inconsistency between the results obtained from the two techniques. Owing to the announcement of AAO's collaboration for development of the EyeHandBook app, we suspect that the appropriate calibrations have been implemented in developing this app to account for this discrepancy between the two techniques; however, as of now, there are no official documentations of such implementations available.4
In addition, smartphone applications now incorporate other ophthalmologic examination tools, such as Ishihara color plates, which we speculate based on our results, to have similar discrepancies with conventional clinical examination results. However, further studies would be needed for more conclusive analysis of these aspects.
High-resolution digital screens are currently being used in many outpatient and inpatient clinical settings to measure VA for both distant and near VA assessments. To the our best knowledge, as of now, no analysis with a comparable large sample pool has been done on the discrepancies between VA measurements obtained by smartphone high-resolution digital screens verses the conventional techniques, such as ETDRS charts, used in many major ophthalmology studies.6 The current clinical settings in many ophthalmology practices across the world include utilization of high-resolution monitors with high contrast levels for the purpose of VA measurements compared with traditional projectors. However, even though the discrepancy noted in our study is based on measuring the near VA with smartphone high-resolution screens, we believe that there is a high possibility that the same discrepancy exists in the measuring of VA at distance when using high-resolution screens vs the conventional techniques such as ETDRS or Snellen charts. If present, this discrepancy can significantly affect the patient care managements, as many of the conventional ophthalmologic managements are based on VA measurements performed by the standardized techniques in ophthalmology's major research studies in the past.6 In addition, we recommend adequate documentation of the techniques used for VA assessment in cases of patient care transfer from one location/setting to the other, to avoid misinterpretation of the any possible discrepancies between the VA assessment techniques.
This study was designed to detect the existence of significant discrepancies between the VA assessment using Snellen near vision card and the EyeHandBook smartphone application. As mentioned above, we suspect that one of the major factors contributing to this discrepancy is the difference between the techniques' contrast ratios. It has been shown that contrast sensitivity decreases with age and with the presence of other age-related ophthalmic diseases such as nuclear sclerosis cataracts.18 Therefore, we suspect an increase in the discrepancy between the VA measurements using the two mentioned techniques as the subject's age increases and/or in light of a concomitant ocular condition affecting the contrast sensitivity. Nevertheless, as the primary focus of this study's design did not involve the analysis of the effect of age on the VA measurement platforms, further studies would be needed to clarify these associations. In addition, as the EyeHandBook IPhone application does not randomize the letter presentation, memorization of the testing letters presented by the near card and/or the app when testing the second eye could have potentially provided a falsely improved VA measurement specially when examining the second eye. However, as this possible false improvement had been applicable to both tested platforms, we do not suspect this aspect to cause a significant change in the discrepancies measured between the platforms when examining the second eye.

The authors declare no conflicts of interest.
References
- Near vision testing. Available athttp://www.aao.org/pols-snippet/3008. (accessed 21 July 2015).
- Jackson & Coker Research AssociatesSpecial Report: App, Doctors, and Digital Devices. Jackson & Coker Industry Report 2011; 4(7).
- Roach L. Smartphones in practice: dial “M” for medicine. EyeNet 2011; 67–68.
- American Academy of Ophthalmology Joins Forces with Cloud Nine Development, LLC on the Eye Handbook iPhone Application. American Academy of Ophthalmology. Available at http://www.aao.org/newsroom/news-releases/detail/american-academy-of-ophthalmology-joins-forces-wit. (accessed 21 July 2015).
- Stanzel BV, Meyer CH. Smartphones in ophthalmology. Relief or toys for physicians? Ophthalmologe 2012; 109: 8–20. [DOI] [PubMed] [Google Scholar]
- Lim LA, Frost NA, Powell RJ, Hewson P. Comparison of the ETDRS logMAR, ‘compact reduced logMAR' and Snellen charts in routine clinical practice. Eye (Lond) 2010; 24: 673–677. [DOI] [PubMed] [Google Scholar]
- Kleiner RC, Enger C, Alexander MF, Fine SL. Contrast sensitivity in age-related macular degeneration. Arch Ophthalmol 1988; 106: 55–57. [DOI] [PubMed] [Google Scholar]
- Richman J, Lorenzana LL, Lankaranian D, Dugar J, Mayer J, Wizov SS et al. Importance of visual acuity and contrast sensitivity in patients with glaucoma. Arch Ophthalmol 2010; 128: 1576–1582. [DOI] [PubMed] [Google Scholar]
- Kniestedt C, Stamper RL. Visual acuity and its measurement. Ophthalmol Clin North Am 2003; 16(2): 155–170. [DOI] [PubMed] [Google Scholar]
- Arden GB. The importance of measuring contrast sensitivity in cases of visual disturbance. Br J Ophthalmol 1978; 62: 198–209. [DOI] [PMC free article] [PubMed] [Google Scholar]
- Bailey IL, Bullimore MA, Raasch TW, Taylor HR. Clinical grading and the effects of scaling. Invest Ophthalmol Vis Sci 1991; 32(2): 422–432. [PubMed] [Google Scholar]
- Cho P, Woo GC. Repeatability of the Waterloo Four contrast LogMAR visual acuity chart and near vision test card on a group of normal young adults. Ophthalmic Physiol Opt 2004; 24(5): 427–435. [DOI] [PubMed] [Google Scholar]
- Indrajit I, Verma B. Monitor displays in radiology: part 2. Indian J Radiol Imaging 2009; 19: 24–28. [DOI] [PMC free article] [PubMed] [Google Scholar]
- Levin LA, Nilsson SFE, Ver Hoeve J, Wu S, Kaufman PL, Alm A. Adler's Physiology of the Eye, 11th edn. Elsevier Health Sciences Division: Philadelphia, PA, USA, 2011. Print. [Google Scholar]
- Roth C. Contrast ratio: hype and reality. CustomRetailer 2007; 6(11): 32–36. [Google Scholar]
- Katzmaier D. Cnet.com. 15 October 2012. Web. 06 June 14. http://www.cnet.com/news/screens-test-apple-iphone-5-vs-samsung-galaxy-s3.
- Martin C PCAdvisor.co.uk. 17 May 13. Web. 20 May 2014. http://www.pcadvisor.co.uk/reviews/mobile-phone/3437004/galaxy-s4-vs-iphone-5-comparison-review/.
- Shandiz JH, Derakhshan A, Daneshyar A, Azimi A, Moghaddam HO, Yekta AA et al. Effect of cataract type and severity on visual acuity and contrast sensitivity. J Ophthalmic Vis Res 2011; 6: 26–31. [PMC free article] [PubMed] [Google Scholar]


