Abstract
Objectives:
Pancreatic intraductal papillary mucinous neoplasias (IPMNs) represent 25% of all cystic neoplasms and are precursor lesions for pancreatic ductal adenocarcinoma. This study aims to identify the best imaging modality for detecting malignant transformation in IPMN, the sensitivity and specificity of risk features on imaging, and the usefulness of tumor markers in serum and cyst fluid to predict malignancy in IPMN.
Methods:
Databases were searched from November 2006 to March 2014. Pooled sensitivity and specificity of diagnostic techniques/imaging features of suspected malignancy in IPMN using a hierarchical summary receiver operator characteristic (HSROC) approach were performed.
Results:
A total of 467 eligible studies were identified, of which 51 studies met the inclusion criteria and 37 of these were incorporated into meta-analyses. The pooled sensitivity and specificity for risk features predictive of malignancy on computed tomography/magnetic resonance imaging were 0.809 and 0.762 respectively, and on positron emission tomography were 0.968 and 0.911. Mural nodule, cyst size, and main pancreatic duct dilation found on imaging had pooled sensitivity for prediction of malignancy of 0.690, 0.682, and 0.614, respectively, and specificity of 0.798, 0.574, and 0.687. Raised serum carbohydrate antigen 19-9 (CA19-9) levels yielded sensitivity of 0.380 and specificity of 0903. Combining parameters yielded a sensitivity of 0.743 and specificity of 0.906.
Conclusions:
PET holds the most promise in identifying malignant transformation within an IPMN. Combining parameters increases sensitivity and specificity; the presence of mural nodule on imaging was the most sensitive whereas raised serum CA19-9 (>37 KU/l) was the most specific feature predictive of malignancy in IPMNs.
INTRODUCTION
Intraductal papillary mucinous neoplasias (IPMNs) of the pancreas represent 25% of all cystic neoplasms,1 with an assumed incidence of 0.8 per 100,000.2 In 2006, the International Consensus guidelines raised the awareness of IPMN and for the first time defined management;3 latterly, these guidelines have been updated.4 IPMNs of both the main pancreatic duct (MD-IPMNs) and the branch ducts (BD-IPMNs) are often diagnosed incidentally by cross-sectional imaging5, 6, 7 undertaken to investigate other pathology. All MD-IPMNs and BD-IPMNs with high-risk stigmata should be considered for resection. BD-IPMNs with “worrisome” stigmata require endoscopic ultrasound±fine needle aspiration. Simple BD-IPMNs even when in excess of 30 mm diameter can be entered into surveillance programs. However, there is no clear “best modality”, no optimal interval, and no standard protocol of how to undertake this, with many institutional/national preferences. In addition, both serum tumor markers (carcinoembryonic antigen (CEA) and carbohydrate antigen 19-9 (CA19.9))8 and cyst fluid analysis for cytology and/or tumor markers have been employed in identifying patients at risk of high-grade dysplasia or invasive cancer,9 although again there is no universal practice.
As IPMN patients are at risk for developing pancreatic cancer, timely detection in high-risk groups is of paramount importance. Current guidelines that provide a framework for the management of IPMN are based on review of literature. More objective assessments in the form of systematic reviews with meta-analyses are limited.10 Furthermore, the two published meta-analyses11, 12 primarily address only imaging characteristics (cyst size, mural nodule presence, and main pancreatic duct (MPD) dilation) predictive of malignancy.
The aims of this systematic review were: (1) to assess the diagnostic modality (computed tomography (CT), magnetic resonance imaging (MRI), and positron emission tomography (PET)) with the best rate of detection for malignant change in IPMN and (2) the sensitivity and specificity of (i) risk features on imaging, i.e., mural nodule, cyst size, and main pancreatic duct dilation, (ii) cyst fluid tumor markers, (iii) serum tumor markers, and (iv) combination of parameters for detecting malignant transformation in IPMN.
METHODS
Medline, Embase, and Web of Sciences databases were searched from November 2006 to March 2014. The start date of the searches was set to concur with the publication of the Sendai International Consensus Guidelines. Search terms were “intraductal papillary mucinous neoplasm” and “pancreas OR pancreatic OR pancrea*.” Inclusion criteria were retrospective and prospective studies dealing with IPMN. Exclusion criteria were case series of ≤10 patients and studies on cystic tumors where data were not separately available for patients with IPMN. Reference lists of selected studies were also reviewed for possible additional studies.
Two independent reviewers (A.S. and E.B.) assessed the abstract of every study identified by the search to determine eligibility. Blinding to source was not performed. Full articles were then selected for further assessment if the abstract suggested the study included patients with IPMN and the outcomes outlined before. If these criteria were unclear from the abstract, the full article was retrieved for clarification. Papers not meeting the inclusion criteria were excluded. Any disagreements were resolved by discussion. Following study selection, data extraction was undertaken by two independent assessors (either A.S. or E.B. and R.J.) and results compared. Data were extracted on the following parameters: patient demographics (age, gender), study period, imaging modality used, details on imaging of cyst size, presence of mural nodule, MPD size and cutoff used to consider MPD dilated, type of IPMN, cyst tumor marker levels/cutoff, serum tumor markers (CEA and CA19-9) levels/cutoff, management (resection with its details, or surveillance), and in resected patients details of histology (type of IPMN, and degree of dysplasia or invasive cancer).
The outcome measures were the sensitivity and specificity of a diagnostic modality/imaging risk feature for the detection of suspected high-grade dysplasia and invasive cancer (termed “malignancy”). Meta-analyses were carried out using a hierarchical summary receiver operator characteristic (HSROC) approach.13 This approach calculates the position and shapes of the receiver operator curve for each diagnostic test and allows for variability both within and between studies. This approach allows for the estimated study sensitivity and specificity to be modeled jointly as opposed to analyzing each outcome separately and allows for correlation between the study outcomes to be accounted for. Diagnostic test was included as a covariate in the model as opposed to using different models for each test. This was to ensure summaries account for within-study variability as many studies report on more than one test. Each type of diagnostic test required a minimum of four observations to estimate all parameters. Both CT and MRI are merged into a single modality as there are not sufficient observations for pooled sensitivity/specificity estimates for each category separately. For the analysis of PET and CT/MRI features, only a few observations were available and models were simplified to produce parameter estimates by assuming constant variance in both the malignant and nonmalignant populations. Current international consensus guidelines for the management of IPMN4 do not recommend endoscopic ultrasound (EUS) routinely, it being reserved for “worrisome cysts.” Therefore, EUS findings rather than the use of it as a modality have been modeled.
Model summaries are presented in terms of sensitivity and specificity estimates with associated 95% credibility intervals (CIs) for each statistic individually. Graphical summaries are provided with the joint credibility interval for both sensitivity and specificity determined by the observed correlation between model parameters and the size set to contain 95% of the observed posterior estimates. The area under the curve (AUC), estimated using Monte Carlo integration are presented with associated 95% CI is used as a single measure to compare diagnostic tests.
Publication bias due to sample size was investigated by plotting the log diagnostic odds ratio (DOR) against the effective sample size.14, 15 Analyses were carried out using the statistical packages WinBUGS16 and results compiled using R (version 3.01).17 Parameters estimated were obtained via a Markov chain Monte Carlo) procedure (10,000 draws with a thin of 20 following burn in and convergence).
Assessment of study quality was done using the QUADAS-2 tool18 utilizing Revman version 5.2 software.19 Study heterogeneity is measured via means of Cochrane's Q statistic on the log diagnostic odds ratio for each modality separately. Sensitivity analyses are carried out to assess the effects of study quality and the effect of individual studies on the study results. The effect of study bias is assessed by removing all studies with at least one high-risk element via the QUADAS-2 tool. Influence measures for each study are carried out by fitting models with each study in turn omitted.
RESULTS
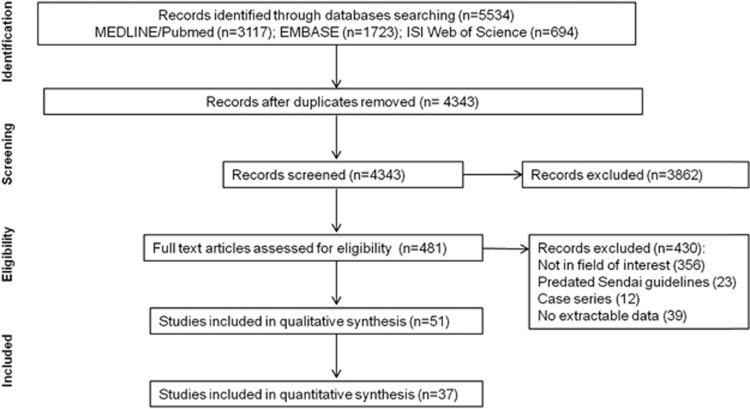
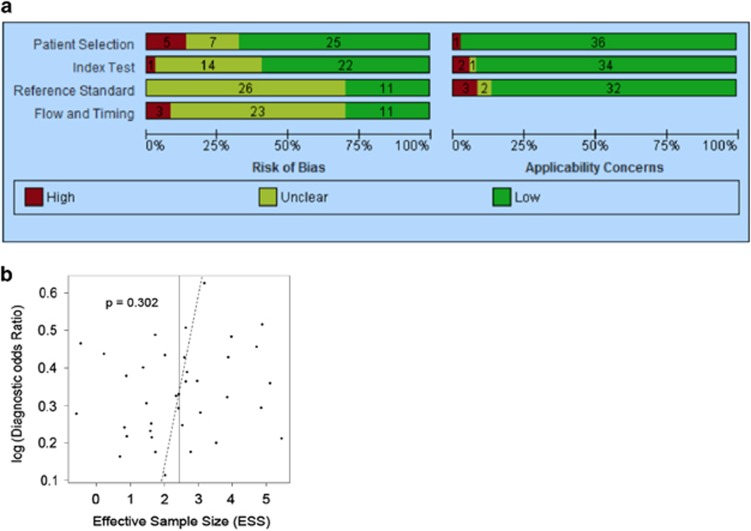
A total of 481 eligible studies were identified, of which 51 studies met the inclusion criteria and 37 of these were incorporated into meta-analyses (Figure 1). Quality of studies included in meta-analyses is displayed in Figure 2a. Assessment of bias via a funnel plot is included in Figure 2b and show no evidence of publication bias (P=0.302).
Figure 1.
Preferred Reporting Items for Systematic Reviews and Meta-Analyses (PRISMA) flow diagram of study selection.
Figure 2.
Assessments of study quality and bias. QUADAS-2 quality assessment of studies included in (a) meta-analyses and (b) bias.
The pooling of studies from the searches yielded 37 studies, incorporating 4,073 patients who were included in the meta-analyses (Table 1). A further 14 (1,156 patients) studies were included in the systematic review (Table 2), but not in the meta-analyses because of lack of extractable data.
Table 1. Studies included in meta-analyses.
| First author | Year | Study period | Number of patients | Median age in years | Number of males | Types of IPMN (number) | Number resected |
|---|---|---|---|---|---|---|---|
| Sahora52 | 2013 | 1995–2012 | 563 | 67 | 232 | BD (563) | 226 |
| Shimizu34 a | 2013 | 1996–2011 | 310 | 67.1 (mean) | 181 | MD (51), mixed (57), BD (202) | 310 |
| Fritz63 | 2012 | 2004–2010 | 123 | NA | NA | BD (123) | 123 |
| Hirono35 | 2012 | 1999–2011 | 134 | 69 (mean) | 74 | BD (134) | 134 |
| Kurihara36 | 2012 | 2003–2007 | 22 | 68 (mean) | 14 | MD (6), BD (16) | 22 |
| Ohno37 | 2012 | 2001–2009 | 142 | 65 (mean) | 77 | BD (142) | 30 |
| Ohtsuka38 | 2012 | 1990–2010 | 138 | 67 (mean) | 83 | MD (39), BD (99) | 138 |
| Akita39 | 2011 | 1992–2007 | 38 | 63 (mean) | 20 | BD (38) | 38 |
| Cone58 | 2011 | 2001–2009 | 52 | 65 (mean) | 24 | NA | 52 |
| Fritz8 | 2011 | 2004–2008 | 142 | NA | 82 | MD (16), mixed (75), BD (51) | 142 |
| Hwang40 a | 2011 | 1994–2008 | 237 | 63 (mean) | 137 | BD (237) | 247 |
| Maguchi41 a | 2011 | Not specified | 349 | 66 | 170 | BD (349) | 29 |
| Xu61 | 2011 | 1999–2008 | 86 | 62 (mean) | 62 | NA | 86 |
| Arikawa42 | 2010 | 2003–2008 | 25 | 65.2 (mean) | 20 | BD (25) | 25 |
| Hong25 | 2010 | 2005–2009 | 31 | 65 (mean) | 15 | MD (NA), BD (49) | 31 |
| Ingkakul 57 | 2010 | 1987–2008 | 200 | NA | 108 | BD (200) | 200 |
| Jing43 | 2010 | 1993–2007 | 39 | 55 (mean) | 39 | MD (11), mixed (4), BD (24) | 39 |
| Liu44 | 2010 | 2001–2008 | 25 | 61 | 14 | MD (5), mixed (13), BD (7) | 25 |
| Mimura45 | 2010 | 1998–2009 | 82 | 69 | 49 | MD (39), BD (43) (did not consider mixed IPMN; classified based on predominant type into MD and BD) | 82 |
| Sadakari53 | 2010 | 1987–2008 | 73 | 66 | 48 | BD (73) | 73 |
| Tomimaru33 | 2010 | 2006–2008 | 29 | NA | 13 | MD (3), mixed (13), BD (13) | 29 |
| Correa-Gallego59 | 2009 | NA | 72 | NA | NA | NA | NA |
| Manfredi6 | 2009 | 2001–2005 | 51 | 62 (mean) | 32 | MD (29), mixed (22) | Nil |
| Nagai46 | 2009 | 1984–2007 | 84 | 63 | 48 | BD (84) | 84 |
| Ohno47 | 2009 | 2001–2007 | 87 | 67 (mean) | 53 | MD (14), mixed (25), BD (48) | 87 |
| Tan26 | 2009 | 2005–2008 | 20 | 62 (mean) | 11 | MD (3), mixed (12), BD (5) | 20 |
| Woo54 | 2009 | 1998–2005 | 190 | 63(mean) | 111 | BD (190) | 85 |
| Jang48 a | 2008 | 1993–2006 | 138 | 61 (mean) | 87 | BD (138) | 138 |
| Maire60 | 2008 | 1994–2006 | 41 | 64 | 16 | MD (2), mixed (26), BD (13) | 41 |
| Ogawa27 | 2008 | 2000–2006 | 61 | 64.9 (mean) | 39 | MD (NA), mixed (NA), BD (49) | 61 |
| Pitman49 | 2008 | 1992–2006 | 20 | 68 (mean) | 11 | BD (20) | 18 |
| Takeshita50 | 2008 | 2002–2006 | 46 | 65 (mean) | 28 | BD (46), mixed IPMN also grouped under BD | 46 |
| Tang55 | 2008 | 1995–2006 | 31 | 66.6 (mean) | 19 | BD (31) | 31 |
| Pais62 | 2007 | 1992–2006 | 74 | 65 | 38 | MD (21), mixed (35), BD (18) | 74 |
| Rodriguez51 a | 2007 | 1990–2005 | 145 | 67 | 62 | BD (145) | 145 |
| Salvia56 b | 2007 | 2000–2003 | 109 | 64 | 45 | BD (109) | 25 |
| Sperti22 | 2007 | 1999–2005 | 64 | 64 (mean) | 33 | MD (28), BD (36) | 42 |
BD, branch duct; IPMN, intraductal papillary mucinous neoplasia; MD, main duct, NA, not available.
Multicentric study.
Prospective study.
Table 2. Studies included in systematic review only.
| First author | Year | Study period | Number of patients | Median age in years | Number of males | Types of IPMN (number) | Number resected |
|---|---|---|---|---|---|---|---|
| Bae72 | 2012 | 1995–2010 | 194 | 63 | 116 | BD (194) | 52 |
| Kang73 | 2011 | 2000–2009 | 201 | 63 (mean) | 111 | BD (201) | 35 |
| Uehara74 | 2011 | NA | 100 | 65 | 53 | BD (100) | 1 |
| Zhang28 | 2011 | 2004–2009 | 36 | 64 (mean) | 26 | BD (36) | 36 |
| Kanno75 | 2010 | 1995–2007 | 159 | 69 (mean) | 96 | BD (159) | 44 |
| Yamada29 | 2010 | 1997–2004 | 20 | 72 (mean) | 11 | MD (3), mixed (16), BD (1) | 20 |
| Salvia76 | 2009 | 1990–2006 | 131 | 67 | 52 | BD (131) | 10 |
| Yoon30 | 2009 | 2004–2007 | 21 | 69 (mean) | 7 | Mixed (10), BD (11) | 21 |
| Manfredi31 | 2008 | 2001–2006 | 26 | 67 (mean) | 10 | BD (16) | - |
| Rautou77 | 2008 | 1999–2005 | 121 | 63 | 25 | BD (121) | 2 |
| Tanno78 | 2008 | 1990–2006 | 82 | 68 | 57 | BD (82) | 7 |
| Yamada 32 | 2008 | 1997–2004 | 16 | 65 (mean) | 13 | MD (1), mixed (8), BD (7) | 16 |
| Waters23 | 2008 | 1991–2006 | 18 | 66 | 7 | MD (1), mixed (4), BD (13) | 18 |
| Song24 | 2007 | 2002–2006 | 31 | Not detailed | NA | Not detailed | 31 |
BD, branch duct; IPMN, intraductal papillary mucinous neoplasia; MD, main duct, NA, not available.
The included studies were assessed for methodological quality. A summary of results is presented in Figure 2a. In accordance with the QUADAS-2 tool, each study was assessed for bias in four domains: patient selection, index test, reference standard, and flow/timing.18
Five studies were deemed at high risk of selection bias because of concerns over the possible use of selective enrollment rather than a consecutive approach. The “blinding” of researchers to the reference standard was poorly documented, leading to an unclear assessment of test review bias in just a third of cases.20 Similarly, the majority of studies did not clearly address the possibility of diagnostic review bias where prior knowledge of the index test could potentially influence interpretation of the reference standard.20 In addition, relatively few studies reported the time interval between completion of the index test and collection of the reference standard, resulting in an unclear assessment of disease progression bias.20 These areas of possible bias could lead to an overestimation of sensitivity and specificity of the index tests.21 The applicability of the index tests, reference standard, and target population was generally high and thought to correlate well with the review question.
Histology based on resection was available in all included studies, except one. Sperti et al.22 reported on 64 patients, with tissue diagnosis available in 47 subjects. In the analyses on CT/MRI and PET ability to detect malignancy, the analyses were restricted to the 47 patients who had tissue confirmation, as data for this subset were available. In the analyses on mural nodule, MPD dilation, and serum CA19-9, the entire study population was included as subset details were not available.
Imaging
CT vs. MRI
Two studies23, 24 directly compared CT with MRI in the diagnosis of IPMN (Table 2), but extractable data were only available in one study.23 Waters et al.23 retrospectively evaluated CT/magnetic resonance cholangiopancreatography data in 18 patients who had all been operated upon within 12 months of surgery. They found that secretin magnetic resonance cholangiopancreatography was superior to multidetector CT (16 and 64 slices) in identifying ductal connection, main duct involvement, or small cysts from side branch IPMN. Song et al.24 studied 53 patients following surgery, of whom 31 were diagnosed as IPMN. MRI did not include secretin. One reader found the diagnostic accuracy for IPMN to be better for MRI than CT (0.995 vs. 0.875; P=0.10), but the other reader did not concur (0.932 vs. 0.850; P=0.059). Both readers found ductal communication to be significantly better delineated on MRI compared with CT.
Prediction of malignancy by CT and/or MRI
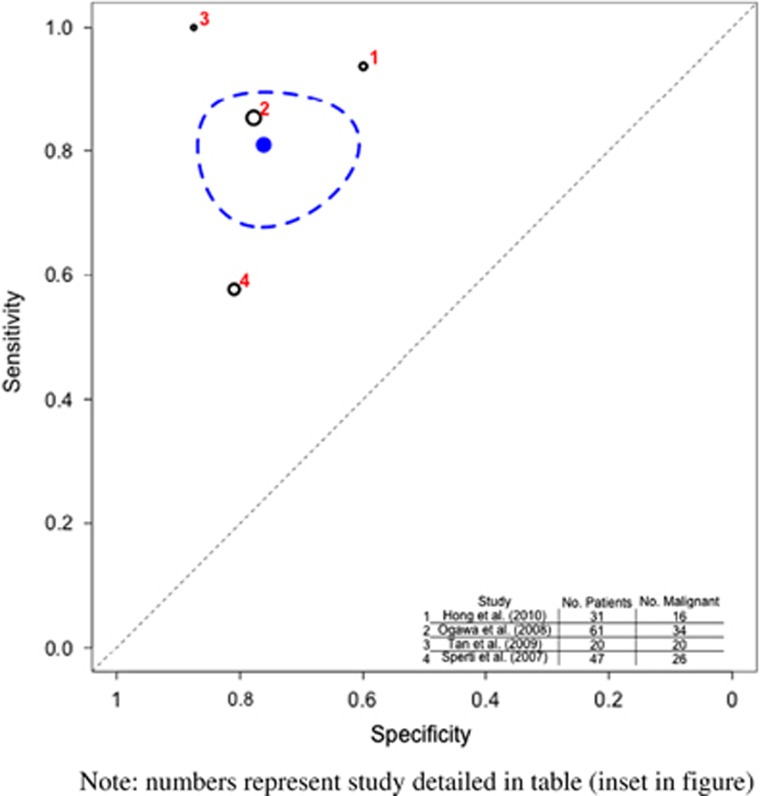
Nine studies were included in the systematic review (295 patients),22, 25, 26, 27, 28, 29, 30, 31, 32 but meta-analyses could only be performed using data from four studies (159 patients);22, 25, 26, 27 Sperti et al.22 evaluated 64 patients with helical CT (2.5 mm slices) and 60 patients with MRI/secretin-stimulated magnetic resonance cholangiopancreatography and reported the pooled results. Ogawa et al.27 evaluated contrast-enhanced CT scans of 61 consecutive resections for IPMN using a multiphase scanner with either 4 or 16 detector rows and reconstruction with 5 mm thickness. The two radiologists were blinded to the findings at surgery/histology, and consensus of opinion was used to come to a conclusion. Tan et al.26 employed 4- or 16-slice dual-phase CT with multiplanar volume reformations or curved reformations. Two radiologists blinded to the findings at surgery/histology reviewed the scans, and any difference of opinion was resolved by seeking input from a third radiologist. Hong et al.25 used 16 or 64 detector CT, with two radiologists blinded to results of histology interpreting the scans independently.
The pooled sensitivity of CT/MRI to detect malignancy (Table 3 and Figure 3) was 0.809 (95% CI 0.714–0.883) and the specificity was 0.762 (95% CI 0.654–0.851).
Table 3. Imaging and tumor marker characteristics suggestive of malignancy in IPMN (all types).
| Characteristic | Sensitivity (95%CI) | Specificity (95% CI) | Area under the curve (95% CI) | Q-test for heterogeneity |
|---|---|---|---|---|
| Presence of risk features on CT/MRI | 0.809 (0.714–0.883) | 0.762 (0.654–0.851) | 0.856 (0.778–0.915) | 5.24 (0.15) |
| Presence of risk features on PET | 0.968 (0.900–0.995) | 0.911 (0.815–0.998) | 0.985 (0.949–0.998) | 7.82 (0.02) |
| Mural nodule presence | 0.69 (0.585–0.793) | 0.798 (0.722–0.862) | 0.819 (0.719–0.925) | 21.7 (0.36) |
| Main pancreatic ductal dilation | 0.614 (0.471–0.746) | 0.687 (0.564–0.799) | 0.702 (0.596–0.838) | 7.48 (0.88) |
| Cyst size >3 cm | 0.682 (0.575–0.789) | 0.574 (0.43–0.702) | 0.657 (0.575–0.766) | 17.14 (0.004) |
| Cyst fluid elevated CEA levels | 0.636 (0.179–0.926) | 0.72 (0.48–0.894) | 0.843 (0.481–0.997) | 22.41 (0.1) |
| Elevated serum CEA levels | 0.169 (0.074–0.321) | 0.933 (0.867–0.972) | 0.691 (0.375–0.996) | 3.24 (0.78) |
| Elevated serum CA19-9 levels | 0.38 (0.156–0.634) | 0.903 (0.846–0.947) | 0.729 (0.651– 0.792) | 6.05 (0.42) |
| Combinations | 0.743 (0.542–0.9) | 0.906 (0.782–0.963) | 0.907 (0.701–0.999) | 8.34 (0.3) |
CA19-9, carbohydrate antigen 19-9; CEA, carcinoembryonic antigen; CI, confidence interval; CT/MRI, computed tomography/magnetic resonance imaging; IPMN, intraductal papillary mucinous neoplasia; PET, positron emission tomography.
Risk features on imaging were presence of mural nodule/septation, cyst size >3 cm, main pancreatic duct dilation, and uptake on PET.
Figure 3.
Hierarchical summary receiver operator characteristic (HSROC) curve of prediction of malignancy by computed tomography/magnetic resonance imaging (CT/MRI). Note that the numbers represent the studies detailed in table (inset in figure). The black circles represent the individual study estimate, and vary based on study size. The blue circle stands for the overall estimate pooling all studies, and the dotted blue line indicates the 95% credibility interval.
Prediction of malignancy by PET
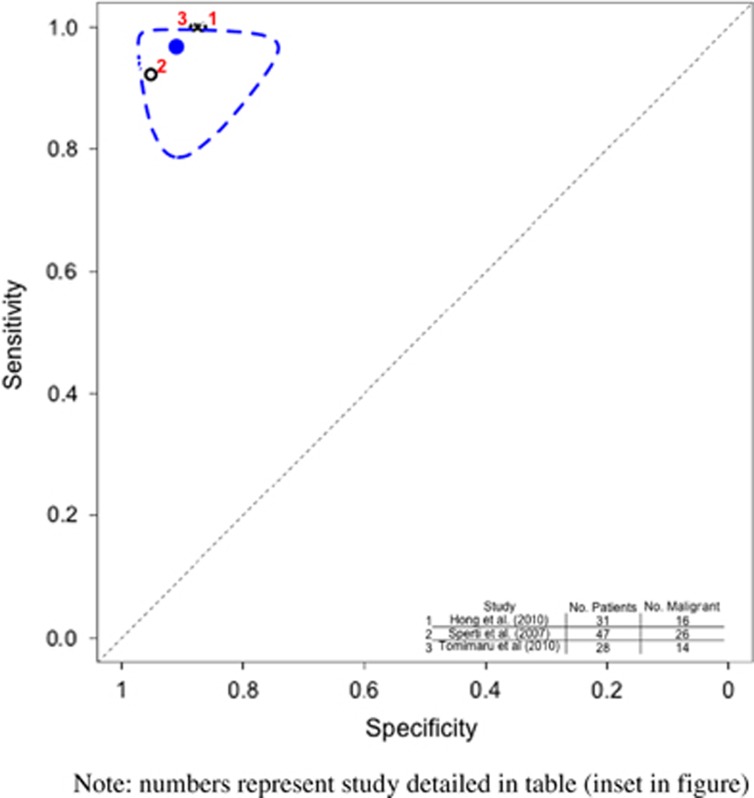
Systematic review and meta-analysis of 3 studies (106 patients) were undertaken. Hong et al.26 used a PET scanner with axial field view of 15.7 cm, and maximal standardized uptake value (SUV) cutoff of 2.5. They opined that PET outperformed CT in detecting malignant IPMN. Tomimaru et al.33 assessed different SUVmax levels to differentiate between benign and malignant IPMNs and found a value of 2.5 to be the best cutoff. A combination of mural nodule on CT and PET SUVmax of 2.5 lead to the best yield of detecting malignancy. Sperti et al.22 performed fludeoxyglucose F 18 (18FDG) PET using a machine with field view of 16.2 cm, and concluded that PET (mean SUVmax 4.2; range 2.5–9) was more accurate than CT and MRI in distinguishing between benign and malignant IPMNs.
The pooled sensitivity of PET to detect malignancy (Table 3 and Figure 4) was 0.968 (95% CI 0.900–0.995) and the specificity was 0.911 (95% CI 0.815–0.998).
Figure 4.
Hierarchical summary receiver operator characteristic (HSROC) curve of prediction of malignancy by positron emission tomography (PET) scan. Note that the numbers represent the studies detailed in table (inset in figure). The black circles represent the individual study estimate, and vary based on study size. The blue circle stands for the overall estimate pooling all studies, and the dotted blue line indicates the 95% credibility interval.
Prediction of malignancy by presence of mural nodule on imaging
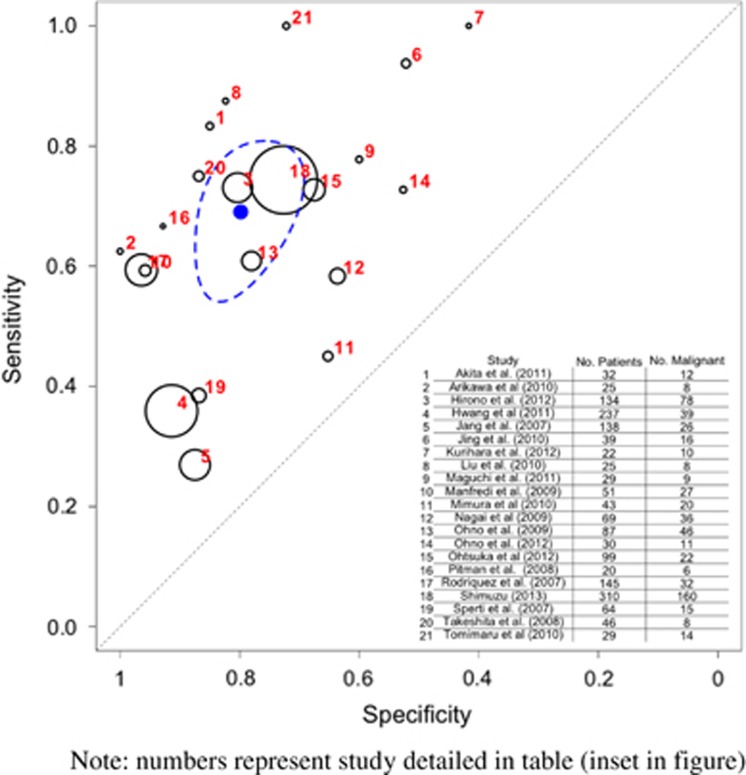
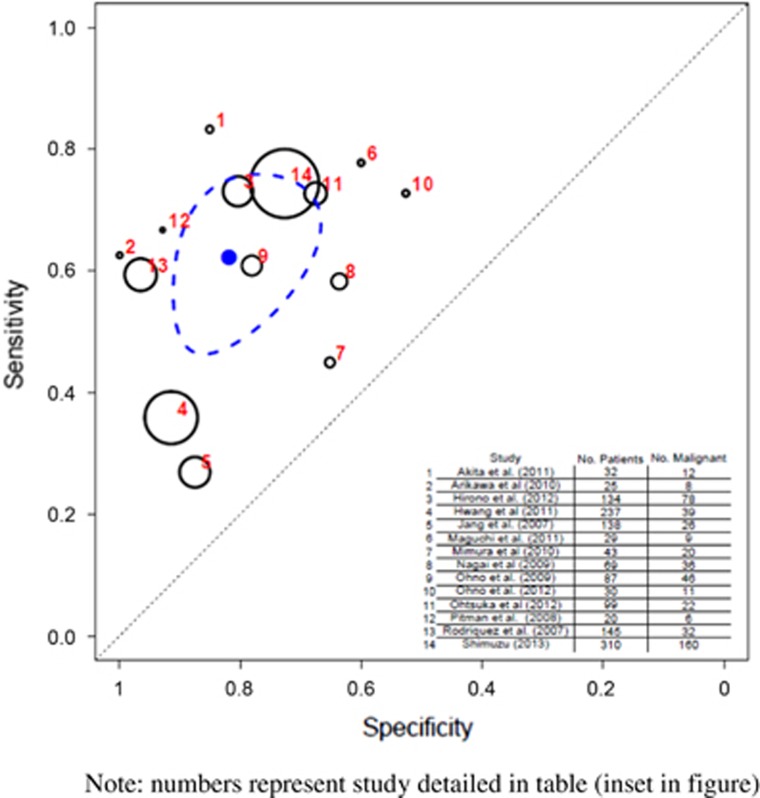
A total of 21 studies (1,674 patients) evaluated the association between mural nodule and malignancy.6, 22, 33, 34, 35, 36, 37, 38, 39, 40, 41, 42, 43, 44, 45, 46, 47, 48, 49, 50, 51 The pooled sensitivity was 0.69 (95% CI 0.585–0.793) and specificity was 0.798 (95% CI 0.722–0.862) (Table 3 and Figure 5). Further analyses of the 14 studies (1,398 patients)34, 35, 37, 38, 39, 40, 41, 42, 45, 46, 47, 48, 49, 51 that dealt exclusively with BD-IPMN revealed a pooled sensitivity of 0.622 (95% CI 0.506–0.736) and specificity of 0.819 (95% CI 0.709–0.898) (Table 4 and Figure 6).
Figure 5.
Hierarchical summary receiver operator characteristic (HSROC) curve of prediction of malignancy by mural nodule on imaging (all intraductal papillary mucinous neoplasia (IPMN) types). Note that the numbers represent the studies detailed in table (inset in figure). The black circles represent the individual study estimate, and vary based on study size. The blue circle stands for the overall estimate pooling all studies, and the dotted blue line indicates the 95% credibility interval.
Table 4. Imaging and tumor marker characteristics suggestive of malignancy in BD-IPMN.
| Characteristic | Sensitivity (95% CI) | Specificity (95% CI) | Area under the curve (95% CI) | Q-test for heterogeneity |
|---|---|---|---|---|
| Mural nodule presence | 0.622 (0.506–0.736) | 0.819 (0.709–0.898) | 0.749 (0.644–0.888) | 14.79 (0.32) |
| Main pancreatic ductal dilation | 0.508 (0.317–0.697) | 0.747 (0.539–0.911) | 0.629 (0.507–0.815) | 4.05 (0.99) |
| Cyst size >3 cm | 0.671 (0.527–0.804) | 0.574 (0.413–0.722) | 0.662 (0.563–0.783) | 8.43 (0.75) |
| Elevated serum CEA levels | 0.129 (0.047–0.286) | 0.943 (0.824–0.99) | 0.530 (0.241–0.987) | 0.93 (0.97) |
| Elevated serum CA19-9 levels | 0.267 (0.079–0.513) | 0.928 (0.809–0.989) | 0.724 (0.378–1.000) | 3.4 (0.64) |
BD-IPMN, branch duct intraductal papillary mucinous neoplasia; CA19-9, carbohydrate antigen 19-9; CEA, carcinoembryonic antigen; CI, confidence interval; PET, positron emission tomography.
Figure 6.
Hierarchical summary receiver operator characteristic (HSROC) curve of prediction of malignancy by mural nodule on imaging for branch duct intraductal papillary mucinous neoplasia (IPMN). Note that the numbers represent the studies detailed in table (inset in figure). The black circles represent the individual study estimate, and vary based on study size. The blue circle stands for the overall estimate pooling all studies, and the dotted blue line indicates the 95% credibility interval.
There were variations between studies in the definition of this feature, and the imaging modality used (ultrasound, CT, MRI, endoscopic retrograde cholangiopancreatography, or EUS). Eighteen studies considered the presence of mural nodule as an at-risk feature, whereas in 4 studies the size of the mural nodule was considered. Two studies used a 5 mm cutoff,34, 35 one used 7 mm,22 and another 10 mm.41
Prediction of malignancy by cyst size on imaging
The association of cyst size with malignancy was assessed in 16 studies (1,217 patients).33, 35, 38, 39, 41, 44, 45, 46, 48, 50, 51, 52, 53, 54, 55, 56 The pooled sensitivity was 0.682 (95% CI 0.575–0.789) and specificity was 0.574 (95% CI 0.43–0.702) (Table 3 and Supplementary Figure S1 online). Twelve of these studies (898 patients)26, 35, 38, 39, 41, 45, 46, 51, 53, 54, 55, 56 were limited to BD-IPMN, and here the pooled sensitivity was 0.671 (95% CI 0.527–0.804) and specificity was 0.574 (95% CI 0.413–0.722) (Table 4 and Supplementary Figure S2). The majority of studies used 3 cm as cutoff (12 studies), whereas 2 cm was used in two studies44, 48 and 3.5 cm in one study.56 Again, a variety of imaging methods (ultrasound, CT, MRI, endoscopic retrograde cholangiopancreatography, or EUS) were used.
Prediction of malignancy by MPD dilation on imaging
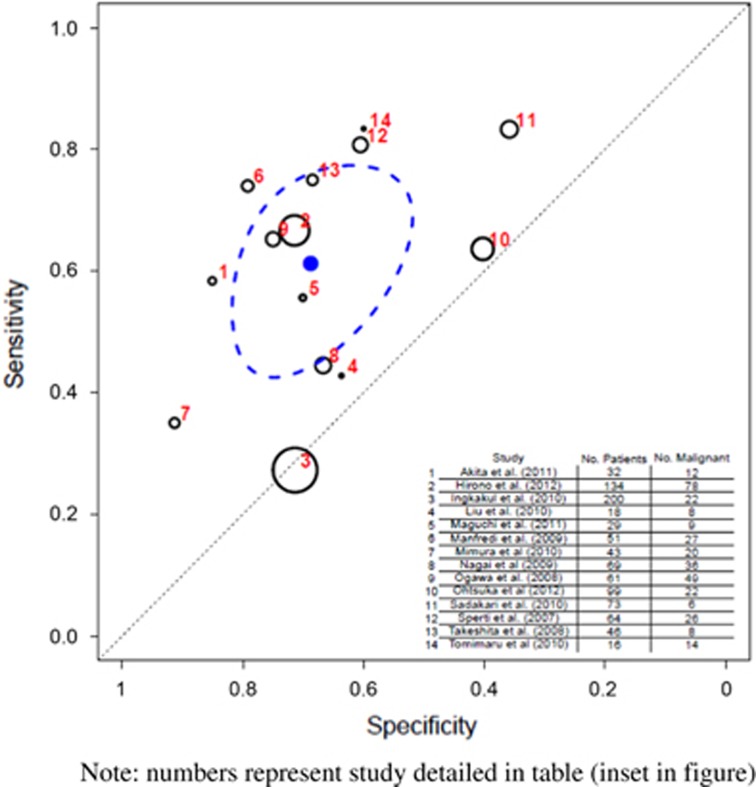
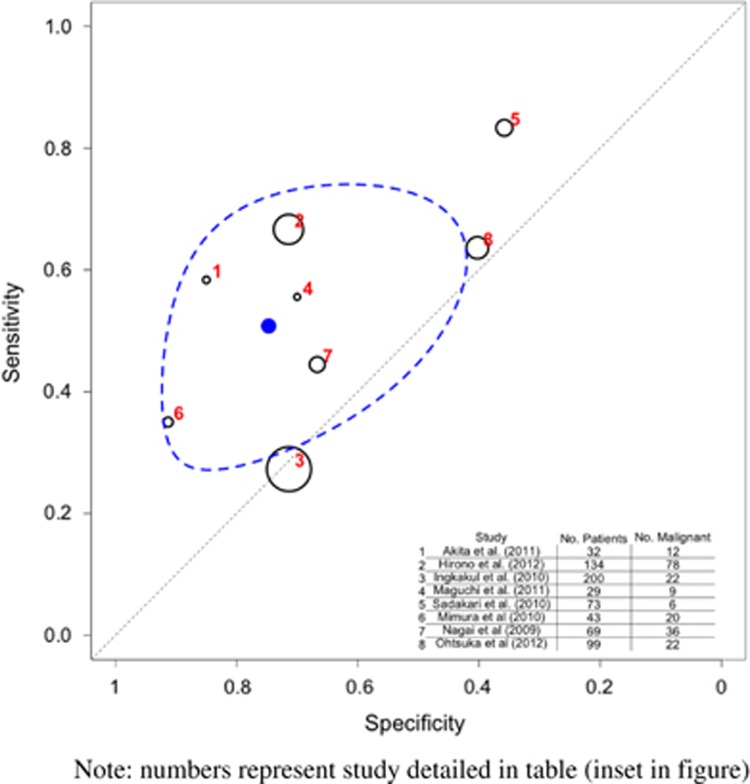
A total of 14 studies (935 patients) assessed the prediction of malignancy on MPD dilation.6, 22, 27, 33, 35, 38, 39, 41, 44, 45, 46, 50, 53, 57 The pooled sensitivity was 0.614 (95% CI 0.471–0.746) and specificity was 0.687 (95% CI 0.564–0.799) (Table 3 and Figure 7). Eight of these studies looked at BD-IPMN (679 patients)35, 38, 39, 41, 45, 46, 53, 57 and in this subgroup the pooled sensitivity was 0.508 (95% CI 0.317–0.697) and specificity was 0.747 (95% CI 0.539–0.911) (Table 4 and Figure 8).
Figure 7.
Hierarchical summary receiver operator characteristic (HSROC) curve of prediction of malignancy by main pancreatic duct (MPD) dilation on imaging (all intraductal papillary mucinous neoplasia (IPMN) types). Note that the numbers represent the studies detailed in table (inset in figure). The black circles represent the individual study estimate, and vary based on study size. The blue circle stands for the overall estimate pooling all studies, and the dotted blue line indicates the 95% credibility interval.
Figure 8.
Hierarchical summary receiver operator characteristic (HSROC) curve of prediction of malignancy by main pancreatic duct (MPD) dilation on imaging for branch duct intraductal papillary mucinous neoplasia (IPMN). Note that the numbers represent the studies detailed in table (inset in figure). The black circles represent the individual study estimate, and vary based on study size. The blue circle stands for the overall estimate pooling all studies, and the dotted blue line indicates the 95% credibility interval.
There were four different cutoff levels used to consider the MPD dilated. Two studies22, 27 used 10 mm as the cutoff, 7 mm was employed in four studies,33, 38, 39, 44 6 mm in a further four,41, 45, 46, 57 and 5 mm in three studies.35, 50, 53 The cutoff points of Manfredi et al.6 were 5 mm in the head, 4 mm in the body, and 3 mm in the tail of pancreas.
Cyst fluid tumor markers
Six studies35, 49, 55, 58, 59, 60 (270 patients) looked at cyst fluid tumor marker levels and their correlation with malignancy. All studies assessed cyst fluid CEA levels, and were assessed in meta-analysis. Only one study assessed CA 72–4 (ref. 54) and two CA19-9 (refs. 50, 54) and hence were not included in the meta-analysis. The overall pooled sensitivity was 0.636 (95% CI 0.179–0.926) and specificity was 0.72 (95% CI 0.48–0.894) (Table 3 and Supplementary Figure S3). None of the studies provided data for the BD-IPMN subset.
Cyst fluid sample for tumor marker estimation was obtained at EUS in all but one study,35 where the cyst fluid sample was taken at endoscopic retrograde cholangiopancreatography. Four different cutoff levels for cyst fluid CEA were used in the six studies. The most common one was 200 ng/ml employed in three studies.38, 53, 54
Serum tumor markers
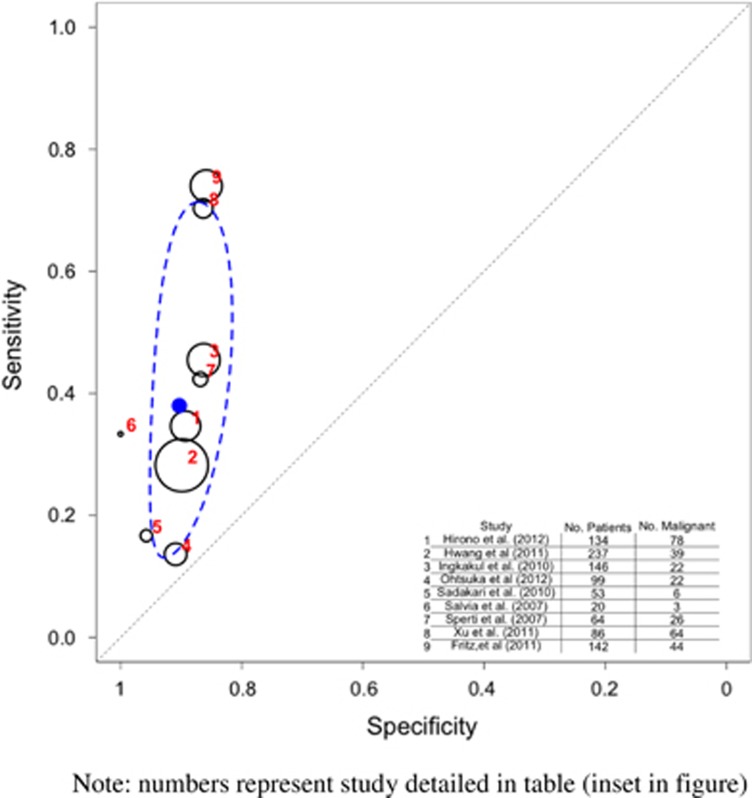
Nine studies (975 patients)8, 22, 35, 38, 40, 53, 56, 57, 61 looked at serum CA19-9 levels, and 6 of these studies (689 patients) evaluated BD-IPMNs.35, 38, 40, 53, 56, 57 The overall pooled sensitivity for all IPMN types was 0.380 (95% CI 0.156–0.634) and specificity was 0.903 (95% CI 0.846–0.947) (Table 3 and Figure 9). The overall pooled sensitivity for BD-IPMN was 0.267 (95% CI 0.079–0.513) and specificity was 0.928 (95% CI 0.809–0.989) (Table 4 and Supplementary Figure S4). The majority of studies (n=7) used a cutoff value of 37 KU/l, though one study used 25 KU/l,62 and in one study the cutoff value was not specified.35
Figure 9.
Prediction of malignancy by serum carbohydrate antigen 19-9 (CA19-9) levels (all intraductal papillary mucinous neoplasia (IPMN) types). Note that the numbers represent the studies detailed in table (inset in figure). The black circles represent the individual study estimate, and vary based on study size. The blue circle stands for the overall estimate pooling all studies, and the dotted blue line indicates the 95% credibility interval.
Seven studies (890 patients)8, 35, 38, 40, 53, 57, 61 assessed serum CEA levels and 5 of these studies (662 patients) evaluated BD-IPMN.35, 38, 40, 53, 57 The overall pooled sensitivity for all IPMN types was 0.169 (95% CI 0.074–0.321) and specificity was 0.933 (95% CI 0.867–0.972) (Table 3 and Supplementary Figure S5). The overall pooled sensitivity for BD-IPMN was 0.129 (95% CI 0.047–0.286) and specificity was 0.943 (95% CI 0.824–0.99) (Table 4 and Supplementary Figure S6). Cutoff levels varied between studies, and in two studies35, 57 the cutoff was not specified. Three studies8, 61 used a cutoff of 5 μg/l, one study53 used 4 μg/l and another study38 2.3 μg/l.
Combinations of predictors
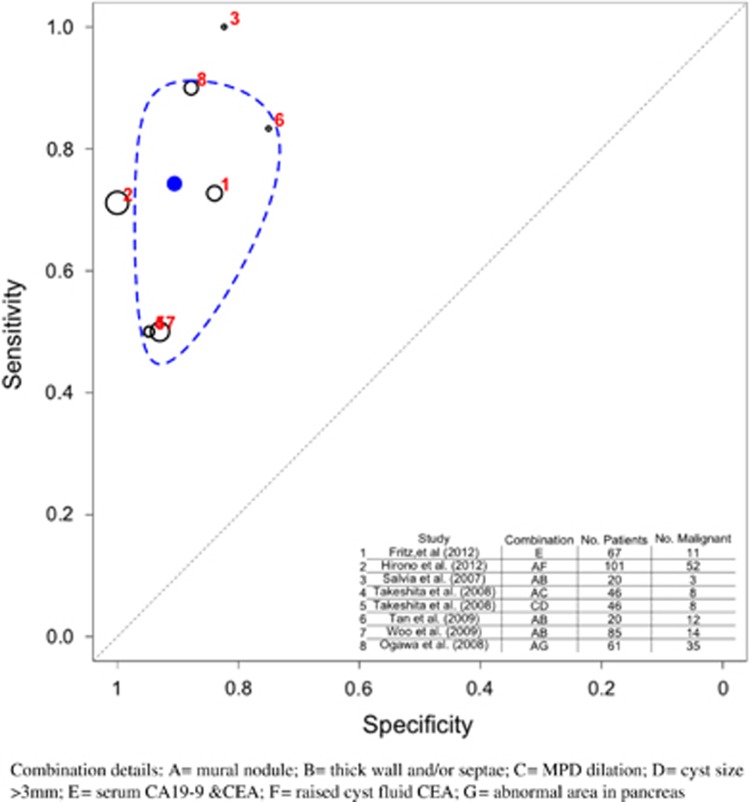
Seven studies26, 27, 35, 50, 54, 56, 63 encompassing 400 patients pooled combinations of parameters to assess their ability to predict malignancy. The overall pooled sensitivity was 0.743 (95% CI 0.542–0.9) and specificity was 0.906 (95% CI 0.782–0.963) (Table 3 and Figure 10).
Figure 10.
Prediction of malignancy by combinations of predictors. Note that the details of the different combinations used in each study are displayed in column 2 of the table inset into the figure. Each letter represent the following characteristic: A, mural nodule; B, thick wall and/or septae; C, MPD dilation; D, cyst size >3 mm; E, serum CA19-9 and CEA; F, raised cyst fluid CEA; G, abnormal area in pancreas. The numbers represent the studies detailed in the table. The black circles represent the individual study estimate, and vary based on study size. The blue circle stands for the overall estimate pooling all studies, and the dotted blue line indicates the 95% credibility interval. CA19-9, carbohydrate antigen 19-9; CEA, carcinoembryonic antigen; MPD, main pancreatic duct.
Salvia et al.56 considered the presence of mural nodule or thick walls and septae as suspicious radiological features, Tan et al.26 combined mural nodule and thick septae, and Woo et al.54 combined mural nodule and thick wall. Fritz et al.63 used serum CA19-9 and serum CEA in the combination. Hirono et al.35 employed a combination of mural nodule >5 mm present on EUS/CT, and raised CEA in pancreatic juice obtained at endoscopic retrograde cholangiopancreatography. Ogawa et al.27 used a combination of the presence of mural nodule and abnormal attenuating area in surrounding pancreas parenchyma. Two different combinations were assessed by Takeshita et al.,50 one being MPD dilation and presence of mural nodule, and the other MPD dilation and cyst size >3 mm. Data were not extractable on the BD-IPMN subset.
Based on these studies the most valuable combination for estimating malignant transformation would appear to be mural nodule (pooled sensitivity 0.690; 95% CI 0.585–0.793) and serum CA19-9 (pooled specificity 0.903; 95% CI 0.846–0.947).
Sensitivity analysis
Results of the sensitivity analysis are included in the Supplementary Materials. Influence measures for each study are given in Supplementary Figure S7. They show that the effect of each individual study is relatively small. The biggest effects are observed for diagnostic categories with the fewest data items and greater variability such as the CEA category; however, even here the effects of each study are small. Further sensitivity analyses are carried out that remove any study that is attributed a “high-risk” score for any component of the QUADAS-2 tool. A total of 11 studies are removed for this analysis and the results are included in Supplementary Table S1. The results obtained here do not differ substantially from those presented in Table 3.
DISCUSSION
We have adopted a novel approach by using HSROC curves to compare variations in diagnostic threshold; this is commonly demonstrated when different definitions are used in studies for features found in imaging and tumor markers. The HSROC method also allows for both within- and between-study variability of sensitivity and specificity (i.e., random effects), and their possible correlations as well as the precision of these estimates within a study.64 The two existing meta-analyses11, 12 used DORs to pool studies. The drawback with this approach is the inability of DOR to simultaneously deal with two outcomes, i.e., sensitivity and specificity. In addition, DORs are difficult to interpret clinically, and in practice DOR is reasonably constant regardless of the diagnostic threshold.65
This work has reviewed the risk of malignant transformation in all IPMNs, and wherever possible, the BD-IPMN subset; it is restricted to studies subsequent to the Sendai guidelines publication. Although Anand et al.12 also included all IPMN types, no subgroup analysis was performed, whereas the review by Kim et al.11 was confined to BD-IPMNs; in reality, only 9 of 23 studies dealt with BD-IPMNs. On quality assessment, the majority of studies in our review had high to unclear risk of bias in terms of patient selection, index test used, and flow/ timing, but had low risk of bias for features dealing with applicability concerns. This is because all but one study was retrospective. In contrast to the meta-analyses of Kim et al.11 that concluded that all their included (n=23) studies satisfied ≥5 of the total 7 points on quality assessment, in our study just 16% (6/37) met ≥5 points. Anand et al.12 did not comment on study quality.
PET shows the most promise as a technique in determining malignant transformation within IPMN; accepting that there are only three reports and the overall sample size is small. The study by Hong et al.25 noted that SUVmax was significantly higher in malignant IPMNs, with a mean of 6.7 and s.d. of 3.6 compared with benign IPMN (mean 2.1 and s.d. 1). Tomimaru et al.33 assessed different SUVmax levels to differentiate between benign and malignant IPMNs; importantly, a correlation between the grade of dysplasia, with high-grade dysplastic lesions having higher SUVmax than low/moderate-grade dysplasia, was noted. Overall, a combination of mural nodule on CT and PET SUVmax of 2.5 led to the best yield of detecting malignancy. This was supported by Sperti et al.22 who concluded that PET (mean SUVmax 4.2; range 2.5–9) was more accurate than CT and MRI in distinguishing between benign and malignant IPMNs. Notes of caution must be raised: when interpreting PET scan, SUV can be affected by tumor size, patient weight, and blood glucose level, as also the potential of differing results between different scanners. False positive values can also occur in the presence of acute and chronic pancreatitis, and if endoscopic interventions on the pancreas are performed before PET. Overall, the sensitivity, specificity, and AUC (95% CI) for PET was 0.968 (0.900–0.995), 0.911 (0.815–0.998), and 0.985 (0.949–0.998), Table 3. We await the report of the ongoing (closed to recruitment) PET-PANC trial (http://public.ukcrn.org.uk/search/StudyDetail.aspx?StudyID=8166) that has evaluated the role of PET CT in pancreatic cancer.
The benefit of CT vs. MRI in predicting malignancy within IPMN was not confirmed by this systematic review; however, these technologies have advanced dramatically over time,66, 67 such that modern contrast agents (and secretin stimulation) provide better images than earlier techniques.68, 69, 70 Overall the sensitivity, specificity, and AUC (95% CI) for CT/MRI are 0.809 (0.714–0.883), 0.762 (0.654–0.851), and 0.856 (0.778–0.915). Although analysis of CT vs. MRI was not possible, these data support a trial of direct comparison of modern contrast-enhanced CT vs. secretin-stimulated magnetic resonance cholangiopancreatography.
We did not specifically look at EUS as it is not used for first-line imaging, but instead employed to evaluate in greater detail suspicious features reported on screening investigations.
In our meta-analyses, the presence of a mural nodule on cross-sectional imaging had good specificity and sensitivity for predicting malignancy in all IPMNs (sensitivity 0.69; specificity 0.798; AUC 0.819, see Table 3), as well as in BD-IPMN (sensitivity 0.622; specificity 0.819; AUC 0.749, see Table 4), and performed the best compared with all other parameters, with the exception of when parameters were combined.
We have demonstrated poor performance of cyst fluid CEA as a discriminator between benign and malignant IPMNs. The utility of a raised CEA only identifies the presence of mucin and the implied risk of malignant transformation of mucinous lesions (IPMN or mucinous neoplasms). Concentrating on studying novel molecular/proteomic markers in cyst fluid may shed light on a better predictor.
Serum tumor markers were highly specific but poor on sensitivity in meta-analyses of all IPMN and BD-IPMN subsets. However, serum CA19-9 was significantly raised in patients with invasive cancer, but not high-grade dysplasia,8, 61 as also CEA.8 The majority of studies either combined HGD with invasive cancer35, 38, 53, 57 or the numbers were too small to draw a meaningful conclusion.22, 40, 56 This implies, from the available evidence, that CA19-9 is highly specific for invasive cancer in IPMN, and would be a useful adjunctive tool. Discovery of more sensitive biomarkers that can discriminate malignant transformation are needed.
Combinations of parameters performed the best on meta-analyses, having the highest pooled sensitivity, specificity 0.743 (0.542–0.900); 0.906 (0.782–0.963); and AUC 0.907 (0.701–0.999), for detection of malignancy within IPMN; although several combinations were used across the eight studies. Mural nodule presence along with another parameter were assessed in six of these studies. Correa-Gallego et al.71 have developed a preoperative nomogram using data on 219 resected IPMN. Male gender, a history of weight loss and previous malignancy, and presence of a solid component on imaging conferred increased risk of malignancy in patients with main/mixed duct IPMN. In BD-IPMN, factors that raised the risk of malignancy were a history of weight loss, presence of a solid component of imaging, and cyst size. Future prospective studies assessing multiple parameters and using externally validated predictive nomograms to ascertain risks may be a way forward.
The model used to synthesize the data, while allowing for study heterogeneity, did not take any direct account of the different cutoff values or definitions used for each modality because of the large variability that was observed. Although study heterogeneity was not highlighted as a main cause for most modality, increasing standards of reporting would allow for a more concise review of the data and would be of clinical interest.
In conclusion, these systematic review/meta-analyses suggest elevated serum CA19-9 levels and presence of mural nodule to be the stand-alone features strongly correlated with malignancy. Recommending one modality over another for diagnosis is difficult based on the available literature, and although PET scanning has promise, it requires evaluation in larger studies with improved quality.
Future directions
In future, prospective longitudinal studies using standardized imaging (CT/MRI) with uniform definitions for risk features to allow comparability between studies are needed. Comparative studies evaluating CT vs. MRI, and PET vs. CT/MRI, may help shed light on the optimal imaging approach. Combining risk features on history, imaging, and tumor markers in both serum and cyst fluid, as well as investing in the efforts to discover/validate novel biomarkers, may help refine the at-risk group, improving the specificity of current guidelines and sparing unnecessary surgery for those with low- to moderate-grade dysplasia.
Study Highlights
Guarantor of the article: Christopher M. Halloran.
Specific author contributions: Asma Sultana: conceptualized and designed study, conducted literature searches, was involved in data extraction, analyses, and interpretation, prepared tables and figures, drafted initial manuscript, and approved the final manuscript as submitted; Richard Jackson: was involved in data extraction, performed statistical analyses, prepared figures, drafted initial manuscript, and approved the final manuscript as submitted; Tim Gilbert: conducted literature searches, was involved in data extraction, and approved the final manuscript as submitted; Emma Bostock: conducted literature searches, was involved in data extraction, and approved the final manuscript as submitted; Eftychia E. Psarelli: performed statistical analyses, prepared figures, drafted initial manuscript, and approved the final manuscript as submitted; Trevor F. Cox: reviewed statistical analyses and interpretation, revised initial manuscript, and approved the final manuscript as submitted; Robert Sutton: reviewed and revised initial manuscript and approved the final manuscript as submitted; Paula Ghaneh: reviewed and revised initial manuscript and approved the final manuscript as submitted; Michael G.T. Raraty: reviewed and revised initial manuscript and approved the final manuscript as submitted; John P. Neoptolemos: reviewed data analyses and interpretation, reviewed and revised initial manuscript, and approved the final manuscript as submitted; Christopher M. Halloran: conceptualized and designed study, was involved in data analyses and interpretation, reviewed and revised tables and figures, drafted initial manuscript, and approved the final manuscript as submitted.
Financial support: NIHR (National Institute for Health and Research, UK) funding and support from the NIHR Pancreas Biomedical Research Unit and the Cancer Research UK Liverpool Cancer Trials Unit at the University of Liverpool is acknowledged. J.P. Neoptolemos, FMedSci, is a Senior National Institutes of Health Investigator. J.P. Neoptolemos and P. Ghaneh are program funded by Cancer Research UK and Liverpool Cancer Research UK Cancer Trials Unit, and are theme leaders for the National Institutes of Health Liverpool Pancreas Biomedical Research Unit. C.M. Halloran is funded by CRUK (PANasta trial) and the Royal College of Surgeons of England.
Potential competing interests: None.
Footnotes
Supplementary Information accompanies this paper on the Clinical and Translational Gastroenterology website (http://www.nature.com/ctg)
Supplementary Material
References
- Sakorafas GH, Smyrniotis V, Reid-Lombardo KM et al. Primary pancreatic cystic neoplasms revisited. Part III. Intraductal papillary mucinous neoplasms. Surg Oncol 2011; 20: e109–e118. [DOI] [PubMed] [Google Scholar]
- Fernandez-del Castillo C, Adsay NV. Intraductal papillary mucinous neoplasms of the pancreas. Gastroenterology 2010; 139 (708-13): 713 e1–e2. [DOI] [PubMed] [Google Scholar]
- Tanaka M, Chari S, Adsay V et al. International consensus guidelines for management of intraductal papillary mucinous neoplasms and mucinous cystic neoplasms of the pancreas. Pancreatology 2006; 6: 17–32. [DOI] [PubMed] [Google Scholar]
- Tanaka M, Fernandez-Del Castillo C, Adsay V et al. International consensus guidelines 2012 for the management of IPMN and MCN of the pancreas. Pancreatology 2012; 12: 183–197. [DOI] [PubMed] [Google Scholar]
- Sahani DV, Sainani NI, Blake MA et al. Prospective evaluation of reader performance on MDCT in characterization of cystic pancreatic lesions and prediction of cyst biologic aggressiveness. AJR Am J Roentgenol 2011; 197: W53–W61. [DOI] [PubMed] [Google Scholar]
- Manfredi R, Graziani R, Motton M et al. Main pancreatic duct intraductal papillary mucinous neoplasms: accuracy of MR imaging in differentiation between benign and malignant tumors compared with histopathologic analysis. Radiology 2009; 253: 106–115. [DOI] [PubMed] [Google Scholar]
- Pedrazzoli S, Sperti C, Pasquali C et al. Comparison of International Consensus Guidelines versus 18-FDG PET in detecting malignancy of intraductal papillary mucinous neoplasms of the pancreas. Ann Surg 2011; 254: 971–976. [DOI] [PubMed] [Google Scholar]
- Fritz S, Hackert T, Hinz U et al. Role of serum carbohydrate antigen 19-9 and carcinoembryonic antigen in distinguishing between benign and invasive intraductal papillary mucinous neoplasm of the pancreas. Br J Surg 2011; 98: 104–110. [DOI] [PubMed] [Google Scholar]
- Tanaka M. Controversies in the management of pancreatic IPMN. Nat Rev Gastroenterol Hepatol 2011; 8: 56–60. [DOI] [PubMed] [Google Scholar]
- Lai EC, Lau WY. Intraductal papillary mucinous neoplasms of the pancreas. Surgeon 2005; 3: 317–324. [DOI] [PubMed] [Google Scholar]
- Kim KW, Park SH, Pyo J et al. Imaging features to distinguish malignant and benign branch-duct type intraductal papillary mucinous neoplasms of the pancreas: a meta-analysis. Ann Surg 2014; 259: 72–81. [DOI] [PubMed] [Google Scholar]
- Anand N, Sampath K, Wu BU. Cyst features and risk of malignancy in intraductal papillary mucinous neoplasms of the pancreas: a meta-analysis. Clin Gastroenterol Hepatol 2013; 11: 913–921. [DOI] [PubMed] [Google Scholar]
- Rutter CM, Gatsonis CA. A hierarchical regression approach to meta-analysis of diagnostic test accuracy evaluations. Stat Med 2001; 20: 2865–2884. [DOI] [PubMed] [Google Scholar]
- Deeks JJ, Macaskill P, Irwig L. The performance of tests of publication bias and other sample size effects in systematic reviews of diagnostic test accuracy was assessed. J Clin Epidemiol 2005; 58: 882–893. [DOI] [PubMed] [Google Scholar]
- Leeflang MM, Deeks JJ, Gatsonis C et al. Systematic reviews of diagnostic test accuracy. Ann Intern Med 2008; 149: 889–897. [DOI] [PMC free article] [PubMed] [Google Scholar]
- Lunn DJ, Thomas A, Best N et al. WinBUGS - A Bayesian modelling framework: Concepts, structure, and extensibility. Stat Comput 2000; 10: 325–337. [Google Scholar]
- R Core Team (2015). R: A language and environment for statistical computing. R Foundation for Statistical Computing, Vienna, Austria. URL http://www.R-project.org/.
- Whiting PF, Rutjes AW, Westwood ME et al. QUADAS-2: a revised tool for the quality assessment of diagnostic accuracy studies. Ann Intern Med 2011; 155: 529–536. [DOI] [PubMed] [Google Scholar]
- The Cochrane Collaboration. Review Manager (Revman). Version 5.2. In: The Nordic Cochrane Centre. Copenhagen 2012.
- Whiting P, Rutjes AW, Reitsma JB et al. Sources of variation and bias in studies of diagnostic accuracy: a systematic review. Ann Intern Med 2004; 140: 189–202. [DOI] [PubMed] [Google Scholar]
- Leeflang MM, Deeks JJ, Gatsonis C et al. Systematic reviews of diagnostic test accuracy. Ann Intern Med 2008; 149: 889–897. [DOI] [PMC free article] [PubMed] [Google Scholar]
- Sperti C, Bissoli S, Pasquali C et al. 18-fluorodeoxyglucose positron emission tomography enhances computed tomography diagnosis of malignant intraductal papillary mucinous neoplasms of the pancreas. Ann Surg 2007; 246: 932–937. [DOI] [PubMed] [Google Scholar]
- Waters JA, Schmidt CM, Pinchot JW et al. CT vs MRCP: optimal classification of IPMN type and extent. J Gastrointest Surg 2008; 12: 101–109. [DOI] [PubMed] [Google Scholar]
- Song SJ, Lee JM, Kim YJ et al. Differentiation of intraductal papillary mucinous neoplasms from other pancreatic cystic masses: comparison of multirow-detector CT and MR imaging using ROC analysis. J Magn Reson Imaging 2007; 26: 86–93. [DOI] [PubMed] [Google Scholar]
- Hong H-S, Yun M, Cho A et al. The utility of F-18 FDG PET/CT in the evaluation of pancreatic intraductal papillary mucinous neoplasm. Clin Nucl Med 2010; 35: 776–779. [DOI] [PubMed] [Google Scholar]
- Tan L, Zhao YE, Wang DB et al. Imaging features of intraductal papillary mucinous neoplasms of the pancreas in multi-detector row computed tomography. World J Gastroenterol 2009; 15: 4037–4043. [DOI] [PMC free article] [PubMed] [Google Scholar]
- Ogawa H, Itoh S, Ikeda M et al. Intraductal papillary mucinous neoplasm of the pancreas: assessment of the likelihood of invasiveness with multisection CT. Radiology 2008; 248: 876–886. [DOI] [PubMed] [Google Scholar]
- Zhang HM, Yao F, Liu GF et al. The differences in imaging features of malignant and benign branch duct type of intraductal papillary mucinous tumor. Eur J Radiol 2011; 80: 744–748. [DOI] [PubMed] [Google Scholar]
- Yamada Y, Mori H, Matsumoto S et al. Invasive carcinomas originating from intraductal papillary mucinous neoplasms of the pancreas: conspicuity and primary sites of the solid masses on triple-phase dynamic CT imaging. Abdom Imaging 2010; 35: 181–188. [DOI] [PubMed] [Google Scholar]
- Yoon LS, Catalano OA, Fritz S et al. Another dimension in magnetic resonance cholangiopancreatography: comparison of 2- and 3-dimensional magnetic resonance cholangiopancreatography for the evaluation of intraductal papillary mucinous neoplasm of the pancreas. J Comput Assist Tomogr 2009; 33: 363–368. [DOI] [PubMed] [Google Scholar]
- Manfredi R, Mehrabi S, Motton M et al. MR imaging and MR cholangiopancreatography of multifocal intraductal papillary mucinous neoplasms of the side branches: MR pattern and its evolution. Radiol Med 2008: 414–428. [DOI] [PubMed]
- Yamada Y, Mori H, Matsumoto S. Intraductal papillary mucinous neoplasms of the pancreas: correlation of helical CT and dynamic MR imaging features with pathologic findings. Abdom Imaging 2008; 33: 474–481. [DOI] [PubMed] [Google Scholar]
- Tomimaru Y, Takeda Y, Tatsumi M et al. Utility of 2-[18F] fluoro-2-deoxy-D-glucose positron emission tomography in differential diagnosis of benign and malignant intraductal papillary-mucinous neoplasm of the pancreas. Oncol Rep 2010; 24: 613–620. [DOI] [PubMed] [Google Scholar]
- Shimizu Y, Yamaue H, Maguchi H et al. Predictors of malignancy in intraductal papillary mucinous neoplasm of the pancreas: analysis of 310 pancreatic resection patients at multiple high-volume centers. Pancreas 2013; 42: 883–888. [DOI] [PubMed] [Google Scholar]
- Hirono S, Tani M, Kawai M et al. The carcinoembryonic antigen level in pancreatic juice and mural nodule size are predictors of malignancy for branch duct type intraductal papillary mucinous neoplasms of the pancreas. Ann Surg 2012; 255: 517–522. [DOI] [PubMed] [Google Scholar]
- Kurihara N, Kawamoto H, Kobayashi Y et al. Vascular patterns in nodules of intraductal papillary mucinous neoplasms depicted under contrast-enhanced ultrasonography are helpful for evaluating malignant potential. Eur J Radiol 2012; 81: 66–70. [DOI] [PubMed] [Google Scholar]
- Ohno E, Itoh A, Kawashima H et al. Malignant transformation of branch duct-type intraductal papillary mucinous neoplasms of the pancreas based on contrast-enhanced endoscopic ultrasonography morphological changes: focus on malignant transformation of intraductal papillary mucinous neoplasm itself. Pancreas 2012; 41: 855–862. [DOI] [PubMed] [Google Scholar]
- Ohtsuka T, Kono H, Nagayoshi Y et al. An increase in the number of predictive factors augments the likelihood of malignancy in branch duct intraductal papillary mucinous neoplasm of the pancreas. Surgery 2012; 151: 76–83. [DOI] [PubMed] [Google Scholar]
- Akita H, Takeda Y, Hoshino H et al. Mural nodule in branch duct-type intraductal papillary mucinous neoplasms of the pancreas is a marker of malignant transformation and indication for surgery. Am J Surg 2011; 202: 214–219. [DOI] [PubMed] [Google Scholar]
- Hwang DW, Jang JY, Lim CS et al. Determination of malignant and invasive predictors in branch duct type intraductal papillary mucinous neoplasms of the pancreas: a suggested scoring formula. J Korean Med Sci 2011; 26: 740–746. [DOI] [PMC free article] [PubMed] [Google Scholar]
- Maguchi H, Tanno S, Mizuno N et al. Natural history of branch duct intraductal papillary mucinous neoplasms of the pancreas: a multicenter study in Japan. Pancreas 2011; 40: 364–370. [DOI] [PubMed] [Google Scholar]
- Arikawa S, Uchida M, Uozumi J et al. Utility of multidetector row CT in dianosing branch duct IPMNs of the pancreas compared with MR Cholangiopancreatography and Endoscopic ultrasonography. Kurume Med J 2010; 57: 91–100. [DOI] [PubMed] [Google Scholar]
- Zhang J, Wang P-J, Yuan X-D. Correlation between CT patterns and pathological classification of intraductal papillary mucinous neoplasm. Eur J Radiol 2010; 73: 96–101. [DOI] [PubMed] [Google Scholar]
- Liu Y, Lin X, Upadhyaya M et al. Intraductal papillary mucinous neoplasms of the pancreas: correlation of helical CT features with pathologic findings. Eur J Radiol 2010; 76: 222–227. [DOI] [PubMed] [Google Scholar]
- Mimura T, Masuda A, Matsumoto I et al. Predictors of malignant intraductal papillary mucinous neoplasm of the pancreas. J Clin Gastroenterol 2010; 44: e224–e229. [DOI] [PubMed] [Google Scholar]
- Nagai K, Doi R, Ito T et al. Single-institution validation of the international consensus guidelines for treatment of branch duct intraductal papillary mucinous neoplasms of the pancreas. J Hepatobiliary Pancreat Surg 2009; 16: 353–358. [DOI] [PubMed] [Google Scholar]
- Ohno E, Hirooka Y, Itoh A et al. Intraductal papillary mucinous neoplasms of the pancreas: differentiation of malignant and benign tumors by endoscopic ultrasound findings of mural nodules. Ann Surg 2009; 249: 628–634. [DOI] [PubMed] [Google Scholar]
- Jang J-Y, Kim S-W, Lee SE et al. Treatment guidelines for branch duct type intraductal papillary mucinous neoplasms of the pancreas: when can we operate or observe? Ann Surg Oncol 2008; 15: 199–205. [DOI] [PubMed] [Google Scholar]
- Pitman MB, Michaels PJ, Deshpande V et al. Cytological and cyst fluid analysis of small (< or =3 cm) branch duct intraductal papillary mucinous neoplasms adds value to patient management decisions. Pancreatology 2008; 8: 277–284. [DOI] [PubMed] [Google Scholar]
- Takeshita K, Kutomi K, Takada K et al. Differential diagnosis of benign or malignant intraductal papillary mucinous neoplasm of the pancreas by multidetector row helical computed tomography: evaluation of predictive factors by logistic regression analysis. J Comp Assist Tomog 2008; 32: 191–197. [DOI] [PubMed] [Google Scholar]
- Rodriguez JR, Salvia R, Crippa S et al. Branch-duct intraductal papillary mucinous neoplasms: observations in 145 patients who underwent resection. Gastroenterology 2007; 133: 72–79. [DOI] [PMC free article] [PubMed] [Google Scholar]
- Sahora K, Mino-Kenudson M, Brugge W et al. Branch duct intraductal papillary mucinous neoplasms: does cyst size change the tip of the scale? A critical analysis of the revised international consensus guidelines in a large single-institutional series. Ann Surg 2013; 258: 466–475. [DOI] [PubMed] [Google Scholar]
- Sadakari Y, Ienaga J, Kobayashi K et al. Cyst size indicates malignant transformation in branch duct intraductal papillary mucinous neoplasm of the pancreas without mural nodules. Pancreas 2010; 39: 232–236. [DOI] [PubMed] [Google Scholar]
- Woo SM, Ryu JK, Lee SH et al. Branch duct intraductal papillary mucinous neoplasms in a retrospective series of 190 patients. Br J Surg 2009; 96: 405–411. [DOI] [PubMed] [Google Scholar]
- Tang RS, Weinberg B, Dawson DW et al. Evaluation of the guidelines for management of pancreatic branch-duct intraductal papillary mucinous neoplasm. Clin Gastroenterol Hepatol 2008; 6: 815–819. [DOI] [PubMed] [Google Scholar]
- Salvia R, Crippa S, Falconi M et al. Branch-duct intraductal papillary mucinous neoplasms of the pancreas: to operate or not to operate? Gut 2007; 56: 1086–1090. [DOI] [PMC free article] [PubMed] [Google Scholar]
- Ingkakul T, Sadakari Y, Ienaga J et al. Predictors of the presence of concomitant invasive ductal carcinoma in intraductal papillary mucinous neoplasm of the pancreas. Ann Surg 2010; 251: 70–75. [DOI] [PubMed] [Google Scholar]
- Cone MM, Rea JD, Diggs BS et al. Endoscopic ultrasound may be unnecessary in the preoperative evaluation of intraductal papillary mucinous neoplasm. HPB (Oxford) 2011; 13: 112–116. [DOI] [PMC free article] [PubMed] [Google Scholar]
- Correa-Gallego C, Warshaw AL, Fernandez-del Castillo C. Fluid CEA in IPMNs: A useful test or the flip of a coin? Am J Gastroenterol 2009; 104: 796–797. [DOI] [PubMed] [Google Scholar]
- Maire F, Voitot H, Aubert A et al. Intraductal papillary mucinous neoplasms of the pancreas: performance of pancreatic fluid analysis for positive diagnosis and the prediction of malignancy. Am J Gastroenterol 2008; 103: 2871–2877. [DOI] [PubMed] [Google Scholar]
- Xu B, Zheng WY, Jin DY et al. Predictive value of serum carbohydrate antigen 19-9 in malignant intraductal papillary mucinous neoplasms. World J Surg 2011; 35: 1103–1109. [DOI] [PubMed] [Google Scholar]
- Pais SA, Attasaranya S, Leblanc JK et al. Role of endoscopic ultrasound in the diagnosis of intraductal papillary mucinous neoplasms: correlation with surgical histopathology. Clin Gastroenterol Hepatol 2007; 5: 489–495. [DOI] [PubMed] [Google Scholar]
- Fritz S, Klauss M, Bergmann F et al. Small (sendai negative) branch-duct ipmns: not harmless. Ann Surg 2012; 256: 313–320. [DOI] [PubMed] [Google Scholar]
- O'Neill E, Hammond N, Miller FH. MR imaging of the pancreas. Radiol Clin North Am 2014; 52: 757–777. [DOI] [PubMed] [Google Scholar]
- Sutton AJ, Cooper NJ, Goodacre S et al. Integration of meta-analysis and economic decision modeling for evaluating diagnostic tests. Med Decis Making 2008; 28: 650–667. [DOI] [PubMed] [Google Scholar]
- Seeram E. Computed tomography. An overview In: Computed Tomography. Physical Principles, Clinical Applications, and Quality Control 3rd edn Saunders Elsevier: St Louis, MO, 2009. pp 1–28. [Google Scholar]
- Raman SP, Horton KM, Fishman EK. Multimodality imaging of pancreatic cancer-computed tomography, magnetic resonance imaging, and positron emission tomography. Cancer J 2012; 18: 511–522. [DOI] [PubMed] [Google Scholar]
- Tirkes T, Sandrasegaran K, Sanyal R et al. Secretin-enhanced MR cholangiopancreatography: spectrum of findings. Radiographics 2013; 33: 1889–1906. [DOI] [PubMed] [Google Scholar]
- Runge VM. Current technological advances in magnetic resonance with critical impact for clinical diagnosis and therapy. Invest Radiol 2013; 48: 869–877. [DOI] [PubMed] [Google Scholar]
- Sandrasegaran K. Functional MR imaging of the abdomen. Radiol Clin North Am 2014; 52: 883–903. [DOI] [PubMed] [Google Scholar]
- Correa-Gallego C, Do R, Lafemina J et al. Predicting dysplasia and invasive carcinoma in intraductal papillary mucinous neoplasms of the pancreas: development of a preoperative nomogram. Ann Surg Oncol 2013; 20: 4348–4355. [DOI] [PubMed] [Google Scholar]
- Bae SY, Lee KT, Lee JH et al. Proper management and follow-up strategy of branch duct intraductal papillary mucinous neoplasms of the pancreas. Dig Liver Dis 2012; 44: 257–260. [DOI] [PubMed] [Google Scholar]
- Kang MJ, Jang JY, Kim SJ et al. Cyst growth rate predicts malignancy in patients with branch duct intraductal papillary mucinous neoplasms. Clin Gastroenterol Hepatol 2011; 9: 87–93. [DOI] [PubMed] [Google Scholar]
- Uehara H, Ishikawa O, Katayama K et al. Size of mural nodule as an indicator of surgery for branch duct intraductal papillary mucinous neoplasm of the pancreas during follow-up. J Gastroenterol 2011; 46: 657–663. [DOI] [PubMed] [Google Scholar]
- Kanno A, Satoh K, Hirota M et al. Prediction of invasive carcinoma in branch type intraductal papillary mucinous neoplasms of the pancreas. J Gastroenterol 2010; 45: 952–959. [DOI] [PubMed] [Google Scholar]
- Salvia R, Partelli S, Crippa S et al. Intraductal papillary mucinous neoplasms of the pancreas with multifocal involvement of branch ducts. Am J Surg 2009; 198: 709–714. [DOI] [PubMed] [Google Scholar]
- Rautou PE, Levy P, Vullierme MP et al. Morphologic changes in branch duct intraductal papillary mucinous neoplasms of the pancreas: a midterm follow-up study. Clin Gastroenterol Hepatol 2008; 6: 807–814. [DOI] [PubMed] [Google Scholar]
- Tanno S, Nakano Y, Nishikawa T et al. Natural history of branch duct intraductal papillary-mucinous neoplasms of the pancreas without mural nodules: long-term follow-up results. Gut 2008; 57: 339–343. [DOI] [PubMed] [Google Scholar]
Associated Data
This section collects any data citations, data availability statements, or supplementary materials included in this article.


