

Abstract
The Ufm1 conjugation system is a novel ubiquitin-like modification system, consisting of Ufm1, Uba5 (E1), Ufc1 (E2) and poorly characterized E3 ligase(s). RCAD/Ufl1 (also known as KIAA0776, NLBP and Maxer) was reported to function as a Ufm1 E3 ligase in ufmylation (Ufm1-mediated conjugation) of DDRGK1 and ASC1 proteins. It has also been implicated in estrogen receptor signaling, unfolded protein response (UPR) and neurodegeneration, yet its physiological function remains completely unknown. In this study, we report that RCAD/Ufl1 is essential for embryonic development, hematopoietic stem cell (HSC) survival and erythroid differentiation. Both germ-line and somatic deletion of RCAD/Ufl1 impaired hematopoietic development, resulting in severe anemia, cytopenia and ultimately animal death. Depletion of RCAD/Ufl1 caused elevated endoplasmic reticulum stress and evoked UPR in bone marrow cells. In addition, loss of RCAD/Ufl1 blocked autophagic degradation, increased mitochondrial mass and reactive oxygen species, and led to DNA damage response, p53 activation and enhanced cell death of HSCs. Collectively, our study provides the first genetic evidence for the indispensable role of RCAD/Ufl1 in murine hematopoiesis and development. The finding of RCAD/Ufl1 as a key regulator of cellular stress response sheds a light into the role of a novel protein network including RCAD/Ufl1 and its associated proteins in regulating cellular homeostasis.
The Ufm1 (Ubiquitin-fold modifier 1) conjugation system is a novel ubiquitin-like (Ubl) modification system that shares biochemical features with other Ubl systems.1 Ufm1 modifies its target proteins through a biochemical pathway catalyzed by specific E1 (Uba5), E2 (Ufc1) and E3 enzyme(s) even though the identities of E3 ligases remain mostly elusive. Genetic study from Uba5 knockout (KO) mice has shown that Uba5 is indispensable for embryonic erythropoiesis, highlighting the pivotal role of this novel Ubl system in animal development.2 Yet its role in adult erythropoiesis and other developmental processes is largely unexplored and the underlying molecular mechanism remains poorly understood.
Regulator of C53 and DDRGK1 (also known as KIAA0776, Ufl1, NLBP and Maxer, referred to as RCAD hereafter) has recently been identified by independent studies as an important regulator of several signaling pathways, including protein ufmylation, NF-κB signaling and unfolded protein response (UPR).3, 4, 5, 6, 7, 8, 9 Endogenous RCAD forms a complex with two proteins: C53 (also known as LZAP and Cdk5rap3) 5, 6, 10 and DDRGK1 (also designated as C20orf116, Dashurin and UFBP1),3, 6, 7, 11 and regulates the stability of its binding partners.5, 6 Intriguingly, Tatsumi et al.3 found that Ufl1 (same as RCAD) promoted ufmylation of DDRGK1, suggesting that RCAD may function as an E3 ligase for ufmylation of DDRGK1. In line with its role in ufmylation, knockdown of endogenous RCAD resulted in attenuated ufmylation of endogenous Ufm1 targets.7, 8 More recently, Yoo et al.12 found that Ufl1-mediated ufmylation of ASC1, a nuclear receptor co-activator, played a crucial role in estrogen receptor signaling and breast cancer development. Nonetheless, the in vivo function of RCAD remains completely unknown.
In this study, we report the establishment of RCAD KO mouse models. Ablation of RCAD leads to impaired embryogenesis and defective hematopoiesis. Our study provides the first genetic evidence for the indispensable role of this important protein in animal development.
Results
RCAD is essential for embryonic erythroid development
To investigate RCAD's in vivo function, we generated RCAD KO mice. The murine RCAD gene is located in chromosome 4 and consists of 19 exons (Supplementary Figure 1a). Based upon the ‘knockout first' strategy,13 a gene trap cassette flanked by two FRT sites was inserted into the intron between exons 6 and 7 and followed by floxed exon 7, generating a RCADTrap-F allele (Figure 1a). Insertion of the gene trap was confirmed by Southern blotting and genomic PCR (Supplementary Figures 1c and d). Disruption of RCAD expression was confirmed by the complete absence of RCAD protein in the embryos with homozygous trapped alleles (Figure 1b). Therefore, the mice with homozygous trapped alleles (RCADTrap-F/Trap-F) were designated as RCAD−/− or RCAD KO mice.
Figure 1.

RCAD is essential for embryonic erythropoiesis. (a) The targeting vector of RCAD allele. (b) Immunoblotting of RCAD protein in WT and KO embryos. (c) The number of embryos from timed-pregnant mice. (d) Hematoxylin & eosin staining of fetal livers of WT and KO E11.5 embryos. (e) Wright-Giemsa staining of peripheral blood cells from WT and KO E11.5 embryos. Scale bar: 20 μm. (f) Hematoxylin & eosin staining of representative circulating erythrocytes in WT and KO E11.5 embryos. Scale bar: 20 μm. (g) Percentage of abnormal multinucleated erythrocytes in peripheral blood cells of E11.5 embryos. *P<0.001 (n=3). (h) CFU-Es and BFU-Es in E11.5 fetal livers. The data represent the values of three embryos from each group. *P<0.001 (n=3). (i) Expression of the erythroid genes in E11.5 fetal livers. Total RNAs were purified from fetal livers of E11.5 embryos and subject to RT-PCR analysis. The ratio of KO to WT was presented. *P<0.01 (n=3). Data are presented as means±S.D.
Among 85 adult mice, we failed to obtain RCAD−/− animals, whereas 29 RCAD+/+ and 56 RCAD+/− mice were born healthy and appeared normal, indicating a possible embryonic lethality caused by loss of RCAD. By analyzing the embryos of timed-pregnant mice, we found that most RCAD−/− embryos could survive until E11.5, but some died as early as E10.5 (Figure 1c). RCAD−/− embryos appeared anemic and smaller than their wild-type (WT) and heterozygous littermates (Supplementary Figure 1e), and RCAD−/− fetal livers were also smaller (Figure 1d). Additionally, there were a high number of abnormal multinucleated erythrocytes in RCAD−/− embryos (Figures 1e–g), a phenotype reminiscent of Uba5 null embryos.2 The numbers of erythroid colony-forming units (CFU-Es) and more immature erythroid burst-forming units (BFU-Es) from fetal livers (E11.5) were significantly lower in RCAD−/− fetal livers (Figure 1h), suggesting impaired development of erythroid progenitors. Accordingly, the genes associated with the erythroid lineage, including ɛ-globin, βH1-globin and transcription factors GATA-1/FOG-1 and Klf1, were markedly underexpressed in RCAD−/− fetal livers (Figure 1i). Collectively, our results strongly suggest that RCAD is essential for embryonic erythropoiesis, development and survival.
RCAD loss causes severe anemia and cytopenia in adult mice
To further investigate the in vivo role of RCAD in hematopoiesis, we generated inducible conditional KO (CKO) mice of RCAD via a two-step procedure: (1) removal of the gene trap cassette by crossing RCADTrap-F/+ mice with FLPo deleter mice; and (2) subsequent introduction of tamoxifen (TAM)-inducible Cre recombinase CreERT2 under the ROSA26 promoter. As shown in Figure 2a, TAM administration in RCADF/F:ROSA26-CreERT2 mice (designated as RCADF/F:CreERT2 hereafter) resulted in nearly complete loss of RCAD protein in bone marrow (BM) cells (Figure 2a) and other organs (Supplementary Figure 2a). Interestingly, ufmylation of endogenous targets was significantly attenuated in RCAD-deficient BM cells (Supplementary Figure 2b).
Figure 2.

Loss of RCAD in adult mice results in severe anemia, cytopenia and animal death. (a) Confirmation of RCAD loss in bone marrow cells of TAM-injected CKO (RCADF/F:CreERT2) mice. Floxed mice were IP injected with tamoxifen according to a standard protocol. BM cells were collected and subject to immunoblotting of RCAD. (b) Survival curve of RCAD-deficient mice after TAM injection, P<0.002 (n=5 each group). (c) The result of CBC counts. Data are presented as means±S.D. The blood was drawn from control (RCADF/F) (n=4) and RCAD-deficient mice (RCADF/F:CreERT2) (n=5) when RCAD-deficient mice became moribund and/or lost 20% of body weight after TAM injection (2–3 weeks post-TAM treatment). The blood samples were subjected to CBC counting. The mice used in this experiment were ~8-week-old male mice. Female RCAD-deficient mice exhibited the similar phenotype (data not shown). GRA, granulocyte; HCT, hematocrit; Hgb, hemoglobin; LYM, lymphocyte; MON, monocyte; PLT, platelet; RBC, red blood cell; WBC, white blood cell
Although WT:ROSA26-CreERT2 and RCADF/F mice were fairly normal after TAM administration (data not shown), TAM-induced ablation of RCAD in RCADF/F:CreERT2 mice led to substantial loss of body weight and ultimately animal death around 3 weeks after initial TAM treatment (Figure 2b). As indicated by color of blood and BM as well as the complete blood count (CBC), RCAD-deficient mice exhibited severe anemia and pancytopenia, which may be the primary cause for animal death. The major indices for erythrocytes, including RBC (red blood cell) count, Hgb (hemoglobin) content and HCT (hematocrit), were significantly lower in RCAD-deficient mice (Figure 2c). Furthermore, total white blood cell counts, including lymphocytes, granulocytes, monocytes, as well as platelet counts were also dramatically decreased in RCAD-deficient mice (Figure 2c). This result provides the first genetic evidence for the indispensable role of RCAD in adult hematopoiesis.
Loss of RCAD impairs erythroid differentiation at multiple developmental stages
According to Pronk et al,14 six resolvable cell populations, including Pre MegE (Pre megakaryocyte/erythrocyte), CFU-E, Pre CFU-E, MkP (megakaryocyte progenitor), Pre GM (Pre granulocyte/macrophage) and GMP (granulocyte/macrophage progenitor), are identified within the myeloerythroid precursor cells (Lin-Sca-1-c-kit+ IL-7R-) using a combination of CD16/32, CD41, CD105 (endoglin) and CD150 (Slamf1) markers (Figure 3a). To further define the role of RCAD in early stage of erythropoiesis, we analyzed erythroid development in TAM-treated either RCADF/F or RCADF/F:CreERT2 mice. The myeloerythroid (Lin-Sca-1-c-kit+IL-7R-) fraction of BM cells was subject to flow cytometry analysis, and significant changes in myeloid and erythroid lineages were observed in RCAD-deficient BM cells. Interestingly, the percentages of all types of erythroid progenitors, including Pre MegE (7.55±0.93% versus 1.06±0.11%), Pre CFU-E (6.81±1.12% versus 0.25±0.11%) and CFU-E plus proerythroblasts (33.57±4.27% versus 1.48±0.58%), were significantly decreased in TAM-treated RCADF/F:CreERT2 mice than similarly treated RCADF/F mice (Figures 3a and b), while MkP was modestly decreased (5.4±0.6% versus 4.4±0.4%). In addition, differentiation from CFU-Es (TER119low) to proerythroblasts (TER119high) was almost completely blocked by loss of RCAD (Figure 3a). By contrast, the percentage of GMPs (18.8±8.06% versus 81.77±2.59%) was substantially increased in RCAD-deficient BM, while the percentage of Pre GMs (13.47±1.65% versus 7.46±1.68%) was modestly decreased (Figures 3a and b). Accordingly, the total cell numbers of erythroid progenitors in RCAD-deficient BM were significantly decreased, but the number of GMPs was dramatically elevated (Figure 3c). Quantitative RT-PCR analysis showed that the genes associated with the erythroid lineage such as Gata-1, Fog-1, Klf1 and Scl, were underexpressed in BM and sorted myeloerythroid precursor cells, but expression of Pu.1, a gene associated with myeloid lineage, was either upregulated in BMs or not altered in sorted cells (Figures 3d and e). In contrast to elevation of GMPs in BM, the numbers of mature myeloid cells (granulocytes and monocytes) in peripheral blood were decreased (Figure 2c), indicating a possible developmental defect in myeloid lineages. Indeed, the numbers of CFU-Gs, CFU-Ms and CFU-GMs in RCAD-deficient BM were significantly decreased (Supplementary Figure 3). Taken together, these results suggest that RCAD plays a critical role in multiple stages of erythropoiesis including progenitor development and terminal differentiation as well as development of myeloid lineages.
Figure 3.

RCAD deficiency impairs lineage development of erythroid cells. (a) Flow cytometry analysis of erythroid and myeloid lineages in control and RCAD-deficient mice after TAM injection. BM cells were collected from TAM-injected control (n=3) and floxed (n=3) male mice when RCAD-deficient mice exhibited significant weight loss and became moribund. The following markers were used for flow analysis: BV510-Sca-1, APC780-c-Kit, PE-Cy7-CD150, Alexa 700-CD16/32, PE-IL-7R, APC-CD41, BV650-CD105, FITC-CD71 and BV421-TER119, and lineage markers including PerCP-Cy5.5 conjugated CD4, CD8, CD3, CD5, Gr-1, CD11b, CD19 and B220. (b) The percentages of each lineage in L-S-K+ cells. *P<0.01, and **P<0.05 (n=3). (c) The absolute cell numbers of each lineage in BMs. There was no significant difference in the total BM cell numbers between control and RCAD-deficient mice (around 5 × 10⁷ cells). *P<0.01 (n=3). (d) Quantitative analysis of gene expression in total BM cells. *P <0.01 (n=3). (e) Quantitative analysis of gene expression in sorted myeloerythroid precursor cells. *P <0.01 (n=3). Data are presented as means±S.D.
RCAD is essential for HSC function in a cell-autonomous manner
RCAD-deficient mice also exhibited a severe cytopenia in peripheral blood (Figure 2c), indicating that RCAD loss may impair the function of hematopoietic stem cells (HSCs) and downstream progenitor cells. Consistent with this hypothesis, RCAD-deficient BMs failed to rescue lethally irradiated recipient mice (Supplementary Figure 4). To assess the cell intrinsic role of RCAD in hematopoiesis, we performed competitive repopulation assays. Unfractionated BM cells from either RCADF/F or RCADF/F:CreERT2 (CD45.2) were mixed with WT (CD45.1) BM cells at a 1 : 1 ratio, and co-transplanted into lethally irradiated recipient CD45.1 mice (Figure 4a). Four weeks after transplantation, the contribution of RCADF/F and RCADF/F:CreERT2 cells to peripheral myeloid and lymphoid lineages was approximately equal, indicating establishment of chimerism (data not shown, also see the oil-injected mice in Figure 4). Subsequently, mice were treated with either oil or tamoxifen. Three weeks after initiation of the treatment, we examined the contribution of RCAD-deficient cells to HSCs and other progenitor cells in BM. As shown in Supplementary Figure 5, the contribution of RCAD-deficient (RCADF/F:CreERT2) cells to L−S+K+ population was substantially diminished after TAM treatment comparing with oil treatment (50.0±1.5% versus 8.0±0.5%). By contrast, TAM treatment yielded no effect on the contribution of RCADF/F cells (Supplementary Figure 5). Further analysis using the CD150 marker showed that the contribution of RCAD-deficient cells to both long-term HSCs (L−S+K+CD150+) (7.2±0.8% versus 1.0±0.2%) and multipotent progenitors (L−S+K+CD150-) (45.0±1.2% versus 8.5±0.4%) was significantly reduced (Figure 4b). In accordance with this, other progenitor cells, including oligopotent progenitors (L−S−K+) (38.0±0.4% versus 3.8±0.1%), MkP (L−S−K+IL-7R-CD41+) (61.4±3.3% versus 3.6±0.3%) and myeloerythroid progenitors (L−S−K+IL-7R-CD41−) (36.4±0.4% versus 3.8%±0.2%), contained much lower level of RCAD-deficient cells (Figure 4c and Supplementary Figure 6). Taken together, our results suggest that RCAD plays a crucial role in HSC function in a cell-autonomous manner.
Figure 4.

RCAD is essential for maintaining HSC function. (a) Experimental scheme for competitive repopulation assay. The unfractionated BM cells from either RCADF/F or RCADF/F:CreERT2 (CD45.2) were mixed with wild-type (CD45.1) BM cells at a 1:1 ratio, and co-transplanted into lethally irradiated recipient CD45.1 mice. Four weeks after transplantation, the mice were treated with either oil or TAM. Three weeks after initiation of the treatment, the BM cells were isolated and subjected to flow analysis using indicated markers. (b) Contribution of RCAD-deficient cells (CD45.2) to long-term HSCs (L-S+K+CD150+) and multipotent progenitors (L-S+K+CD150-). *P<0.001 (n=5). (c) Contribution of RCAD-deficient cells (CD45.2) to oligopotent progenitor cells (L-S-K+). *P<0.001 (n=5). Data are presented as means±S.D.
Depletion of RCAD causes aberrant p53 activation
The result of competitive repopulation assay suggests that loss of RCAD may lead to either apoptosis or cell cycle arrest of HSCs. L−S+K+ cells sorted from RCADF/F: CreERT2 BM were treated with either solvent (ethanol) or 4-hydroxytamoxifen (4-OHT), and evaluated for cell proliferation and survival. More than 90% of RCAD protein was depleted after 4-day treatment of 4-OHT (Figure 5a). Interestingly, depletion of RCAD led to a significant decrease of proliferation, increase of cell death and cell cycle arrest in HSCs (Figures 5a–c), while 4-OHT-treatment did not affect proliferation and survival of WT:CreERT2 and RCADF/F HSCs (Supplementary Figure 7).
Figure 5.

Loss of RCAD leads to p53 activation and cell death of HSCs. (a) Proliferation of wild-type and RCAD-deficient HSCs. HSCs were sorted from BM of RCADF/F:CreERT2 mice, and cultured in the absence or presence of 4-OHT (1 μM) for indicated period of time. Cell numbers were manually scored. The experiment was performed three times independently. (b) Cell death of RCAD-deficient HSC cells. Cell death was elevated by DNA dye exclusion assay. (c) Cell cycle profile of RCAD-deficient HSCs. Cell cycle profile of HSCs was analyzed by PI staining after 4-day treatment of either EtOH or 4-OHT (1 μM). *P<0.01 (n=3). (d) Upregulation of p21 and Bax genes in RCAD-deficient cells. Relative mRNA levels of p21, Bax and p53 were evaluated by RT-PCR analysis. *P<0.01 (n=3). (e) Immunoblotting of p21 and p53 in EtOH and 4-OHT-treated HSCs. HSCs were harvested at indicated time points, and subjected to immunoblotting of p21, p53, RCAD and β-actin. (f) Phosphorylation of H2A.X in RCAD-deficient BM cells. After tamoxifen treatment, BM cells from either RCADF/F (WT) or RCADF/F:CreERT2 (CKO) mice were harvested. Cell lysates were subjected to immunoblotting of indicated antibodies. (g) Phosphorylation of H2A.X in RCAD-deficient HSCs. Sorted HSCs were treated with either EtOH or 4-OHT (1 μM) for 2 days. (h) The effect of PFT-α on induction of p21 and Bax in RCAD-deficient HSCs. HSCs were cultured in the media containing indicated reagents (4-OHT, 1 μM; PFT-α, 10 μM) for 4 days and harvested. Total RNA was isolated and subjected to RT-PCR analysis. The results were normalized to the mRNA levels of p21 and Bax in HSCs treated with solvent (EtOH and DMSO), respectively. *P<0.01 (n=3). (i) The effect of PFT-α on cell death of HSCs. HSCs were cultured in the media containing indicated reagents (4-OHT, 1 μM; PFT-α, 10 μM) for 4 days, and cell death was scored by DNA dye exclusion assay. *P<0.01 (n=3). Data are presented as means±S.D.
p53 is a major molecular sensor of cellular stresses that promotes cell cycle arrest, senescence and cell death.15, 16, 17, 18, 19 It also has a pivotal role in maintaining homeostasis of HSCs and progenitor cells under normal and stress conditions.20 We examined p53 activation in RCAD-deficient cells. As shown in Figure 5d, expression of two p53 targets, p21WAF1 and Bax,21, 22 was substantially upregulated in 4-OHT-treated HSCs, while the level of p53 mRNA was not significantly changed (Figure 5d). The protein levels of p53 and its target p21WAF1 were also elevated in 4-OHT-treated HSCs (Figure 5e). Furthermore, phosphorylation of H2A.X was substantially increased in both RCAD-deficient BM cells (in vivo, Figure 5f) and HSCs (in vitro, Figure 5g), indicating that loss of RCAD elicits DNA damage response and p53 activation. To further interrogate the role of p53, we took advantage of pifithrin-α (PFT-α), a cell-permeable p53 inhibitor that blocks p53 transcriptional activity and reduces the side effects of chemotherapy.23 The presence of PFT-α (10 μM) itself somewhat caused slower cell proliferation and cell death of HSCs (data not shown and Figure 5i), probably due to its inhibitory activity toward other signaling pathways such as heat shock response, glucocorticoid signaling and p73 pathway.24, 25 Nonetheless, treatment with PFT-α significantly blocked upregulation of p21 and Bax (Figure 5h) as well as cell death (Figure 5i) induced by RCAD loss. These results suggest that aberrant p53 activation may cause apoptosis and cell cycle arrest in RCAD-deficient HSCs.
RCAD deficiency leads to elevated ER stress and activation of the unfolded protein response (UPR)
It has been reported that RCAD mainly localizes to the endoplasmic reticulum (ER) membrane and plays a protective role in ER stress-induced apoptosis, and depletion of RCAD readily activates the UPR in osteosarcoma cells.7, 8 TAM-induced depletion of RCAD in BM cells led to up-expression of ER chaperones Grp78 and ERdj4 (Figure 6a), elevation of phosphorylation of eIF2α (Figure 6b), and Xbp-1 mRNA alternative splicing (Figure 6c), all of which are the markers for elevation of ER stress and activation of the UPR. Furthermore, cell death genes including Bax, Noxa, Puma and DR5 were also upregulated by RCAD depletion (Figure 6d). These results suggest that RCAD functions as a cytoprotective role in cell stress response, which is consistent with previous results in other cells.7, 8
Figure 6.

Loss of RCAD leads to elevated ER stress and activation of the UPR. (a) Upregulation of UPR genes including Grp78, ERdj4 and CHOP. Total RNA was isolated from BM cells that were harvested from three pairs of littermate treated with tamoxifen treatment, and subjected to RT-PCR analysis. *P<0.01 (n=3). (b) Elevation of phosphorylation of eIF2α and Grp78 expression in RCAD-deficient BM cells. The total cell lysates were subjected to immunoblotting of indicated antibodies. (c) Xbp-1 mRNA splicing in RCAD-deficient BM cells. Total RNA were isolated from BM cells of control and tamoxifen treated mice, and subjected to Xbp-1 splicing assay as described in 8. (d) Upregulation of cell death genes in RCAD-deficient BM cells. *P<0.01 (n=3)
RCAD deficiency impairs autophagic degradation
Given the cytoprotective function of autophagy in cellular stress response, we also examined autophagy in RCAD-deficient cells. Interestingly, LC3-II, a lipidated form of LC3, and p62, an autophagic substrate, were significantly accumulated in RCAD-depleted BM cells (Figure 7a) and HSCs (Figure 7b), while their mRNA levels remained unchanged (data not shown). The increase of both LC3-II and p62 indicates that RCAD depletion may impede autophagic degradation rather than initiation of autophagy. Previous studies have shown that deficiency in autophagy causes accumulation of reactive oxygen species (ROS) and mitochondrial mass in HSCs.26, 27 In TAM-treated RCAD CKO mice, we observed the increase of ROS (DCF-DA staining, Figure 7c) and mitochondrial mass (Mitotracker-Green staining in Figure 7d, and COX IV blotting in Figures 7a and b) in RCAD-deficient HSCs. We further tested if impairment of autophagic degradation is a general phenomenon in RCAD-depleted cells. shRNA-mediated knockdown of endogenous RCAD resulted in accumulation of LC3-II and p62 in HCT116 and HEK293T cells (Supplementary Figure 8). 4-OHT-induced depletion of RCAD in immortalized mouse embryonic fibroblast (MEF) cells also led to accumulation of LC3-II and p62 proteins (Figure 7e), increase of LC3 puncta (Figure 7f) and autophagic vacuoles (Figure 7g), suggesting that RCAD is indeed a general regulator of autophagy. We also examined autophagic flux in WT and RCAD-depleted MEF cells. In WT cells, LC3-II was dramatically accumulated upon choloroquine (CQ, a lysosomotropic agent) treatment due to inhibition of lysosomal degradation (Figure 7h). Depletion of RCAD resulted in accumulation of LC3-II in untreated cells, and importantly, CQ-induced LC3-II accumulation was substantially reduced in RCAD-depleted cells, indicating that RCAD depletion causes an attenuation of autophagic flux (Figure 7h). Taken together, our results suggest that RCAD plays a critical role in regulation of autophagic degradation. The combination of ER stress and attenuation of autophagic degradation in RCAD-deficient cells may cause accumulation of ROS and other cellular damages, which in turn induces aberrant p53 activation and cell death of HSCs.
Figure 7.

Depletion of RCAD blocks autophagic degradation. (a) Accumulation of LC3-II, p62 and COX IV in RCAD-deficient BM cells. The relative ratio of CKO versus WT for each protein is presented as means±S.D. (n=3) with normalization against actin (Image J software, NIH, Bethesda, MD, USA). *P<0.001 (n=3). (b) Accumulation of LC3-II, p62 and COX IV in RCAD-deficient HSC cells. Sorted HSCs were treated with either ethanol (EtOH) or 4-OHT for 2 days. The levels of indicated proteins were quantified with Image J software and normalized against actin. (c) Increase of ROS in RCAD-deficient HSCs. WT and RCAD-deficient BM cells were collected and stained with Lineage, Sca-1 and c-Kit markers along with DCF-DA. Relative MFI (mean fluorescent intensity) was normalized against WT cells, and data are presented as means±S.D. (n=4). (d) Increase of mitochondrial mass in RCAD-deficient HSCs. WT and RCAD-deficient BM cells were collected and stained with Lin, Sca-1 and c-Kit markers along with Mitotracker-Green. Relative MFI (mean fluorescent intensity) was normalized against WT cells, and data are presented as means±S.D. (n=4). (e) Accumulation of LC3-II and p62 in RCAD-deficient MEF cells. Large T-transformed RCADF/F:CreERT2 MEF cells were treated with either EtOH or 4-OHT for 4 days, and subject to immunoblotting of indicated antibodies. (f) Accumulation of LC3 puncta in RCAD-deficient MEF cells. The number of endogenous LC3 puncta was manually scored in more than 100 cells. Data are presented as means±S.D. (g) Accumulation of autophagic vacuoles in RCAD-deficient MEF cells. The number of autophagic vacuoles was manually scored in more than 20 cells. Autophagic vacuoles are indicated by filled arrowheads. Data are presented as means±S.D. (h) Autophagic flux in RCAD-deficient MEF cells. The control (EtOH-treated) and RCAD-deficient (4-OHT-treated for 3 days) MEF cells were treated with CQ (200 μM) for 1 and 2 h, and the cell lysates were subjected to immunoblotting of specific antibodies. LC3-II level was quantified by Image J software with normalization against actin
Discussion
We report here that RCAD is essential for murine hematopoiesis in both embryonic and adult stages. Ablation of RCAD caused anemia, cytopenia and animal death (Figures 1 and 2). RCAD-deficient HSCs failed to compete with WT cells (Figure 5). Loss of RCAD led to elevated ER stress and activation of the UPR in vitro and in vivo (Figure 6). Additionally, RCAD deficiency caused impairment of autophagic degradation that led to accumulation of ROS and mitochondrial mass, aberrant p53 activation and apoptosis of HSCs (Figure 7). Taken together, our findings establish the essential role of RCAD in murine development and provide a critical insight into the molecular and cellular mechanism of RCAD function.
Recent studies have demonstrated that RCAD functions as a Ufm1 E3 ligase to promote ufmylation of DDRGK1 and ASC1.3, 12 Interestingly, Uba5 and RCAD KO mice exhibit broad phenotypic similarities. First, inactivation of either gene led to defective embryonic erythropoiesis and lethality (Figure 1 and Tatsumi et al.2). Second, Uba5 deficiency causes impaired development of MEPs, but not GMPs, in fetal livers, while conditional deletion of RCAD in adult mice resulted in defective development of MegE progenitors but not GMPs (Figure 3 and Tatsumi et al.2). Third, a high number of multinucleated erythroid cells were found in both Uba5 and RCAD KO embryos (Figure 1 and Tatsumi et al.2). These phenotypic similarities between Uba5 and RCAD KO mice strongly suggest that they may function in the similar cellular process(es) or signaling pathways during erythroid development. Intriguingly, a genome-wide association study has identified one single-nucleotide polymorphisms (rs11697186) in DDRGK1 gene that is strongly associated with anemia and thrombocytopenia in peggylated interferon and ribavirin therapy for chronic hepatitis C patients, which provides clinical evidence for possible involvement of DDRGK1 in regulation of hematopoiesis.28
One of our key findings is that RCAD deficiency causes elevated ER stress and activation of the UPR in hematopoietic cells (Figure 6), a result that is consistent with a previous report on the cytoprotective role of the Ufm1 system in ER stress-induced apoptosis of pancreatic β-cells.7 The UPR is a highly coordinated program that facilitates protein folding, processing, export and degradation of proteins during cellular response to ER stress. Although the UPR serves as a cytoprotective mechanism to restore ER homeostasis, persistent activation of the UPR leads to cell death and tissue damage.29 It was reported that HSCs and other progenitor cells exhibit distinct cellular response to extracellular ER stressors, and the UPR has a critical role in governing the integrity of HSC pool during stress.30 Therefore, it is plausible that RCAD and the Ufm1 system are important players in modulating HSC's response to ER stress.
We also found that RCAD depletion impeded autophagic flux (Figure 7). Autophagy plays a pivotal role in hematopoiesis, including maintenance of HSC functions,26, 31, 32 lymphocyte survival33, 34 and erythroid cell maturation.27, 35 Loss of either FIP200 or ATG7, two essential components for initiation of autophagosome formation, leads to accumulation of mitochondrial mass and ROS in HSCs, resulting in impaired HSC function.26, 31 In agreement with its role in autophagy, loss of RCAD also led to increased mitochondrial mass, accumulation of ROS and impaired HSC function (Figure 7). Interestingly, erythroid progenitors, but not Pre GMs and GMPs, appeared to be more susceptible to RCAD deficiency, indicating that erythroid progenitors are more dependent on the cytoprotective function of autophagy (Figure 3). This result is consistent with previous reports demonstrating that FOXO3A- and GATA-1-driven pro-autophagy gene programs function as a cytoprotective mechanism in HSCs and erythroid progenitors.32, 36 However, RCAD KO mice appear to exhibit more severe phenotype comparing to either ATG7 or FIP200 KO mice. RCAD KO embryos usually died around E11.5. In comparison, FIP200 KO embryos can survive until E15.5,37 while KO of ATG7 leads to neonatal lethality.38 The phenotypic differences of these KO mice may reflect distinct roles of these proteins in cellular stress response. First, RCAD depletion results in elevated ER stress and UPR activation that was not reported in ATG7 or FIP200 KO mice.26, 31 Additionally, we did not observe significant upregulation of UPR genes in BM cells treated with lysosomal inhibitor CQ (data not shown), indicating that inhibition of autophagy does not necessarily leads to ER stress in BM cells. Second, while FIP200 and ATG7 regulate the early stage of autophagy, RCAD appears to be involved in the late stage of autophagy. It is plausible that accumulation of excessive and defective autophagosomes/autolysomes (e.g., in RCAD KO cells) is more detrimental to cells than lack of basal autophagy (e.g., in Atg7 KO cells). Young et al.39 showed that autophagosomal membrane serves as a platform for an intracellular death-induction signaling complex (iDISC) to trigger caspase activation and apoptosis when MEFs were treated with SKI-I, a pan-sphingosine kinase inhibitor, and bortezomib, a proteasome inhibitor. Therefore, it is likely that a combination of ER stress and defective autophagy may contribute to the enhanced severity of RCAD KO mice when comparing with ATG7 and FIP200 KO mice.
The remaining question is how RCAD is involved in regulation of ER stress response and autophagic degradation. Given the fact that RCAD and its associated proteins are mostly associated with the subcellular membranes, it is plausible that RCAD and the Ufm1 system may constitute a novel protein network broadly involved in regulation of membrane dynamics and homeostasis. The genetic study in Caenorhabditis elegans indicates that the Ufm1 system is involved in regulation of the UPR.40 Furthermore, C53 protein, one of RCAD downstream targets, has been shown to be a microtubule-binding protein.41 C53 KO leads to cell cycle defects and early embryonic lethality,42 and depletion of C53 protein in tissue culture cells dramatically decreases the numbers of several types of intracellular vesicles (our unpublished observation). Therefore, we postulate that the RCAD/C53/DDRGK1 complex has an important role in regulation of intracellular vesicle trafficking. Depletion of either component of the complex may cause disruption of vesicle trafficking from the ER, thereby resulting in elevated ER stress. Additionally, since the ER is one of the primary sources of the autophagosome membranes,43, 44 it is plausible that disruption of the ER homeostasis upon RCAD depletion also causes impairment of autophagic flux. Further studies will elucidate this regulatory mechanism of cellular homeostasis mediated by RCAD and the Ufm1 conjugation system.
Materials and Methods
Tissue culture cells and chemical reagents
HEK 293T (ATCC) and HCT116 cells (ATCC) were cultured in Dulbecco's modified Eagle's medium (DMEM) supplemented with 10% fetal bovine serum and antibiotics. Chloroquine, tamoxifen, 4-hydroxytamoxifen, DCF-DA (2′-7′-dichlorofluorscein diacetate) and other chemical reagents were purchased from Sigma (St. Louis, MO, USA). Mitotracker-Green was purchased from Invitrogen, Grand Island, NY, USA
Generation of RCAD KO and CKO mice and genotyping
ES cell clone EPD0169-03-F12 (JM8.N4 with C57BL/6N background) was purchased from the EUCOMM (European Conditional Mouse Mutagenesis) team. The ES cells were injected into the blastocysts of C57BL/6 mice (Northwestern University Transgenic and Targeted Mutagenesis Laboratory). Chimeric mice were crossed with B6(Cg)-TyrC-2J/J albino mice, and heterozygous offspring with germ-line transmission were confirmed by genotyping.
To generate CKO mice, we crossed RCADTrap-F/+ mice with FLPo deleter mice (B6(C3)-Tg(Pgk1-FLPo)10Sykr/J, The Jackson Laboratory, Bar Harbor, ME, USA) to remove the gene trap cassette. The floxed RCAD mice were crossed with ROSA26-CreERT2 mice (B6.129-Gt(ROSA)26Sor<tm1(cre/ERT2) Tyj>/J, The Jackson Laboratory) in which CreERT2 was inserted into ROSA26 locus. Cre-mediated deletion of RCAD was induced by tamoxifen administration. Tamoxifen (20 mg/ml in corn oil, Sigma) was administrated by 5-day IP injection with an approximate dose of 75 mg tamoxifen/kg body weight. All animal procedures were approved by IACUC of Georgia Regents University.
The following primers were used for PCR genotyping of RCAD KO embryos and mice: 5′-1 (AAGACCATTGACTTACATACTTGA), 5′-2 (CACAACGGGTTCTTCTGTTAG TCC) and 5′-3: (ACCCTGTACACGTACCATTTCTAG). A 35-cycle (92 oC, 45 s; 55 oC, 45 s; 72 oC 45 s) PCR was performed in the present of 1% DMSO, and the determination of genotypes was described in Supplementary Figure 1. For the floxed mice, 5′-4 (ccacatacatttaagtcacatcacac) and 5′-3 primers were used in PCR genotyping. Genotyping of Cre-ERT2 mice was performed according to the standard protocol of the Jackson Laboratory.
Competitive repopulation assay
Recipient mice (CD45.1) were first irradiated with dose of 9 Gy. BM cells from RCADF/F and RCADF/F;ROSA-CreERT2 mice (CD45.2) were isolated, mixed with BM cells from CD45.1 mice in a 1 : 1 ratio (1 × 10⁶ cells total), and subsequently injected into the retro-orbital venous sinus of anesthetized recipient mice (five mice per group). After a 4-week recovery period, tamoxifen was administered in 5 consecutive days. Donor cell engraftment was monitored by flow cytometry of the blood samples from tail veins in a 2-week interval using lineage markers. After 3 weeks of tamoxifen injection, BM cells were subjected to flow analysis.
CBC counting and colony formation assays of BFU-Es, CFU-Es, CFU-Gs, CFU-Ms and CFU-GMs
Fetal liver cells (5000 cells) were plated in one ml of serum-free methylcellulose and IMDM (M3234, STEMCELL Technologies, Vancouver, BC, Canada) supplemented with 10% fetal bovine serum. For CFU-Es, cells were cultured for 3 days in the presence of hEpo (2 units/ml, Epogen, Amgen, Thousand Oaks, CA, USA) and stained with benzidine dihydrochloride, and the number of colonies is scored. For BFU-Es, cells were cultured in the presence of hEpo (2 units/ml) and mSCF (100 ng/ml, Peprotech, Rocky Hill, NJ, USA) for 7 days, stained and scored. For CFU-Gs, CFU-Ms and CFU-GMs, BM cells (20 000) were cultured in M3434 (STEMCELL Technologies) for 12 days, and the numbers of the colonies were manually counted.
CBC counts of blood samples from adult mice were analyzed by Laboratory Solutions, Inc. (North Augusta, SC) and in-house Horiba ABX Micro S60 analyzer (HORIBA Medical, Irvine, CA, USA).
In vitro culture of HSC and progenitor cells
Sorted BM HSC and myeloerythroid progenitor cells were cultured in IMDM supplemented with 10% fetal bovine serum, hEpo (2 units/ml, Amgen), mSCF (100 ng/ml, Peprotech), mIL-3 (10 ng/ml, Peprotech), Dexamethasone (1 μM, Sigma) and IGF-1 (100 ng/ml, Invitrogen). Deletion of RCAD was induced by addition of 4-hydroxytamoxifen (1 μM, Sigma).
Flow cytometry analysis and cell sorting
Freshly isolated BM cells were suspended in PBS with 1% fetal bovine serum and stained with BV510-Sca-1 (Biolegend, San Diego, CA), APC780-c-Kit (eBioscience, San Diego, CA, USA), PE-Cy7-CD150 (Biolegend), Alexa700-CD16/32 (eBioscience), PE-IL-7R (BD Biosciences, San Jose, CA, USA), APC-CD41 (BD Biosciences), BV650-CD105 (Biolegend), FITC-CD71 (BD Biosciences), BV421-TER119 (Biolegend), and PerCP-Cy5.5 conjugated lineage markers including CD4, CD8, CD3, CD5, Gr-1, CD11b, CD19 and B220 (BD Biosciences). The samples were analyzed using BD LSR II SORP and Diva 7.0 software (GRU Cancer Center Flow Cytometry Facility). For competitive repopulation assays, BV421-CD45.2 (Biolegend) was used to substitute BV421-TER119. Cell sorting of HSCs and progenitor cells was performed using BD FACSAria II SORP.
Measurement of ROS and mitochondrial mass
After staining of specific cell surface markers, BM cells were then stained by MitoTracker-Green (50 nM), or by DCF-DA (2′,7′–dichlorofluorescin diacetate, 10 μM) for 30 min at 37 °C and analyzed immediately by flow cytometry.
Cell cycle analysis
Single cells (1–2 × 10⁶) were fixed in 70% methanol at −20 °C overnight, and washed with PBS for three times. Cells were then suspended in 400 μl PBS containing 20 μg/ml propidium iodine (PI) and 200 μg/ml of RNase A, and incubated at 37 oC for 2 h. Cell cycle profile was analyzed using BD LSR II SORP and ModFIT LT v4.0.
Quantitative real-time PCR
Total RNA from each sample was isolated with the GeneJET RNA Purification Kit (Thermo Scientific, Waltham, MA, USA), and then reversely transcribed using the SuperScript First-Strand Synthesis System (Life Technologies, Grand Island, NY, USA) according to the manufacturer's instruction. RT-PCR was performed using the iTaq Universal SYBR Green Supermix kit (BIO-RAD, Hercules, CA, USA) with 40 cycles of 95 oC for 15 s and 60 oC for 1 min on StepOnePlus Real-Time PCR System (Life Technologies). The results were analyzed by StepOne Software (Version 2.1, Life Technologies). Relative expression level of each transcript was normalized to murine beta-actin and GAPDH by using the 2^(-delta delta Ct) method. The following is the list of primers used in this study.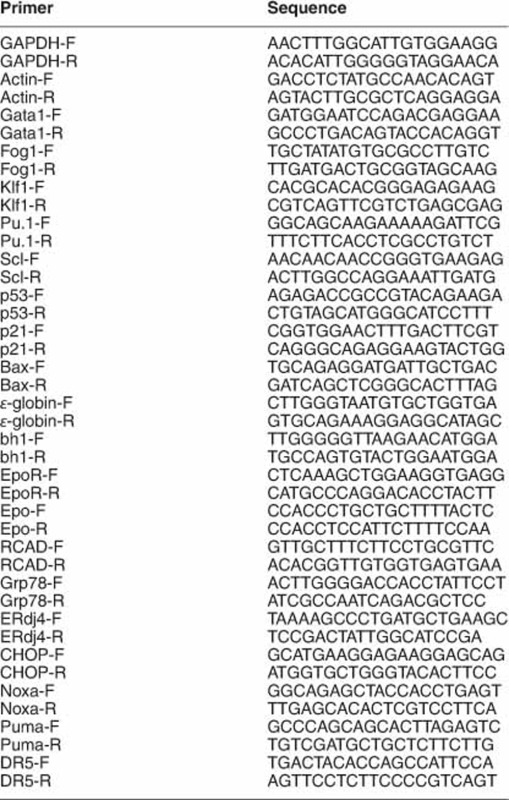
RCAD shRNA construct
A lentiviral vector expressing RCAD shRNA (5′-GCTTCTTTACTCTGTGCTTGA-3′) were constructed using pLKO.1 vector. Lentiviruses were prepared using 293FT packaging cell line according to the manufacturer's instruction (Invitrogen). For RCAD knockdown, cells were infected with lentiviruses expressing either scrambled or RCAD shRNAs. At 24 h post infection, cells were selected with puromycin (1.5 μg/ml) and culture for 3–4 days. RCAD knockdown was confirmed by immunoblotting.
Antibodies, immunoblotting and immunofluorescence staining
Immunofluorescent staining and Immunoblottings were performed as described previously.6 Confocal images were acquired using Zeiss 510 META confocal microscope with Zen software (Carl Zeiss Microscopy GmbH, Jena, Germany), while epifluorescence images were obtained using Zeiss Observer D1 with AxioVision 4.8 software (Carl Zeiss Microscopy GmbH).
The antibodies used in this study include: polyclonal anti-RCAD rat antibody,6 p21 (clone SXM30, BD Biosciences), phosphor-S51-eIF2α, COX IV, p62, LC3B (D11) (Cell Signaling, Danvers, MA, USA), p53 (FL-393), GAPDH (Santa Cruz Biotechnology, Dallas, TX, USA), Grp78, α-tubulin and β-actin (Sigma). All affinity-purified and species-specific HRP- and fluorophore-conjugated secondary antibodies were obtained from Jackson ImmunoResearch (West Grove, PA, USA).
Transmission electron microscopy
Cells were fixed in 2% glutaraldehyde in 0.1 M sodium cacodylate (NaCac) buffer, pH 7.4, postfixed in 2% osmium tetroxide in NaCac, stained en bloc with 2% uranyl acetate, dehydrated with a graded ethanol series and embedded in Epon-Araldite resin. Thin sections were cut with a diamond knife on a Leica EM UC6 ultramicrotome (Leica Microsystems, Inc., Bannockburn, IL, USA), collected on copper grids and stained with uranyl acetate and lead citrate. Cells were observed in a JEM 1230 transmission electron microscope (JEOL USA Inc., Peabody, MA, USA) at 110 kV and imaged with an UltraScan 4000 CCD camera & First Light Digital Camera Controller (Gatan Inc., Pleasanton, CA, USA).
Histology
For Wright-Giemsa staining, peripheral blood cells from WT and KO E11.5 embryos were collected and cytospin slides were prepared, and then stained with Wright-Giemsa stain (Electron Microscopy Sciences, Hatfield, PA, USA). For hematoxylin and eosin staining of embryo sections, the embryos were fixed in 10% formalin overnight, rinsed with PBS and embedded in paraffin. Embryo sections were deparaffinized and hydrated, and subsequently stained with hematoxylin solution for 6 min. After rinse in water for 15 min, the sections were stained with eosin-Y solution for 3 min. The sections were then rinsed in water, dehydrated and mounted with Permout.
Acknowledgments
We thank Dr Tianxiang Hu and William King (GRU) for technical advice on BM cell culture and flow cytometry analysis. The work was supported by NIH (grant R01 GM081776 to HL).
Glossary
- 4-OHT
4-hydroxytamoxifen
- ASC1
activating signal cointegrator 1
- BFU-E
burst-forming units-erythrocyte
- BM
bone marrow
- CBC
complete blood count
- CFU-E
colony-forming units-erythrocyte
- CFU-G
colony-forming units-granulocyte
- CFU-M
colony-forming units-macrophage
- CFU-GM
colony-forming units- granulocyte/macrophage
- CKO
conditional knockout
- CMP
common myeloid progenitor
- CQ
choloroquine
- DCF-DA
2',7' –dichlorofluorescin diacetate
- DDRGK1
DDRGK domain-containing protein 1
- Epo
erythropoietin
- ER
endoplasmic reticulum
- FIP200
FAK-interacting protein 200
- FL
fetal liver
- GMP
granulocyte macrophage progenitor
- HCT
hematocrit
- Hgb
hemoglobin
- HSC
hematopoietic stem cell
- iDISC
intracellular death-induction signaling complex
- KO
knockout
- LZAP
LXXLL/leucine zipper-containing ARF-binding protein
- Maxer
multiple alpha-helix protein located at ER
- MEP
megakaryocyte erythroid progenitor
- MkP
megakaryocyte progenitor
- NLBP
Novel LZAP-binding protein
- RBC
red blood cell
- RCAD
Regulator of C53 and DDRGK1
- ROS
reactive oxygen species
- RT-PCR
reverse transcription polymerase chain reaction
- SCF
stem cell factor
- TAM
tamoxifen
- Ubl
ubiquitin-like
- Uba5
Ufm1 activating enzyme 1
- Ufc1
Ufm1 conjugating enzyme 1
- Ufm1
Ubiquitin-fold modifier 1
- Ufl1
Ufm1-protein ligase 1
- UFBP1
Ufm1-bidning and PCI domain-containing protein 1
- UPR
unfolded protein response
The authors declare no conflict of interest.
Footnotes
Supplementary Information accompanies this paper on Cell Death and Differentiation website (http://www.nature.com/cdd)
Edited by P Salomoni
Supplementary Material
References
- Komatsu M, Chiba T, Tatsumi K, Iemura S, Tanida I, Okazaki N et al. A novel protein-conjugating system for Ufm1, a ubiquitin-fold modifier. EMBO J 2004; 23: 1977–1986. [DOI] [PMC free article] [PubMed] [Google Scholar]
- Tatsumi K, Yamamoto-Mukai H, Shimizu R, Waguri S, Sou YS, Sakamoto A et al. The Ufm1-activating enzyme Uba5 is indispensable for erythroid differentiation in mice. Nat Commun 2011; 2: 181. [DOI] [PMC free article] [PubMed] [Google Scholar]
- Tatsumi K, Sou YS, Tada N, Nakamura E, Iemura S, Natsume T et al. A novel type of E3 ligase for the Ufm1 conjugation system. J Biol Chem 2010; 285: 5417–5427. [DOI] [PMC free article] [PubMed] [Google Scholar]
- Shiwaku H, Yoshimura N, Tamura T, Sone M, Ogishima S, Watase K et al. Suppression of the novel ER protein Maxer by mutant ataxin-1 in Bergman glia contributes to non-cell-autonomous toxicity. EMBO J 2010; 29: 2446–2460. [DOI] [PMC free article] [PubMed] [Google Scholar]
- Kwon J, Cho HJ, Han SH, No JG, Kwon JY, Kim H. A novel LZAP-binding protein, NLBP, inhibits cell invasion. J Biol Chem 2010; 285: 12232–12240. [DOI] [PMC free article] [PubMed] [Google Scholar]
- Wu J, Lei G, Mei M, Tang Y, Li H. A novel C53/LZAP-interacting protein regulates stability of C53/LZAP and DDRGK domain-containing Protein 1 (DDRGK1) and modulates NF-kappaB signaling. J Biol Chem 2010; 285: 15126–15136. [DOI] [PMC free article] [PubMed] [Google Scholar]
- Lemaire K, Moura RF, Granvik M, Igoillo-Esteve M, Hohmeier HE, Hendrickx N et al. Ubiquitin fold modifier 1 (UFM1) and its target UFBP1 protect pancreatic beta cells from ER stress-induced apoptosis. PLoS One 2011; 6: e18517. [DOI] [PMC free article] [PubMed] [Google Scholar]
- Zhang Y, Zhang M, Wu J, Lei G, Li H. Transcriptional regulation of the Ufm1 conjugation system in response to disturbance of the endoplasmic reticulum homeostasis and inhibition of vesicle trafficking. PLoS One 2012; 7: e48587. [DOI] [PMC free article] [PubMed] [Google Scholar]
- Kim CH, Nam HS, Lee EH, Han SH, Cho HJ, Chung HJ et al. Overexpression of a novel regulator of p120 catenin, NLBP, promotes lung adenocarcinoma proliferation. Cell Cycle 2013; 12: 2443–2453. [DOI] [PMC free article] [PubMed] [Google Scholar]
- Ching YP, Qi Z, Wang JH. Cloning of three novel neuronal Cdk5 activator binding proteins. Gene 2000; 242: 285–294. [DOI] [PubMed] [Google Scholar]
- Neziri D, Ilhan A, Maj M, Majdic O, Baumgartner-Parzer S, Cohen G et al. Cloning and molecular characterization of Dashurin encoded by C20orf116, a PCI-domain containing protein. Biochim Biophys Acta 2010; 1800: 430–438. [DOI] [PubMed] [Google Scholar]
- Yoo HM, Kang SH, Kim JY, Lee JE, Seong MW, Lee SW et al. Modification of ASC1 by UFM1 Is crucial for ERalpha transactivation and breast cancer development. Mol Cell 2014; 56: 261–274. [DOI] [PubMed] [Google Scholar]
- Testa G, Schaft J, van der Hoeven F, Glaser S, Anastassiadis K, Zhang Y et al. A reliable lacZ expression reporter cassette for multipurpose, knockout-first alleles. Genesis 2004; 38: 151–158. [DOI] [PubMed] [Google Scholar]
- Pronk CJ, Rossi DJ, Mansson R, Attema JL, Norddahl GL, Chan CK et al. Elucidation of the phenotypic, functional, and molecular topography of a myeloerythroid progenitor cell hierarchy. Cell Stem Cell 2007; 1: 428–442. [DOI] [PubMed] [Google Scholar]
- Michalovitz D, Halevy O, Oren M. Conditional inhibition of transformation and of cell proliferation by a temperature-sensitive mutant of p53. Cell 1990; 62: 671–680. [DOI] [PubMed] [Google Scholar]
- Scheffner M, Werness BA, Huibregtse JM, Levine AJ, Howley PM. The E6 oncoprotein encoded by human papillomavirus types 16 and 18 promotes the degradation of p53. Cell 1990; 63: 1129–1136. [DOI] [PubMed] [Google Scholar]
- Yonish-Rouach E, Resnitzky D, Lotem J, Sachs L, Kimchi A, Oren M. Wild-type p53 induces apoptosis of myeloid leukaemic cells that is inhibited by interleukin-6. Nature 1991; 352: 345–347. [DOI] [PubMed] [Google Scholar]
- Shaw P, Bovey R, Tardy S, Sahli R, Sordat B, Costa J. Induction of apoptosis by wild-type p53 in a human colon tumor-derived cell line. Proc Natl Acad Sci USA 1992; 89: 4495–4499. [DOI] [PMC free article] [PubMed] [Google Scholar]
- Serrano M, Lin AW, McCurrach ME, Beach D, Lowe SW. Oncogenic ras provokes premature cell senescence associated with accumulation of p53 and p16INK4a. Cell 1997; 88: 593–602. [DOI] [PubMed] [Google Scholar]
- Pant V, Quintas-Cardama A, Lozano G. The p53 pathway in hematopoiesis: lessons from mouse models, implications for humans. Blood 2012; 120: 5118–5127. [DOI] [PMC free article] [PubMed] [Google Scholar]
- el-Deiry WS, Tokino T, Velculescu VE, Levy DB, Parsons R, Trent JM et al. WAF1, a potential mediator of p53 tumor suppression. Cell 1993; 75: 817–825. [DOI] [PubMed] [Google Scholar]
- Miyashita T, Reed JC. Tumor suppressor p53 is a direct transcriptional activator of the human bax gene. Cell 1995; 80: 293–299. [DOI] [PubMed] [Google Scholar]
- Komarov PG, Komarova EA, Kondratov RV, Christov-Tselkov K, Coon JS, Chernov MV et al. A chemical inhibitor of p53 that protects mice from the side effects of cancer therapy. Science 1999; 285: 1733–1737. [DOI] [PubMed] [Google Scholar]
- Komarova EA, Neznanov N, Komarov PG, Chernov MV, Wang K, Gudkov AV. p53 inhibitor pifithrin alpha can suppress heat shock and glucocorticoid signaling pathways. J Biol Chem 2003; 278: 15465–15468. [DOI] [PubMed] [Google Scholar]
- Davidson W, Ren Q, Kari G, Kashi O, Dicker AP, Rodeck U. Inhibition of p73 function by Pifithrin-alpha as revealed by studies in zebrafish embryos. Cell Cycle 2008; 7: 1224–1230. [DOI] [PubMed] [Google Scholar]
- Liu F, Lee JY, Wei H, Tanabe O, Engel JD, Morrison SJ et al. FIP200 is required for the cell-autonomous maintenance of fetal hematopoietic stem cells. Blood 2010; 116: 4806–4814. [DOI] [PMC free article] [PubMed] [Google Scholar]
- Mortensen M, Ferguson DJ, Edelmann M, Kessler B, Morten KJ, Komatsu M et al. Loss of autophagy in erythroid cells leads to defective removal of mitochondria and severe anemia in vivo. Proc Natl Acad Sci USA 2010; 107: 832–837. [DOI] [PMC free article] [PubMed] [Google Scholar]
- Tanaka Y, Kurosaki M, Nishida N, Sugiyama M, Matsuura K, Sakamoto N et al. Genome-wide association study identified ITPA/DDRGK1 variants reflecting thrombocytopenia in pegylated interferon and ribavirin therapy for chronic hepatitis C. Hum Mol Genet 2011; 20: 3507–3516. [DOI] [PubMed] [Google Scholar]
- Hetz C. The unfolded protein response: controlling cell fate decisions under ER stress and beyond. Nature reviews. Mol Cell Biol 2012; 13: 89–102. [DOI] [PubMed] [Google Scholar]
- van Galen P, Kreso A, Mbong N, Kent DG, Fitzmaurice T, Chambers JE et al. The unfolded protein response governs integrity of the haematopoietic stem-cell pool during stress. Nature 2014; 510: 268–272. [DOI] [PubMed] [Google Scholar]
- Mortensen M, Soilleux EJ, Djordjevic G, Tripp R, Lutteropp M, Sadighi-Akha E et al. The autophagy protein Atg7 is essential for hematopoietic stem cell maintenance. J Exp Med 2011; 208: 455–467. [DOI] [PMC free article] [PubMed] [Google Scholar]
- Warr MR, Binnewies M, Flach J, Reynaud D, Garg T, Malhotra R et al. FOXO3A directs a protective autophagy program in haematopoietic stem cells. Nature 2013; 494: 323–327. [DOI] [PMC free article] [PubMed] [Google Scholar]
- Pua HH, Dzhagalov I, Chuck M, Mizushima N, He YW. A critical role for the autophagy gene Atg5 in T cell survival and proliferation. J Exp Med 2007; 204: 25–31. [DOI] [PMC free article] [PubMed] [Google Scholar]
- Miller BC, Zhao Z, Stephenson LM, Cadwell K, Pua HH, Lee HK et al. The autophagy gene ATG5 plays an essential role in B lymphocyte development. Autophagy 2008; 4: 309–314. [DOI] [PubMed] [Google Scholar]
- Kundu M, Lindsten T, Yang CY, Wu J, Zhao F, Zhang J et al. Ulk1 plays a critical role in the autophagic clearance of mitochondria and ribosomes during reticulocyte maturation. Blood 2008; 112: 1493–1502. [DOI] [PMC free article] [PubMed] [Google Scholar]
- Kang YA, Sanalkumar R, O'Geen H, Linnemann AK, Chang CJ, Bouhassira EE et al. Autophagy driven by a master regulator of hematopoiesis. Mol Cell Biol 2012; 32: 226–239. [DOI] [PMC free article] [PubMed] [Google Scholar]
- Gan B, Peng X, Nagy T, Alcaraz A, Gu H, Guan JL. Role of FIP200 in cardiac and liver development and its regulation of TNFalpha and TSC-mTOR signaling pathways. J Cell Biol 2006; 175: 121–133. [DOI] [PMC free article] [PubMed] [Google Scholar]
- Komatsu M, Waguri S, Ueno T, Iwata J, Murata S, Tanida I et al. Impairment of starvation-induced and constitutive autophagy in Atg7-deficient mice. J Cell Biol 2005; 169: 425–434. [DOI] [PMC free article] [PubMed] [Google Scholar]
- Young MM, Takahashi Y, Khan O, Park S, Hori T, Yun J et al. Autophagosomal membrane serves as platform for intracellular death-inducing signaling complex (iDISC)-mediated caspase-8 activation and apoptosis. J Biol Chem 2012; 287: 12455–12468. [DOI] [PMC free article] [PubMed] [Google Scholar]
- Hertel P, Daniel J, Stegehake D, Vaupel H, Kailayangiri S, Gruel C, Woltersdorf C, Liebau E. The ubiquitin-fold modifier 1 (Ufm1) cascade of Caenorhabditis elegans. J Biol Chem 2013; 288: 10661–10671. [DOI] [PMC free article] [PubMed] [Google Scholar]
- Wu J, Jiang H, Luo S, Zhang M, Zhang Y, Sun F, Huang S, Li H. Caspase-mediated cleavage of C53/LZAP protein causes abnormal microtubule bundling and rupture of the nuclear envelope. Cell Res 2013; 23: 691–704. [DOI] [PMC free article] [PubMed] [Google Scholar]
- Liu D, Wang WD, Melville DB, Cha YI, Yin Z, Issaeva N, Knapik EW, Yarbrough WG. Tumor suppressor Lzap regulates cell cycle progression, doming, and zebrafish epiboly. Dev Dyn 2011; 240: 1613–1625. [DOI] [PMC free article] [PubMed] [Google Scholar]
- Hayashi-Nishino M, Fujita N, Noda T, Yamaguchi A, Yoshimori T, Yamamoto A. A subdomain of the endoplasmic reticulum forms a cradle for autophagosome formation. Nat Cell Biol 2009; 11: 1433–1437. [DOI] [PubMed] [Google Scholar]
- Ylä-Anttila P, Vihinen H, Jokitalo E, Eskelinen EL. 3D tomography reveals connections between the phagophore and endoplasmic reticulum. Autophagy 2009; 5: 1180–1185. [DOI] [PubMed] [Google Scholar]
Associated Data
This section collects any data citations, data availability statements, or supplementary materials included in this article.