Abstract
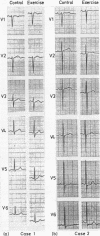
In 129 electrocardiograms from 129 patients showing bifid T waves as well as U waves the intervals from the beginning of the QRS complex to the two T wave apices (QaT1, QaT2), to the end of the T wave (QeT), and to the apex of the U wave (QaU) were measured. Eighty additional electrocardiograms from matched control subjects showing single peaked T waves were also studied. The precordial distribution of bifid T waves was assessed by calculating lead prevalence indices. This index progressively increased from 2.15 in the age range 20-29 years to 3.72 in the age range 60-69 years, and was significantly higher in patients with left ventricular hypertrophy and ischaemia (4.04) than in those with otherwise normal electrocardiograms (2.35). Thus older age and left ventricular pathology were accompanied by a more leftward location of bifid T waves. Exercise accentuated the bifid nature of the T wave in 12 of 18 patients with otherwise normal electrocardiograms, and diminished it in 11 of 19 cases with left ventricular hypertrophy and ischaemia. When 41 otherwise normal tracings showing bifid T waves were compared with those of 42 matched controls showing single peaked T waves, the QTc was longer and the eTaU interval shorter in the group with bifid T waves. Similarly, 40 patients with left ventricular hypertrophy and ischaemia showing bifid T waves had longer QTc and shorter eTaU intervals than 38 patients with the same diagnosis with single peaked T waves. These findings suggest that right precordial bifid T waves in younger patients with otherwise normal electrocardiograms probably result from delayed right ventricular repolarisation, whereas left precordial bifid T waves in older patients with left ventricular hypertrophy and ischaemia may indicate repolarisation delay in the ischaemic left ventricle.
Full text
PDF


Images in this article
Selected References
These references are in PubMed. This may not be the complete list of references from this article.
- Arita M., Mashiba H. Effects of phenothiazine and propranolol on ECG. The effects of propranolol on the electrocardiographic abnormalities induced by phenothiazine derivatives. Jpn Circ J. 1970 May;34(5):391–400. doi: 10.1253/jcj.34.391. [DOI] [PubMed] [Google Scholar]
- Austen W. G., Edwards J. E., Frye R. L., Gensini G. G., Gott V. L., Griffith L. S., McGoon D. C., Murphy M. L., Roe B. B. A reporting system on patients evaluated for coronary artery disease. Report of the Ad Hoc Committee for Grading of Coronary Artery Disease, Council on Cardiovascular Surgery, American Heart Association. Circulation. 1975 Apr;51(4 Suppl):5–40. doi: 10.1161/01.cir.51.4.5. [DOI] [PubMed] [Google Scholar]
- Awa S., Linde L. M., Oshima M., Okuni M., Momma K., Nakamura N. The significance of late-phased dart T wave in the electrocardiogram of children. Am Heart J. 1970 Nov;80(5):619–628. doi: 10.1016/0002-8703(70)90008-6. [DOI] [PubMed] [Google Scholar]
- EISENBERG P., SIMONSON E. Clinical significance of notched T waves. J Lancet. 1960 Apr;80:177–179. [PubMed] [Google Scholar]
- EVANS W. The electrocardiogram of alcoholic cardiomyopathy. Br Heart J. 1959 Oct;21:445–456. doi: 10.1136/hrt.21.4.445. [DOI] [PMC free article] [PubMed] [Google Scholar]
- Friedman P. L., Stewart J. R., Fenoglio J. J., Jr, Wit A. L. Survival of subendocardial Purkinje fibers after extensive myocardial infarction in dogs. Circ Res. 1973 Nov;33(5):597–611. doi: 10.1161/01.res.33.5.597. [DOI] [PubMed] [Google Scholar]
- LEPESCHKIN E., SURAWICZ B. The duration of the Q-U interval and its components in electrocardiograms of normal persons. Am Heart J. 1953 Jul;46(1):9–20. doi: 10.1016/0002-8703(53)90237-3. [DOI] [PubMed] [Google Scholar]
- Millar K., Abildskov J. A. Notched T waves in young persons with central nervous system lesions. Circulation. 1968 Apr;37(4):597–603. doi: 10.1161/01.cir.37.4.597. [DOI] [PubMed] [Google Scholar]
- Priest R. G., Binns J. K., Kitchin A. H. Electrocardiogram in alcoholism and accompanying physical disease. Br Med J. 1966 Jun 11;1(5501):1453–1455. doi: 10.1136/bmj.1.5501.1453. [DOI] [PMC free article] [PubMed] [Google Scholar]
- Suzuki K. [Juvenile angina pectoris erroneously diagnosed as cardioneurosis]. Nihon Rinsho. 1970 Dec;28(12):2863–2877. [PubMed] [Google Scholar]
- Yanowitz F., Preston J. B., Abildskov J. A. Functional distribution of right and left stellate innervation to the ventricles. Production of neurogenic electrocardiographic changes by unilateral alteration of sympathetic tone. Circ Res. 1966 Apr;18(4):416–428. doi: 10.1161/01.res.18.4.416. [DOI] [PubMed] [Google Scholar]


