Abstract
We discuss 3 popular misconceptions about Cronbach α or coefficient α, traditionally used in public health and the behavioral sciences as an index of test score reliability. We also review several other indices of test score reliability. We encourage researchers to thoughtfully consider the nature of their data and the options when choosing an index of reliability, and to clearly communicate this choice and its implications to their audiences.
Cronbach α,1 also known as coefficient α, is one of the most reported statistics of test score reliability in public health, education, and the social and behavioral sciences. A Google Scholar search for the Cronbach article1 yielded more than 25 000 articles, book chapters, and student theses referencing this article. Of 119 publications in the American Journal of Public Health from 2011 to 2013 that reported test score reliability, 105 (88.2%) reported on coefficient α. Of the remaining 14 articles, 12 reported test–retest reliability, 1 reported polychoric α, and 1 reported Kuder–Richardson 20 (which is mathematically identical to coefficient α).
Coefficient α is expressed as
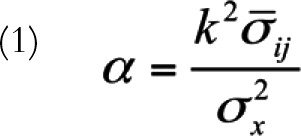 |
where k denotes the number of items, denotes the average item covariance, and
  denotes the variance of observed test scores. Like most statistical tools, coefficient α requires that a number of assumptions are met. These include assumptions underlying classical test theory2 and the following: (1) item responses form a unidimensional scale, (2) error scores from the items are uncorrelated, and (3) the items are essentially τ-equivalent, meaning that the items’ true scores differ by an additive constant.
When these assumptions hold, coefficient α can be interpreted as an indication of the scale’s internal consistency and a lower bound to test score reliability. However, contrary to persistent popular belief, α is not necessarily a measure of unidimensionality. In addition, if its assumptions are violated, coefficient α is not a measure of internal consistency, nor is it an appropriate index of reliability. However, given coefficient α’s pervasiveness in the existing literature, ease of calculation, and availability in popular statistical packages, many researchers include coefficient α in their analyses and fall back on common “rules of thumb” to support claims of test reliability without considering whether α is truly the most appropriate index.
THREE MISCONCEPTIONS ABOUT COEFFICIENT α
Although the misconceptions of coefficient α as an index of test reliability are well known in the psychometric literature,3–7 they still persist. The purpose of this article is to clarify these misconceptions and to encourage researchers to thoughtfully select a method of reliability estimation that is consistent with the purpose of their research and the variance structure of their data.
Index of Test Unidimensionality and Internal Consistency
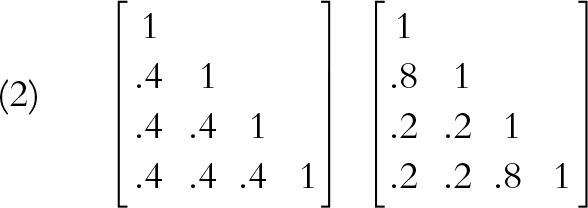
Coefficient α is a function of the average interitem covariance. Pictured are 2 correlation matrices that have an average correlation of 0.40. As a result, the estimate of standardized coefficient α resulting from both matrices equals 0.727. The matrix on the left appears “internally consistent,” as all interitem associations are identical and moderately correlated. The matrix on the right indicates that the first and last 2 items measure separate dimensions that are positively correlated. The second matrix violates the unidimensionality assumption stated earlier. In addition, it is not internally consistent, although the values of α are identical.
 |
Cutoff for Adequately Reliable Test, Regardless of Test Length
Popular rules of thumb suggest that a coefficient α with values exceeding 0.70 indicate adequate internal reliability. Despite the tempting nature of a firm cutoff value, blindly accepting a high value of coefficient α as an indication of internal reliability is not appropriate without considering the nature of the test.
Coefficient α is a function of the number of items, k, as well as the average interitem covariance. As shown in the previously described misconception, it is possible to obtain a “suitable” coefficient α even in circumstances in which the assumption of unidimensionality is not met. In addition, coefficient α can be increased by lengthening a test.
For example, assume a researcher has a 5-item measure with an average interitem correlation of 0.20. The estimate of the standardized coefficient α would equal 0.556, a value that would be deemed unacceptable. However, doubling the length of the test to 10 items and holding the interitem correlations constant at 0.2 would result in an estimate of coefficient α equaling 0.714. The value of 0.714, in and of itself, may not be meaningful because the average item intercorrelations are weak and the variance–covariance structure of the items would need to be examined to assess unidimensionality.
The Best Estimate of Reliability
As researchers in measurement know, coefficient α is not the only measure of reliability.8–15 Selected single-administration lower-bound estimates of reliability for continuous item responses are summarized in Table 1 and these include coefficient α, coefficient β, coefficient θ, coefficient ω, the greatest lower bound, and coefficient H. Each measure listed, like coefficient α, is subject to underlying assumptions, and must only be used after careful consideration. We include an example of when each measure might be an appropriate choice in Table 1, but these are meant as suggestions and should not be blindly adhered to.
TABLE 1—
Summary of Single Administration Indices of Test Score Reliability
| Coefficient α | Coefficient β | Coefficient θ | Coefficient ω | Greatest Lower Bound (glb) | Coefficient Η | |
| Formula | ||||||
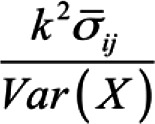 where  is the average covariance between items for all split half possibilities is the average covariance between items for all split half possibilitiesk is the number of scale items Var(X) is the variance of the observed composite scores |
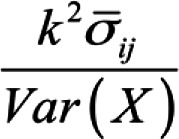 Where  is the average covariance between items for the worst split half is the average covariance between items for the worst split halfk is the number of scale items Var(X) is the variance of the observed composite scores |
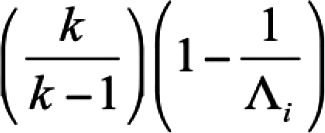 Where  is the largest eigenvalue of a principal components analysis of observed data is the largest eigenvalue of a principal components analysis of observed datak is the number of scale items |
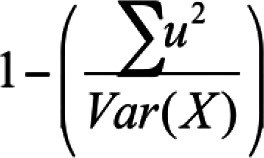 Where  is the sum of item uniquenesses estimated by using factor analysis is the sum of item uniquenesses estimated by using factor analysisVar(X) is the variance of observed test scores |
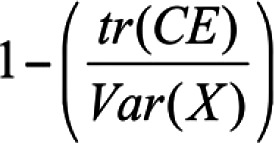 Where  is the sum of the diagonal matrix of the matrix that results from difference between the matrix of observed test scores and the matrix of true test scores6,10 is the sum of the diagonal matrix of the matrix that results from difference between the matrix of observed test scores and the matrix of true test scores6,10Var(X) is the variance of observed test scores |
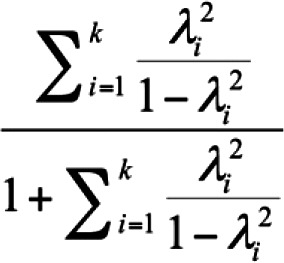 Where  is the squared standardized factor loading of indicator i onto a general factor is the squared standardized factor loading of indicator i onto a general factor |
|
| Assumptions | ||||||
| Items are continuous measurements Item variance is composed of true score variance and random error variance Items form a unidimensional measure Measure is τ-equivalent Error variances are not correlated |
Items are continuous measurements Item variance is composed of true score variance and random error variance Items form a unidimensional measure Measure is τ-equivalent Error variances are not correlated |
Items are continuous measurements Items form a unidimensional measure The assumptions that underlie principal components analysis underlie coefficient θ |
The data represent a linear model where items are continuously distributed Subject to distributional and sample size assumptions of structural equation modeling7 |
Items are continuous measurements Item variance is composed of true score random error variance Measure is τ-equivalent |
Items are continuous measurements Single factor model is properly specified Subject to distributional and sample size assumptions of structural equation modeling |
|
| Appropriate for use when | ||||||
| Desiring to measure internal consistency of items forming a unidimensional scale where errors are demonstrably independent | Seeking the most conservative estimate of lower-bound reliability for a unidimensional scale where errors are demonstrably independent | Estimating the internal reliability of a measure in which errors covary, violating the assumptions of independence common to other single-administration measures of reliability, including a and b | Estimating the reliability of items forming a multidimensional scale with a factor structure that is specified a priori | The glb has been described as the “best” measure of the lower bound of reliability,6 but that claim is the subject of debate.9 Nevertheless, the glb represents an alternative measure of reliability worth researchers’ consideration | Attempting to estimate a maximal reliability based on optimally weighted indicators, particularly when some items load weakly onto their respective factors | |
| Considerations |
||||||
| Can use the Pearson correlation matrix or a covariance matrix to estimate for continuous data Available in many programs such as SPSS and SAS |
Lowest estimate of lower bound reliability of those presented Represents the worst possible split half reliability where between-test covariance is minimized and within-test variance is maximized Determining worst possible split half reliability is computationally difficult but can be estimated by using hierarchical analysis13,14 Can be computed in open-source formats16 |
Requires principal component analysis Accounts for multidimensionality in scale12 Can use the Pearson correlation matrix to estimate for continuous data or a polychoric correlation matrix for ordinal data11 Can be derived from output in any structural equation modeling software |
Requires factor analysis for estimation Represents relationship between a scale’s composite score and its underlying latent trait15 Negatively influenced by negative or weak factor loadings Provides highest lower bound estimate of reliability of the measures presented Might blur the distinction between reliability and validity7 Can be derived from output in any structural equation modeling software |
Positively biased for large samples (> 1000) and scales with > 10 items Not actually greater lower bound estimate; ω tends to be slightly higher estimate9 Can be computed in open-source formats16 |
Represents an estimate of “maximal reliability” rather than lower bound reliability14 Allows for optimally weighted items in determining composite15 Is not negatively affected by negative or weak indicators15 Can be derived from output in any structural equation modeling software |
|
Some measures, such as α and coefficient β, are estimated by using the observed item covariance matrix. Coefficient θ relies on performing a principal components analysis of a variance–covariance matrix. Other indices rely on more recent statistical methods. For example, the greatest lower bound can be computed in an open-source format.16 McDonald’s coefficient ω8 and coefficient H can also be estimated by using confirmatory factor analysis, forcing the researcher to specify an underlying model (i.e., the item responses form a unidimensional scale). In addition, when one is testing a single common factor model, McDonald’s coefficient ω will provide a higher estimate of reliability than will coefficient α.
Confirmatory factor analysis requires the assumption that the correct model is being assessed. Although this assumption is invariably false,17 fit indices can show that theoretically founded models can approximate the observed variance structure and sound judgment should be used in assessing model fit (see the 2007 special issue of Personality and Individual Differences for this discussion18). In addition, although data nonnormality is rarely addressed when one is reporting reliability (e.g., skewness and kurtosis of item responses and the use of noncontinuous Likert response data), research11 has shown that ordinal estimates provide better lower-bound estimates of reliability than coefficient α when data are nonnormal. A structural equation modeling framework with robust maximum likelihood estimation can also address item nonnormality, allowing for the reporting of coefficient ω.8
Beyond single administration estimates, test–retest measures of reliability are not subject to the previously mentioned misconceptions that are associated with coefficient α. Nonetheless, test–retest measures of reliability involve other considerations: the length of time between test administrations, the effort involved in multiple rounds of data collection, and the assumption that true scores do not change over time.8
CONCLUSIONS AND RECOMMENDATIONS
In light of the statistical advances from the past 60 years, it is no longer sufficient to obtain an estimate of coefficient α exceeding a heuristic value. Researchers must examine their variance–covariance matrix for substantial differences among item covariances and consider distributional characteristics of the items.
If researchers continue in their use of coefficient α, they must establish that the test items form a unidimensional scale with no correlated errors,3 which can be done if one performs a confirmatory factor analysis and carefully examines modification indices.19 In addition, researchers must be mindful of context, as acceptable values of reliability depend on the purpose for which the test is being used (e.g., diagnosis, classification, theory building) and the research question to be answered. For example, when one is determining whether a measure can be meaningfully used across language versions, factor analytic techniques can assess various forms of measurement invariance.20 In this case, researchers should not rely solely on test score reliability to assess whether a measure should be used across groups. Moreover, Streiner21 has argued that extremely high estimates of coefficient α may result from the inclusion of similarly worded items in the scale. In this case, researchers should keep in mind that redundant item wording among items could inflate their estimate of coefficient α.
To conclude, researchers and journal reviewers should be cognizant of the misconceptions of coefficient α. Coefficient α is not an index of unidimensionality, nor is it an index of internal consistency when the assumption of unidimensionality is not met. Coefficient α is a measure of average interitem association that increases as the number of items on a test increase. Researchers should examine their data, consider the context and purpose for which the test is being used, and be mindful that other measures of test score reliability (test–retest reliability and measures in Table 1) are available.
ACKNOWLEDGMENTS
The authors would like to thank the 3 anonymous reviewers, as their suggestions strengthened this article. The authors would also like to thank the late Roger Millsap, PhD, and Michael Zárate, PhD, for independent discussions before article submission concerning test score reliability. The authors would like to dedicate this article to the memory of Leila Rodiz Morera, PhD, and Floyd F. Carpenter, who encouraged our professional pursuits.
REFERENCES
- 1.Cronbach LJ. Coefficient alpha and the internal structure of tests. Psychometrika. 1951;16:297–334. [Google Scholar]
- 2.Allen MJ, Yen WM. Introduction to Measurement Theory. Belmont, CA: Wadsworth; 1979. [Google Scholar]
- 3.Cortina JM. What is coefficient alpha? An examination of theory and applications. J Appl Psychol. 1993;78:98–104. [Google Scholar]
- 4.Green SB, Lissitz RW, Mulaik SA. Limitations of coefficient alpha as an index of test unidimensionality. Educ Psychol Meas. 1977;37:827–838. [Google Scholar]
- 5.Schmitt N. Uses and abuses of coefficient alpha. Psychol Assess. 1996;8:350–353. [Google Scholar]
- 6.Sijtsma K. On the use, the misuse, and the very limited usefulness of Cronbach’s alpha. Psychometrika. 2009;74:107–120. doi: 10.1007/s11336-008-9101-0. [DOI] [PMC free article] [PubMed] [Google Scholar]
- 7.Green SB, Yang Y. Commentary on coefficient alpha: a cautionary tale. Psychometrika. 2009;74:107–120. [Google Scholar]
- 8.McDonald RP. Test Theory: A Unified Treatment. Mahwah, NJ: Erlbaum; 1999. [Google Scholar]
- 9.Revelle W, Zinbarg RE. Coefficients alpha, beta, omega and the glb: comments on Sijtsma. Psychometrika. 2009;19:145–154. [Google Scholar]
- 10.Jackson PH, Agunwamba CC. Lower bounds for the reliability of the total test score on a test composed of non-homogeneous items: I: Algebraic lower bounds. Psychometrika. 1977;42:567–578. [Google Scholar]
- 11.Zumbo BD, Gadermann AM, Zeisser C. Ordinal versions of coefficients alpha and theta for Likert rating scales. J Mod Appl Stat Methods. 2007;6:21–29. [Google Scholar]
- 12.Armor DJ. Theta reliability and factor scaling. In: Costner H, editor. Sociological Methodology. San Francisco, CA: Jossey-Bass; 1974. pp. 17–50. [Google Scholar]
- 13.Revelle W. Hierarchical cluster analysis and the internal structure of tests. Multivariate Behav Res. 1979;14:57–74. doi: 10.1207/s15327906mbr1401_4. [DOI] [PubMed] [Google Scholar]
- 14.Raykov T. Estimation of maximal reliability: a note on a covariance structure modelling approach. Br J Math Stat Psychol. 2004;57(pt 1):21–27. doi: 10.1348/000711004849295. [DOI] [PubMed] [Google Scholar]
- 15.Geldhof GJ, Preacher KJ, Zyphur MJ. Reliability estimation in a multilevel confirmatory factor analysis framework. Psychol Methods. 2014;19(1):72–91. doi: 10.1037/a0032138. [DOI] [PubMed] [Google Scholar]
- 16. Revelle W. psych: procedures for personality and psychological research. R package version 1.0-51. 2008.
- 17.MacCallum RC. Working with imperfect models. Multivariate Behav Res. 2003;38:113–139. doi: 10.1207/S15327906MBR3801_5. [DOI] [PubMed] [Google Scholar]
- 18.Vernon T, Eysenck S. Introduction. Pers Ind Diff. 2007;42:813. [Google Scholar]
- 19.MacCallum RC, Roznowski M, Necowitz LB. Model modification in covariance structure analysis: the problem of capitalization on chance. Psychol Bull. 1992;111:490–504. doi: 10.1037/0033-2909.111.3.490. [DOI] [PubMed] [Google Scholar]
- 20.Millsap RE. Statistical Approaches to Measurement Invariance. New York, NY: Routledge/Taylor and Francis Group; 2011. [Google Scholar]
- 21.Streiner DL. Starting at the beginning: an introduction to coefficient alpha and internal consistency. J Pers Assess. 2003;80(1):99–103. doi: 10.1207/S15327752JPA8001_18. [DOI] [PubMed] [Google Scholar]


