Abstract
Objectives:
The objective of this study was to investigate comparatively the influence of proton-pump inhibitors (PPI) administration on three bacterial communities in the oral cavity, stomach, and colon along the alimentary tract.
Methods:
Forty-five subjects including 18 patients taking PPI were enrolled. Stimulated saliva, gastric fluid (GF), and feces were obtained from each subject for the microbiota analysis through bacterial 16S rRNA gene profiling using the pyrosequencing method.
Results:
The species richness (alpha diversity) was similar among these three microbiota, whereas the interindividual diversity (beta diversity) was much higher in the fecal microbiota compared with that in the others. The UniFrac analysis indicated that the salivary and GF microbiota were similar to one another; however, both differed greatly from the fecal microbiota in the overall bacterial community structure. In the comparison between PPI-users and PPI-nonusers, a bacterial cell number increase of ~1,000 times was found in the GF of PPI-users using culturing methods, whereas the bacterial number and composition were nearly identical between the two groups using quantitative PCR and a similarity search based on 16S profiling. The beta diversity significantly increased in both the salivary and GF microbiota of PPI-users compared with PPI-nonusers.
Conclusions:
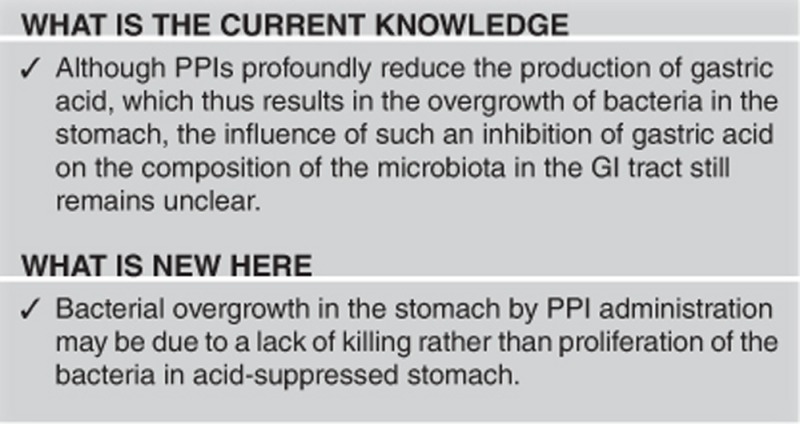
These results suggest that the GF microbiota has recently moved from the saliva. Bacterial overgrowth in the GF by PPI administration may be due to a lack of killing rather than proliferation of the bacteria in the acid-suppressed stomach. The biological significance of the increase in beta diversity by PPI administration remains unclear.
INTRODUCTION
The stomach is a hostile environment for many microorganisms because highly acidic gastric acid kills many ingested microbes. Indeed, bacterial counts in the gastric mucosa and gastric fluid (GF) were reported only 102 to 104 colony-forming units (CFU) per g or ml, when examined using traditional culturing methods.1, 2 It is also evident that a major role of gastric acid is the inactivation or killing of the external pathogenic bacteria.3 According to these observations, a reduction in the gastric acid secretion in the stomach is thought to significantly influence the microbial community not only in the stomach but also in the downstream colon.
The use of acid-suppressive agents, including proton-pump inhibitors (PPI), is now the first-choice treatment for acid-related gastroduodenal disorders. Although PPI profoundly reduces the production of gastric acid, which thus results in the overgrowth of bacteria in the stomach,4 the influence of such an inhibition of acid secretion on the composition of the microbiota in the gastrointestinal (GI) tract still remains to be elucidated.
The colon is thought to harbor the largest and most complex microbial community in the human body. The number of genes encoded by the intestinal microbiota is estimated to be ~400 times higher compared with that in the human body.5 It is also conceivable that the intestinal microbiota is affected by the stomach microbiota through its continuous inflow of an enlarged population into the colon, especially following bacterial overgrowth in the stomach caused by PPI administration.
The mouth is located at the entrance of the GI tract and formed by complex anatomical sites such as the teeth, gingiva, and tongue, and each of these anatomical sites was reported to have a distinctive microbial community.6 These oral microbiota constantly flow downstream into the stomach by swallowing of the saliva and mastication of food, which are thus thought to exert a great influence on the microbial communities in the stomach and colon. These events supported the notion that the GI tract as a whole has a changing microbial ecosystem where the microbial communities located downstream are continually affected by the upstream microbiota.
In the present study, we first evaluated three bacterial communities prepared from the saliva, GF, and feces, and compared these luminal microbiota within and among subjects using their bacterial 16S rRNA (16S) gene profiling generated using the high-throughput pyrosequencing. We then examined the influence of gastric acid suppression and resultant gastric bacterial overgrowth on the GI tract microbiota by comparing the microbiota of PPI-users with those of PPI-nonusers.
METHODS
Subjects
Forty-five subjects in total were enrolled in the present study from April 2013 to March 2014 (Table 1). The outpatients who had taken PPI everyday were recruited in Tokai University Hospital and designated as PPI-users. The exclusion criteria were age below 20 years, suffering from organic GI lesions such as ulcers and cancers, the use of antimicrobials within the previous 3 months, and a history of GI or hepatobiliary surgery. As a result, a total of 18 subjects, consisting of 12 functional dyspepsia and six gastroesophageal reflux disease patients, were enrolled; all of these patients had been taking a PPI for more than 2 years at that time. Ten subjects were treated with lansoprazole (15 or 30 mg per day) and eight subjects with rabeprazole sodium (10 or 20 mg per day). For the PPI-nonusers, a total of 27 healthy volunteers who had never taken a PPI were also enrolled. The exclusion criteria were the same as those for PPI-users. The ethics committees of Tokai University Hospital (12R-260; 15 February 2013), Azabu University (6 February 2013), and The University of Tokyo (7 February 2013) approved the study, and a written informed consent was obtained from all the subjects.
Table 1. Demographic and clinical data of the subjects and the influence of PPI on their samples.
| Whole | Subjects treated with PPI | Difference between + and − P value | ||
|---|---|---|---|---|
| + | − | |||
| Number of subjects | 45 | 18 | 27 | |
| Age (years) | 48.4±17.3a | 64.4±12.2 | 37.8±10.7 | <0.001 |
| M/F | 32/13 | 12/6 | 20/7 | NS |
| Daily intake of fermented foods (+/−) | 32/13 | 14/4 | 18/9 | NS |
| Saliva | ||||
| Volume collected (ml) | 5.0b (3.5–7.4)c | 5.0 (4.5–8.4) | 5.0 (4.3–6.0) | NS |
| pH | 7.75 (7.45–8.03) | 7.90 (7.52–8.65) | 7.69 (7.52–7.79) | 0.037 |
| Gastric fluid | ||||
| Volume collected (ml) | 14.0 (7.5–21.0) | 11.0 (9.1–14.8) | 17.8 (13.3–21.5) | NS |
| pH | 1.90 (1.38–5.53) | 3.24 (2.87–5.59) | 1.58 (1.66–3.39) | 0.018 |
| Bacterial count by culturing method (log10 CFU/ml) | 5.5±2.7 | 7.2±1.8 | 4.4±2.5 | <0.001 |
| Serum | ||||
| Gastrin (pg/ml) | 87 (75.5–215.0) | 290 (199–426) | 77 (73–98) | <0.001 |
| Anti-H. pylori Ab (+/−) | 6/45 | 3/15 | 3/24 | NS |
Ab, antibody; CFU, colony-forming unit; NS, not significant; PPI, proton-pump inhibitor.
Mean±s.d.
Median.
Interquartile range.
Sample collection and DNA extraction
After overnight fasting, salivary, GF, and fecal samples were collected from the subjects in the morning. For the stimulated saliva samples, the subjects chewed a small piece of sterile gum for 3 min and then spit out the accumulated saliva into a test tube with a filter screw cap. For the GF samples, a nasogastric tube was inserted into the stomach through the nostril, and then the GF was aspirated using a disposable syringe connected to the tube and then transferred into a test tube. For the fecal samples, the subjects were instructed to take a fresh stool in a test tube on the day of sample collection. Those samples were immediately sealed in an AnaeroPack-Anaero (Mitsubishi Gas Chemical, Tokyo, Japan), a plastic bag containing a disposable oxygen-absorbing and carbon dioxide-generating agent, and then transported to the laboratory within several hours on ice. At the laboratory, the saliva and GF samples were immediately frozen using liquid nitrogen and stored at −80 °C until the assay. The fecal samples were suspended in 20% glycerol and phospahte-buffered saline before being frozen. The extraction of bacterial DNA from the samples was performed as described previously.7, 8
Laboratory examinations
To count the number of anaerobic bacteria using culturing methods, 0.5 ml of fresh GF was spread over BL agar plates containing 5% horse serum and then incubated at 37 °C for 72 h in 10% H2, 10% CO2, and 80% N2. To enumerate aerobic bacteria, 0.5 ml of GF was spread over TS agar plates containing 5% horse serum and then incubated at 37 °C for 48 h in a 5% CO atmosphere. The sum of the CFUs on both agar plates was used as the bacterial count. The levels of serum gastrin and anti-Helicobacter pylori antibody were assayed as described previously.9 The pH value of GF was measured using a pH meter (M-7; Horiba, Tokyo, Japan).
PCR amplification of the 16S rRNA gene and barcoded 454 pyrosequencing
The hypervariable V1–V2 region of the 16S gene was amplified by PCR with barcoded 27Fmod (5′-AGRGTTTGATYMTGGCTCAG-3′) and reverse primer 338R (5′-TGCTGCCTCCCGTAGGAGT-3′).10 PCR was performed in 50 μl of 1 × Ex Taq PCR buffer composed of 10 mM Tris-HCl (pH 8.3), 50 mM KCl, and 1.5 mM MgCl2 in the presence of 250 μM dNTP, 1 U Ex Taq polymerase (Takara Bio, Kyoto, Japan), forward and reverse primers (0.2 μM) and ~20 ng template DNA. Thermal cycling consisted of initial denaturation at 96 °C for 2 min, followed by 25 cycles of denaturation at 96 °C for 30 s, annealing at 55 °C for 45 s, and extension at 72 °C for 1 min, and then a final extension at 72 °C on a 9700 PCR system (Life Technologies Japan, Tokyo, Japan). PCR amplicons were purified by AMPure XP magnetic purification beads (Beckman Coulter, Brea, CA, USA) and quantified using the Quant-iT PicoGreen dsDNA Assay Kit (Life Technologies Japan). Equal amount of PCR amplicons were pooled and then sequenced using the 454 GS FLX Titanium or 454 GS Junior system (Roche Applied Science, Indianapolis, IN).
Real-time quantitative PCR
The universal bacterial 16S rRNA primers, B8F20 (5′-AGAGTTTGATCCTGGCTCAG-3′) and B806R20 (5′-GGACTACCAGGGTATCTAAT-3′), were used to count the number of all the bacteria by real-time quantitative PCR (qPCR) according to previously described methods.10
OTU clustering and UniFrac analysis
We used an analysis pipeline for the 454 pyrosequencing data of the 16S rRNA gene V1–V2 region as reported previously.11 From the quality filter-passed reads, high-quality 3,000 reads per sample were randomly chosen. After trimming off both primer sequences, the reads were then sorted and grouped into operational taxonomic units (OTUs) using the UCLUST algorithm (http://www.drive5.com/) with a sequence identity threshold of 96%. Taxonomic assignments of each OTU were made by similarity searching against the publically available 16S (RDP ver. 10.27 and CORE update 2 September 2012) and the NCBI genome database using the GLSEARCH program. In both unweighted and weighted UniFrac distance analyses, phylogenic tree-based metrics was used to measure differences in the overall bacterial diversity and composition of the samples.12 The estimation of the OTU numbers by extrapolation using Chao 1 was calculated with the vegan package (v2.0-5) for the R software program(v2.15.2). All the filter-passed reads of the 16S V1–V2 sequences analyzed in the present study were deposited in the DDBJ/GenBank/EMBL database with accession numbers DRA 002611, 002617, and 002618.
Statistical analysis
All statistical analyses were conducted with the R software program (v2.15.2). The microbial richness, evenness, and diversity were assessed using the R vegan package. Depending on the normality of the data examined by the Shapiro–Wilk test, the Student's t-test or Mann–Whitney's U-test was used to perform statistical analyses. P values were corrected for multiple testing using the Benjamin–Hochberg method as appropriate.
RESULTS
Comparison of the microbial community among the salivary, GF, and fecal samples
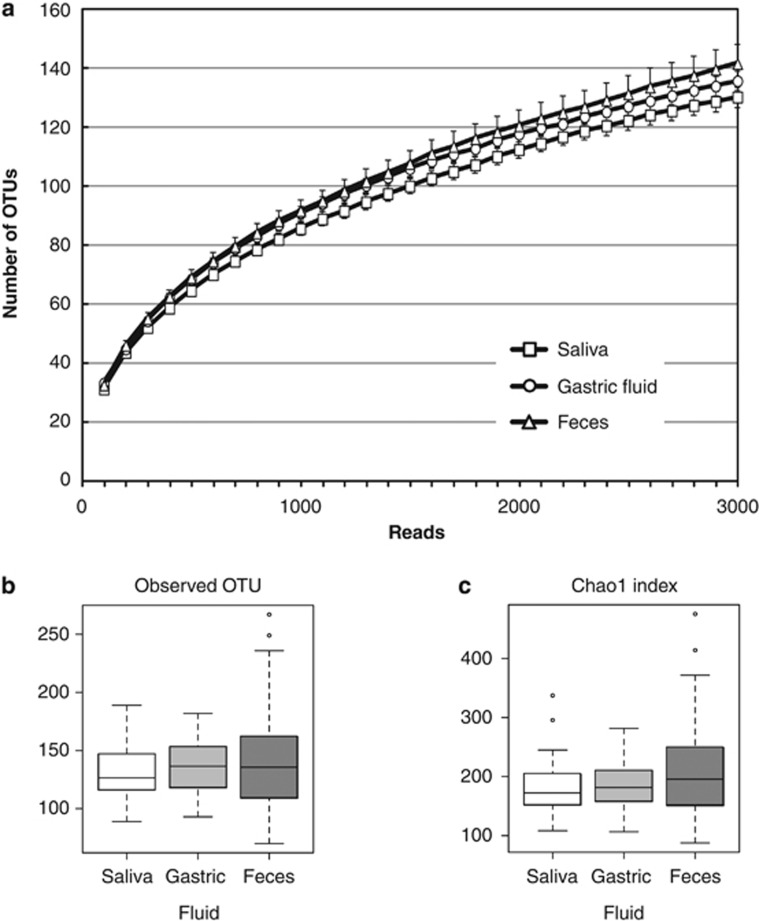
We obtained sample-assigned pyrosequencing reads having both forward and reverse primer sequences, which accounted for 69.8% of the total number of reads from the salivary, GF, and fecal samples of the 45 subjects. After removing low-quality and possibly chimera reads, 1,237,315 high-quality 16S reads were ultimately generated from 135 microbiota samples. Of them, 3,000 reads were randomly selected for each sample and used for the further analyses. The rarefaction curves, which plots the OTU number as a function of the read number, showed that the contours of the three microbiota almost overlapped, suggesting no difference in the degree of bacterial species richness among them (Figure 1a). The species richness (alpha diversity) of the samples was also evaluated using the observed OTU number and the estimated OTU numbers by the Chao 1 index (Figure 1b). These analyses demonstrated no significant differences in the species richness among the salivary, GF, or fecal samples. On the other hand, the log CFU bacterial count (mean±s.d., median) quantified by qPCR was 8.70±0.25, 8.69/ml; 7.75±0.57, 7.79/ml; and 10.56±0.26, 10.46/mg in the saliva, GF, and feces, respectively, when examined in 10 randomly selected subjects (Supplementary Figure S1 online). These results suggested that the luminal microbiota in the oral cavity, stomach, and colon consisted of a similar number of species, although the bacterial cell number varied by ~1,000 times with the following order, GF<saliva<feces.
Figure 1.
Analysis of the operational taxonomic unit (OTU) number. (a) The rarefaction curve plots the number of OTU as a function of the number of reads. Squares, circles and triangles represent the curves for salivary, gastric fluid (GF), and fecal micobiota, respectively. (b and c) The OTU number representing the bacterial species richness of the microbiota was estimated using the (b) observed OTU and the (c) Chao 1 index.
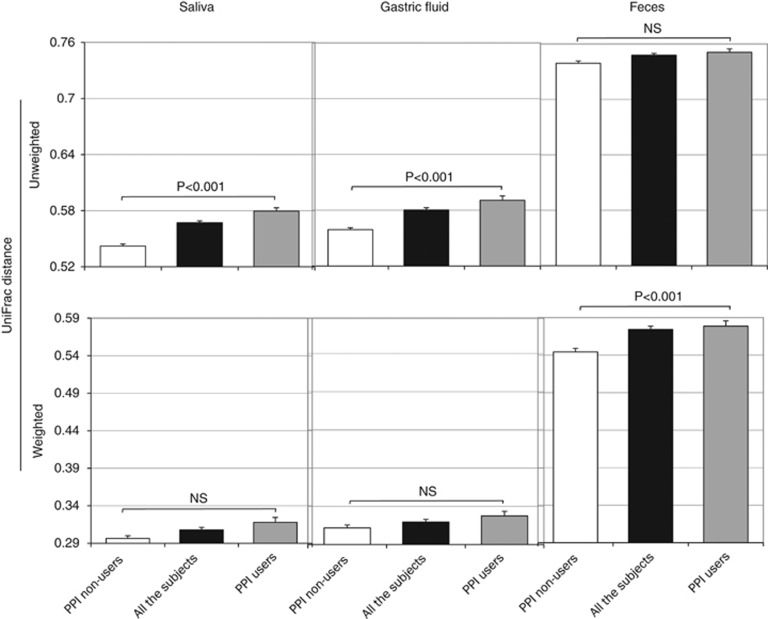
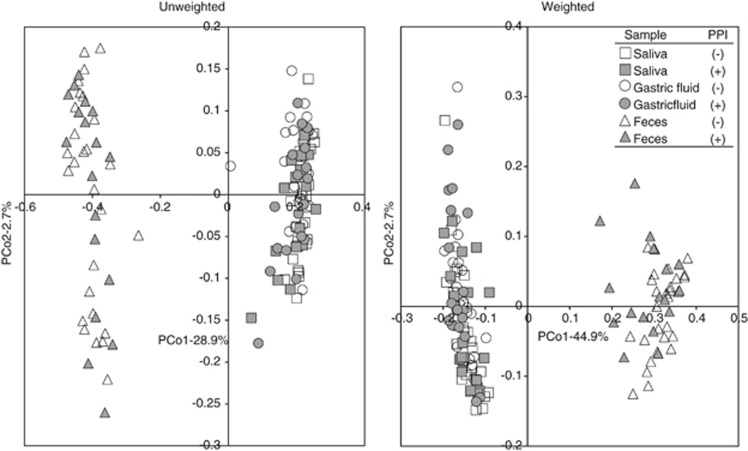
The overall bacterial community structure was compared using the UniFrac analysis. The average of UniFrac distance was much longer in the microbiota of the feces compared with that of the saliva or GF microbiota irrespective of PPI usage (Figure 2). A cluster analysis according to the UniFrac distance showed that there were two distinct clusters, one composed of both salivary and GF samples and another composed of fecal samples alone (Figure 3). In addition, the closest relationship was found in many of the pairs between the salivary and GF samples of the same individuals. These findings were also confirmed by both the unweighted and weighted UniFrac principal coordinate analyses, in which both the salivary and GF samples aggregated to form a cluster separate from the cluster of fecal samples (Figure 4).
Figure 2.
Difference in the UniFrac distance between proton-pump inhibitor (PPI)-users and PPI-nonusers. Salivary, gastric fluid (GF), and fecal samples were obtained from (open bars) PPI-nonusers and (filled bars) PPI-users. Bars represent the average of (upper panels) unweighted and (lower panels) weighted UniFrac distances. “All the subjects” includes both PPI-nonusers and PPI-users. NS: P>0.05.
Figure 3.
Hierarchical clustering analysis of the individual bacterial community. A weighted UniFrac distance-based hierarchical clustering analysis was performed for the bacterial community of individuals, and the result was shown using a cluster dendrogram. The sample ID of each subject is shown at the bottom. The shaded box indicates the salivary and gastric fluid (GF) sample pairs in one individual. An arrow indicates the boundary of the two distinct clusters. The prefix “P-” represents proton-pump inhibitor (PPI)-users. The suffixes “S”, “G”, and “F” represent saliva, GF, and feces, respectively.
Figure 4.
The UniFrac analysis of the three bacterial communities. The overall bacterial community structure was demonstrated by an unweighted and weighted UniFrac principal coordinate analysis (PCoA). Square, circle, and triangle symbols indicate the salivary, gastric fluid (GF), and fecal samples, respectively. Open and filled symbols represent proton-pump inhibitor (PPI)-nonusers and PPI-users, respectively.
Differences in the microbiota composition among the saliva, GF, and feces
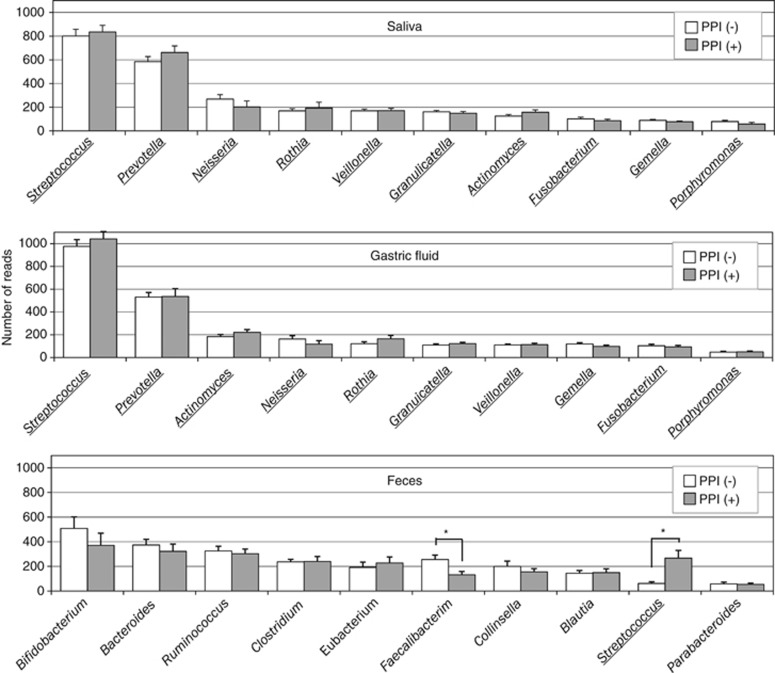
The OTUs generated from the 16S reads were classified into phyla according to a similarity search (Supplementary Figure S2). In the salivary/GF microbiota, the majority represented Firmicutes, Bacteroidetes, Actinobacteria, Proteobacteria, and Fusobacterium phyla and their average relative abundances were 46/53, 25/21, 12/13, 11/8, and 5/5%, respectively. In the fecal microbiota, the average of the five phyla was Firmicutes (61%), Actinobacteria (20%), Bacteroidetes (16%), Proteobacteria (1%), and Fusobacteria (0.5%), showing much lower abundance of Proteobacteria and Fusobacteria phyla in the fecal microbiota. The analysis at the genus level also showed a high similarity between the salivary and GF microbiota, but they exhibited a large difference from the fecal microbiota (Figure 5).
Figure 5.
Bacterial composition at the genus level. The average of read numbers of the top 10 major genera are shown in the salivary, gastric fluid (GF), and fecal samples. Open and filled bars represent proton-pump inhibitor (PPI)-nonusers and PPI-users, respectively. Underlining represents the common genus among the microbiota. Asterisks show a significant difference according to Student's t-test.
The OTUs assigned to H. pylori in the GF samples were detected in the six subjects who were also serologically positive for H. pylori infection but were not in any of the serologically H. pylori-negative subjects (Supplementary Figure S3). The average ratio of H. pylori reads were 1.9% (ranging from 0.4 to 12.5%) in these subjects.
Demographic and clinical data in PPI-users and PPI-nonusers
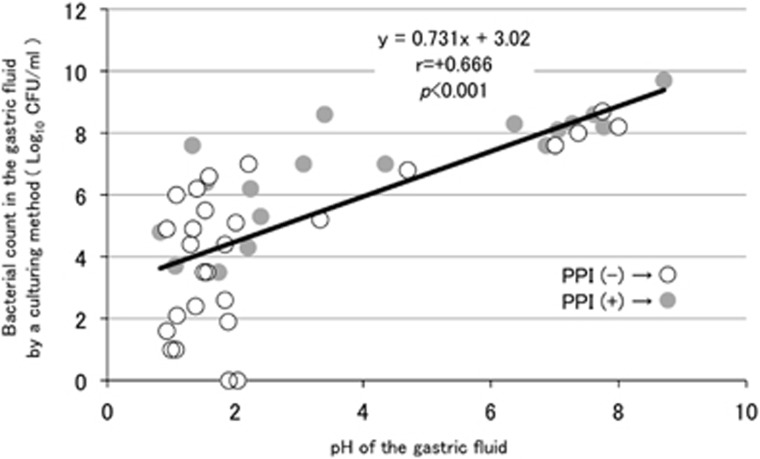
Table 1 summarizes the demographic and clinical data of the 45 subjects in total, which included 18 PPI-users and 27 PPI-nonusers. In the comparison between those two groups, the mean age of the subjects was significantly higher in PPI-users compared with that in PPI-nonusers. The pH value of the saliva was moderately higher in the former compared with that in the latter. In the GF, the pH value was significantly higher in PPI-users than in PPI-nonusers, which indicated that gastric acid secretion was significantly inhibited in PPI-users. The log bacterial count obtained using culturing methods was also significantly higher in PPI-users compared with that in PPI-nonusers. A significant correlation was observed between the pH value and the cultured bacterial count in all the GF samples (Figure 6), thus indicating that the increase in the bacterial count in PPI-users could be due to low gastric acidity. On the other hand, the average log copy number of the bacterial cells in the GF (/ml) measured by qPCR was nearly the same between PPI-users (8.0±0.8) and PPI-nonusers (8.1±0.8), although qPCR cannot distinguish between live and dead bacteria (Supplementary Figure S1). Therefore, the discrepancy in the estimated bacterial quantity in the GF microbiota of PPI-nonusers using culturing and qPCR methods (mean, 4.4 vs. 8.1, respectively) may be explained by the inability of culturing method to detect dead or metabolically inactive bacteria in highly acidic GF.
Figure 6.
The relation between the pH value and the bacterial count using a culturing method in gastric fluid (GF). The pH value (horizontal axis) and the bacterial count (vertical axis) according to a culturing method in the GF of each subject were plotted by a circle to evaluate Spearman's correlation coefficient. Open and filled circles represent proton-pump inhibitor (PPI)-nonusers and PPI-users, respectively.
Influence of PPI on the bacterial communities along the GI tract
The species richness of the microbiota analyzed by the OTU number showed no significant difference between PPI-users and PPI-nonusers in any of the salivary, GF, or fecal samples according to Welch's t-test (Supplementary Figure S4). The UniFrac distance (Figure 2) was slightly but significantly longer in PPI-users comapred with that in PPI-nonusers in saliva (unweighted), GF (unweighted), and feces (weighted). Because the average age differed between the two groups (Table 1), we then constructed age-matched groups by selecting the youngest seven subjects from PPI-users (TS-02, -15, -16, -22, -25, -37, and -48: mean age 52.7 years) and the oldest seven subjects from PPI-nonusers (TS-07, -11, -21, -29, -33, -34, and -41; mean age 50.3 years), in which there was no longer a significant difference in the average age between the two groups. As a result, the UniFrac distance was also significantly longer in PPI-users than in PPI-nonusers in both the salivary and GF microbiota (Supplementary Figure S5). As for the overall bacterial community structure, the principal coordinate analyses analysis showed that both samples from PPI-users (filled symbols) and PPI-nonusers (open symbols) aggregated to form a cluster in all three microbiota, indicating that there was not much difference in the bacterial community between PPI-users and PPI-nonusers (Figure 4).
Influence of PPI on the bacterial composition along the GI tract
There was no significant difference in the bacterial composition at the phylum level in the saliva, GF, or feces between PPI-users and PPI-nonusers (Supplementary Figure S2). At the genus level in the feces, the abundance of Faecalibacterium, which was the sixth major genus present, was found to be significantly lower in PPI-users compared with that in PPI-nonusers (no. of reads: 132±26 vs. 255±37; P=0.009) (Figure 5). Although the abundance of Faecalibacterium was also lower in PPI-users (88±82) compared with that in PPI-nonusers (186±165) in the comparison between the age-matched groups, the difference was not significant (P=0.18). Furthermore, no significant difference of this genus was observed by a linear regression analysis adjusted for age (P=0.13). An increase in the abundance of Streptococcus in PPI-users (Figure 5) was not observed in the comparison using age-matched groups.
DISCUSSION
The OTU number analysis based on the enumerated 16S data showed that the spatially distinct luminal microbiota from the oral cavity, stomach, and colon along the GI tract were composed of very similar number of species in each individual. This result was unexpected for us because it has been supposed that the colon microbiota is the highest in the number of species among all the microbiota in the individual. On the other hand, the bacterial count estimated by the qPCR method varied from 10 to 1,000 times among these microbiota. These findings suggested that the overall species richness is highly similar among the three microbiota irrespective of their different habitats, whereas the total bacterial count was sensitive to different environmental factors including pH, oxygen concentration, and nutrient availability. Among the three microbiota, the gastric microbiota was composed of lowest number of bacteria according to the culturing method, suggesting that the highly acidic gastric juice exerts considerable suppression on the bacterial growth.
The UniFrac metrics and taxonomic assignment demonstrated a high similarity in the bacterial composition between the salivary and GF microbiota. Moreover, the cluster analysis exhibited the closest relation between the salivary and GF microbiota in the same individual. These findings suggested that the majority of GF microbiota may originate from microbes in the stimulated saliva, possibly through the continuous inflow of the saliva and masticated foods. Considering that most of the major species were shared between these two microbiota at both the phylum and genus levels, the highly acidic gastric juice may evenly reduce the bacterial viability without the killing of particular species in the stomach. Although the role of gastric bacteria other than H. pylori in the pathophysiology of the stomach still remains unclear,13 an intervention such as the probiotic treatment of pathogenic oral microbiota may be a prerequisite for the intervention of the gastric microbiota.
In contrast to the high similarity of the bacterial species richness (alpha diversity) among the three microbiota, the bacterial composition of the fecal microbiota was revealed to be completely different from those of the salivary and GF microbiota. In addition, the interindividual variability (beta diversity) of the fecal microbiota was much higher compared with that of the salivary and GF microbiota. These results thus indicated that the colon habitat is completely different from the other two habitats regarding biological and ecological features. In a large scale study of the human microbiome using the samples from different racial groups,14 the saliva had one of the highest alpha diversities but one of the lowest beta diversities. The stool had the highest alpha and beta diversities. However, no investigation was conducted on the gastric microbiome in that study. Moreover, the study demonstrated racial background to be one of the strongest influences on the microbiome composition. Conversely, in the present study, a comparative analysis of the gastric as well as oral and intestinal microbiota was performed using samples from the same individuals of a single racial group.
The pioneer studies by Bik et al.15 and Li et al.10 on the gastric mucosa-associated microbiota using high-throughput 16S sequencing revealed very similar results, although these two studies analyzed geographically and racially distinct populations. Both studies identified two major abundant genera, Streptococcus and Prevotella, which accounted for ~40% of the total detected species. The present study on the luminal microbiota also detected these two species as the top two genera, accounting for ~50% of the total species in the stomach. Neisseria and Rothia, which were detected as the third major genera in the previous studies, were also ranked fourth and fifth, respectively, in the present study. This similarity of the bacterial composition between the two intragastric compartments, luminal and mucosa-associated, suggested a “two-way interaction” in which the luminal bacteria not only colonize the mucosa but also the mucosal bacteria flow back into the lumen. H. pylori is also thought to inhabit the stomach in this two-way manner, although it typically colonizes the mucosa, including gastric epithelial cells, and the surface mucous layer.16 In fact, H. pylori was identified as the dominant bacterial species in the gastric mucosal specimens from H. pylori-infected patients,17 whereas the present study revealed H. pylori to be a minor bacterium in the GF samples.
Our culturing method revealed that the suppression of gastric acid secretion in the PPI-users resulted in ~1,000 times bacterial overgrowth in their stomachs. The relationship between changes in the pH value and bacterial count using the culturing method in the GF reported by Ruddell et al.1 was similar to our findings. That is, at pH 5.0, the bacterial count was 106–107 CFU/ml in both the previous and present studies, indicating the consistency of our culturing method. It has been reported that GF with pH<4 has a bactericidal property, whereas GF pH>4 enables bacterial residence in the stomach.18, 19 As the GF pH ranged >4 in PPI-users (see Table 1), many of transient bacteria from the oral cavity may have survived, even in the stomach. Because both the bacterial count by qPCR and the bacterial composition were nearly identical between PPI-users and PPI-nonusers, a marked increase in the number of gastric bacteria demonstrated by the culturing method in PPI-users may be due to a lack of killing rather than proliferation of the bacteria in the stomach. These results thus suggested that the inflow of metabolically active gastric microbiota, many of which transferred from the oral cavity, into the colon may significantly affect the intestinal microbial community in PPI-users. The relevance of PPI administration to small intestinal bacterial overgrowth remains uncertain in the present study, because no specific examination was performed to identify small intestinal bacterial overgrowth in the present study.
In the present study, the PPI administration induced a small but significant increase in the interindividual diversity. Amir et al.20 also reported that the unweighted UniFrac analysis demonstrated an increase in the beta diversity of the GF microbiota of the subjects who were treated with PPI for 8 weeks. The pH value is known to be higher in the feces comapred with that in the GF. Furthermore, the beta diversity of the fecal microbiota was also significantly higher compared with that of the GF microbiota in our study. It is interesting that an elevation of the pH in the GF by PPI treatment was associated with an increase in the beta diversity of the GF microbiota in the present study, although the biological significance remains unclear. Considering that the pH value-associated increase in the beta diversity by PPI treatment was also observed in the salivary microbiota in our study, a change in the beta diversity of the GF microbiota may be caused by such a change in the salivary microbiota and/or an elevated pH in the GF. It is also possible that PPI may directly affect the microbiota through targeting the proton pump of certain bacteria that contain P-type ATPase.21
In the present study, a strong tendency of a reduction of Faecalibacterium was found in the feces of PPI-users as compared with PPI-nonusers. The reduced abundance of Faecalibacterium was also reported in the feces of dogs administered PPI for 15 days.22 Faecalibacterium is known to possess anti-inflammatory properties and is depleted during episodes of inflammatory bowel diseases.23, 24 It is thus interesting that lansoprazole, one of the representative PPI, is reported to be associated with collagenous colitis, a chronic inflammatory illness of the colon.25 Seto et al.26 treated healthy volunteers with PPI for 28 days and examined the change in the fecal microbiota. Although no reduction in the abundance of Faecalibacterium was observed in their study, a significant decrease in the OTU number was found in the fecal microbiota. On the other hand, no such decrease of the alpha diversity in the fecal microbiota was found in PPI-users compared with PPI-nonusers in our study. Taken together, the influence of PPI administration on the fecal as well as gastric luminal microbiota appears to be controversial and requires further investigation.
The strengths of the present study include the analysis of three types of GI microbiota including gastric microbiota from the same individuals in a single racial group, the advanced method of the analysis, and comparative enumeration of the bacterial count in the stomach by both qPCR and culturing methods. The limitations associated with this study include the relative small number of subjects in each group and the significant age difference between the two groups.
Study Highlights
Acknowledgments
We thank K. Komiya, C. Shindo, H. Kuroyanagi, E. Iioka, Y. Takayama, E. Ohmori, M. Kiuchi (The University of Tokyo), and Y. Noguchi (Azabu University) for their valuable technical assistance.
Guarantor of the article: Yasuhiro Koga, MD.
Specific author contributions: AT and AT recruited the patients and subjects, collected the clinical samples, and performed bacteriological analyses of the samples. WS and KT performed the genetic analyses of the samples and analyzed the data. HM and MH were involved in the study concept and design, data interpretation, and critical revision of the manuscript. YK was involved in the study concept and design, data interpretation, and drafting of the manuscript.
Financial support: This work was supported in part by a Grant-in-Aid for Challenging Exploratory Research to MH and HM from the Japan Society for the Promotion of Science (JSPS).
Potential competing interests: None.
Footnotes
Supplementary Information accompanies this paper on the Clinical and Translational Gastroenterology website (http://www.nature.com/ctg)
Supplementary Material
References
- Ruddell WSJ, Axon ATR, Findlay JM et al. Effect of cimetidine on the gastric bacterial flora. Lancet 1980; 1: 672–674. [PubMed] [Google Scholar]
- Delgado S, Cabrera-Rubio R, Mira A et al. Microbiological survey of the human gastric ecosystem using culturing and pyrosequencing methods. Microb Ecol 2013; 65: 763–772. [DOI] [PubMed] [Google Scholar]
- Sandra Dial M. Proton pump inhibitor use and enteric infections. Am J Gastroenterol 2009; 104: S10–S16. [DOI] [PubMed] [Google Scholar]
- Williams C, McColl KEL. Review article: proton pump inhibitors and bacterial overgrowth. Aliment Pharmacol Ther 2006;23:3–10. [DOI] [PubMed] [Google Scholar]
- Li J, Jia H, Cai X et al. An integrated catalog of reference genes in the human gut microbiome. Nat Biotechnol 2014; 32: 834–841. [DOI] [PubMed] [Google Scholar]
- Simon-Soro A, Tomas I, Cabrera-Rubio R et al. Microbial geography of the oral cavity. J Dent Res 2013; 92: 616–621. [DOI] [PubMed] [Google Scholar]
- Morita H, Kuwahara T, Ohshima K et al. An improved DNA isolation method for metagenomic analysis of the microbial flora of the human intestine. Microbes Environ 2007; 22: 214–222. [Google Scholar]
- Said HS, Suda W, Nakagome S et al. Dysbiosis of salivary microbiota in inflammatory bowel disease and its association with oral immunologic biomarkers. DNA Res 2014; 21: 15–25. [DOI] [PMC free article] [PubMed] [Google Scholar]
- Igarashi M, Nagano J, Tsuda A et al. Correlation between the serum pepsinogen I level and the symptom degree in proton pump inhibitor-users administered with a probiotic. Pharmaceuticals 2014; 7: 754–764. [DOI] [PMC free article] [PubMed] [Google Scholar]
- Kim S-W, Suda W, Kim S et al. Robustness of gut microbiota of healthy adults in response to probiotic intervention revealed by high-throughput pyrosequencing. DNA Res 2013; 20: 241–253. [DOI] [PMC free article] [PubMed] [Google Scholar]
- Li X-X, Wong GL-H, To K-F et al. Bacterial microbiota profiling in gastritis without Helicobacter pylori infection or non-steroidal anti-inflammatory drug use. PLoS ONE 2009; 4: e7985. [DOI] [PMC free article] [PubMed] [Google Scholar]
- Lozupone C, Lladser ME, Knight D et al. UniFrac: an effective distance metric for microbial community comparison. ISME J 2011; 5: 169–172. [DOI] [PMC free article] [PubMed] [Google Scholar]
- Wu WM, Yang YS, Peng LH. Microbiota in the stomach: new insights. J Digest Dis 2014; 15: 54–61. [DOI] [PubMed] [Google Scholar]
- The Human Microbiome Project Consortium. . Structure, function and diversity of the healthy human microbiome. Nature 2012; 486: 207–214. [DOI] [PMC free article] [PubMed] [Google Scholar]
- Bik EM, Eckburg PB, Gill SR et al. Molecular analysis of the bacterial microbiota in the human stomach. Proc Natl Acad Sci USA 2006; 103: 732–737. [DOI] [PMC free article] [PubMed] [Google Scholar]
- Amieva MR, El-Omar EM. Host-bacterial interactions in Helicobacter pylori infection. Gastroenterology 2008; 134: 306–323. [DOI] [PubMed] [Google Scholar]
- Eun CS, Kim BK, Han DS et al. Difference in gastric mucosal microbiota profiling in patients with chronic gastritis, intestinal metaplasia, and gastric cancer using pyrosequencing methods. Helicobacter 2014; 19: 407–416. [DOI] [PubMed] [Google Scholar]
- Stockbruegger RW. Bacterial overgrowth as a consequence of reduced gastric acidity. Scand J Gastroenterol 1985; 111: 7–16. [DOI] [PubMed] [Google Scholar]
- Wilder-Smith CH, Spirig C, Krech T et al. Bactericidal factors in gastric juice. Eur J Gastroenterol Hepatol 1992; 4: 885–891. [Google Scholar]
- Amir I, Konikoff FM, Oppenheim M et al. Gastric microbiota is altered in esophagitis and Barrett's esophagus and further modified by proton pump inhibitors. Environ Microbiol 2013; 16: 2905–2914. [DOI] [PubMed] [Google Scholar]
- Vesper BJ, Jawdi A, Altman KW et al. The effect of proton pump inhibitors on the human microbiota. Curr Drug Metab 2009; 10: 84–89. [DOI] [PubMed] [Google Scholar]
- Garcia-Mazcorro JF, Suchodolski JS, Jones KR et al. Effect of the proton pump inhibitor omeprazole on the gastrointestinal bacterial microbiota of healthy dogs. FEMS Microbiol Ecol 2012; 80: 624–636. [DOI] [PubMed] [Google Scholar]
- Valera E, Manichanh C, Gallart M et al. Colonisation by Faecalibacterium prausnitzii and maintenance of clinical remission in patients with ulcerative colitis. Aliment Pharmacol Ther 2013; 38: 151–161. [DOI] [PubMed] [Google Scholar]
- Sokol H, Pigneur B, Watterlot L et al. Faecalibacterium prausnitzii is an anti-inflammatory commensal bacterium identified by gut microbiota analysis of Crohn disease patients. Proc Natl Acad Sci USA 2008; 105: 16731–16736. [DOI] [PMC free article] [PubMed] [Google Scholar]
- Gilbert MW, Mattia A. Collagenous colitis associated with lansoprazole. J Clin Gastroenterol 2002; 34: 164–166. [DOI] [PubMed] [Google Scholar]
- Seto CT, Jeraldo P, Orenstein R et al. Prolonged use of a proton pump inhibitor reduces microbial diversity: implications for Clostridium difficile susceptibility. Microbiome 2014; 2: 42. [DOI] [PMC free article] [PubMed] [Google Scholar]
Associated Data
This section collects any data citations, data availability statements, or supplementary materials included in this article.


