Abstract
Objectives:
The variation of luminal pH and transit time in an individual is unknown, yet is necessary to interpret single measurements. This study aimed to assess the intrasubject variability of gut pH and transit time in healthy volunteers using SmartPill devices (Covidien, Minneapolis, MN).
Methods:
Each subject (n=10) ingested two SmartPill devices separated by 24 h. Mean pH values were calculated for 30 min after gastric emptying (AGE), before the ileocecal (BIC) valve, after the ileocecal (AIC) valve, and before body exit (BBE). Intrasubject variability was determined by comparing mean values from both ingestions for an individual subject using standard deviations, 95% limits of agreement, and Bland-Altman plots.
Results:
Tandem device ingestion occurred without complication. The median (full range) intrasubject standard deviations for pH were 0.02 (0.0002–0.2048) for AGE, 0.06 (0.0002–0.3445) for BIC, 0.14 (0.0018–0.3042) for AIC, and 0.08 (0.0098–0.5202) for BBE. There was a significant change in pH for AIC (mean difference: −0.45±0.31, P=0.0015) observed across all subjects. The mean coefficients of variation for transit time were 12.0±7.4% and 25.8±15.8% for small and large bowels, respectively (P=0.01).
Conclusions:
This study demonstrates the safety and feasibility of tandem gut transit and pH assessments using the SmartPill device. In healthy individuals and over 24 h, the gut pH profile does not markedly fluctuate in a given region with more variation seen in the colon compared with the small bowel, which has important implications for future physiology and drug delivery studies.
Introduction
In 1972, Brown and co-workers utilized radiotelemetric technology with a glass electrode for in vivo measurement of intraluminal gut pH.1 Since then at least eight additional studies have employed similar technology to characterize the pH profile of the gut in healthy individuals. Each of these studies has shown that luminal pH in the proximal small bowel ranges from 5.9 to 6.8, as the alkaline pancreatic secretions buffer the acidic gastric contents. The pH then gradually rises to 7.3–7.7 in the distal ileum, as the small bowel mucosa secretes bicarbonate. At the ileocecal junction, there is an abrupt decrease in the pH of the cecum (5.8–6.7), thought to be reflective of the fermentation of carbohydrates to short chain fatty acids (SCFAs) by colonic bacteria. Finally, there is a described increase in the pH of the left colon and rectum to 6.1–7.2 as the colon absorbs SCFAs and secretes bicarbonate.2
The SmartPill (Covidien, Minneapolis, MN), was introduced in 2006 as a novel radiotelemetric device to record pH, transit time, and pressure within an individual's gastrointestinal (GI) tract and was FDA (Food and Drug Administration) approved for assessment of gastroparesis. The SmartPill is a wireless motility capsule that transmits data captured from a subject's GI tract to a data receiver worn by the subject. This device has been used to determine gut pH profiles in healthy volunteers. In such assessments, the mean pH in different locations of the intestine was as follows: proximal small bowel 6.4 (95% confidence interval 6.1–6.8); ileum 7.6 (7.4–7.8); proximal colon 6.2 (5.8–6.5); and distal colon 7.3 (7.0–7.6).3
All the previously mentioned studies were based upon one-time measurements of gut pH; the generalizability of these data is unknown because there is no current evidence to suggest that it is a static measurement. In fact, no study to date has been performed to evaluate the possibility of intrasubject variations in luminal pH or transit time, whether due to physiologic processes or limitations of the radiotelemetric technology. This study assessed intrasubject variability in the pH and transit time of the small and large bowel of healthy volunteers.
Methods
Screening and eligibility
This is an IRB (Institutional Review Board) approved, prospective study of healthy volunteers who were recruited from the use of flyers and referrals in The University of Chicago Medicine. Subjects were excluded if they would need a magnetic resonance imaging during the study; were breastfeeding or pregnant; have history of dysphagia or swallowing disorder, diabetes mellitus, GI surgery within the past 3 months, diverticulosis, Schatzki's ring or any bowel stricture, known bowel obstruction, fistula, toxic megacolon, gastric bezoar, or inflammatory bowel disease; were unable to stop antacids within 24 h of capsule ingestion, pro-motility drugs within 72 h of capsule ingestion, H2 blockers within 48 h of capsule ingestion, proton pump inhibitors within 7 days of capsule ingestion, antibiotics within 7 days of capsule ingestion, or tobacco use for 8 h before capsule ingestion; or have a pacemaker and/or automatic electrical implanted defibrillator, implanted infusion pump, or any implanted or portable electro-mechanical medical device.
Materials and methods
The SmartPill is a polyurethane capsule that measures 26 mm × 13 mm. It contains a solid-state pressure sensor, an ion-sensing field effect transducer, a pH sensor, a solid-state temperature sensor, and electronic subassemblies supporting the pressure and pH sensors, as well as a radiofrequency transmitter and an antenna. Two 1.5 Volt silver oxide batteries provide power to the device up to 5 days.4
The pH sensor of the device measures pH in the range of 0.5–9.0 with an accuracy of ±0.5 pH units, meaning that the recorded pH will never differ more/less than 0.5 pH units from the actual value. In the first 24 h, this is actually no more/less than 0.25 pH units. The original Smartpill Corporation determined this accuracy by assessing (in a 5-day period) the measurements reported by capsules submerged in solutions at body temperature with a known pH value that ranged from 0.5 to 9.0. The sensor is an ISFET (ion-sensitive field-effect transistor-based sensor), which utilizes a single-point calibration at room temperature immediately preceding ingestion with a citrate buffer with pH 6.0.
The device also measures pressure in the range of 0–350 mm Hg with an accuracy of ±5 mm Hg below and ±10 mm Hg above 100 mm Hg and temperature in the range of 20–40 °C with an accuracy of ±1 °C. The pH is measured every 5 s for the first 24 h, every 10 s for 24–48 h, and every 5 min after 48 h. Pressure is measured every 0.5 s for the first 24 h and every 1 s after 24 h. Temperature is measured every 20 s for the first 24 h and every 40 s after 24 h. The pH, pressure, and temperature measurements, battery voltage, capsule serial number, and a data packet identification number are transmitted at 434 MHz to the subject-worn data receiver every 20 s for the first 24 h of capsule operation, and subsequently, every 40 s for the duration of the capsule use.5 The receiver device has an “Event” button to indicate the timing of food consumption and bowel movements during capsule transmission.
The Smartbar, a 260 kcal FDA approved nutrient bar, was used as a replacement for the standard eggbeater meal. It contains the following ingredients: whey crisp, rolled oats, rice syrup, corn syrup, invert sugar, concentrated whey protein, puffed wheat, apple juice concentrate, glycerine, molasses, and 2% or less of: honey, defatted wheat germ, dried apples, dried cranberries, partially hydrogenated vegetable shortening (soy and/or cottonseed oils), natural and artificial flavors, potassium sorbate (as preservative), salt, and vanilla.
Ingestion of the smart pill
All subjects enrolled fasted for 8 h preceding the ingestion of their initial SmartPill. They were also instructed to refrain from tobacco use for 8 h preceding capsule ingestion. Upon arrival at The University of Chicago Medical Center, written informed consent was obtained in standard manner by a member of the study team. The capsule was calibrated to a pH of 6.0 and synced to a data receiver before ingestion. Subjects consumed the Smartbar with a  glass of water, followed by the SmartPill with additional water. Subjects were instructed to remain NPO (nothing by mouth) for 6 h post device ingestion, with the exception of one
  glass of water to be consumed 2 h after ingestion. Following this 6-h period, each subject was permitted to resume their normal diet until midnight, at which point they reverted to being NPO and tobacco free.
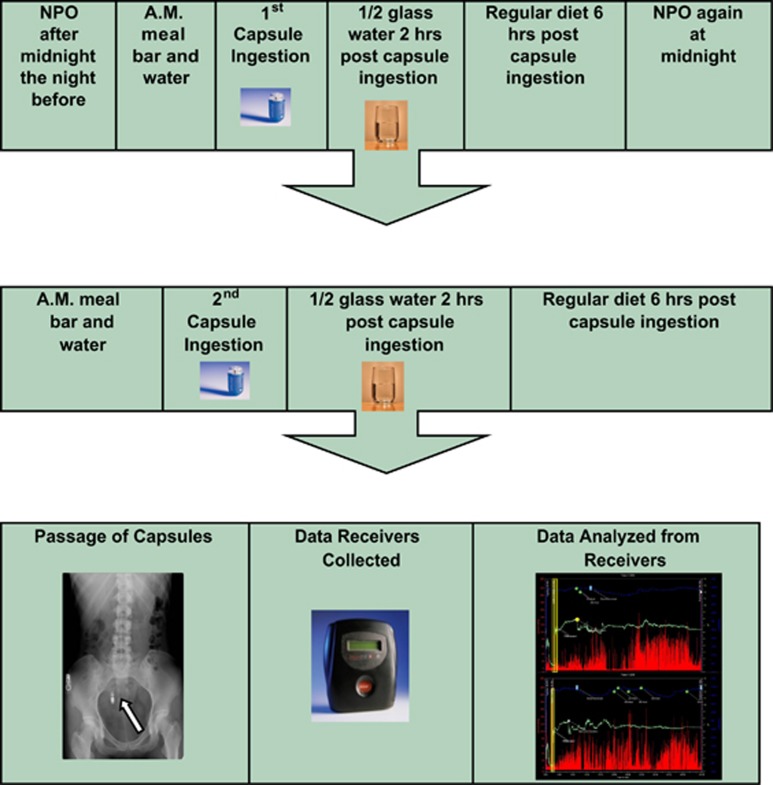
Twenty-four hours after ingestion of the initial SmartPill, each subject ingested a second capsule in a manner identical to that described above. This capsule was synced to a second, separate data receiver. Post capsule ingestion instructions were identical to the first capsule procedure (Figure 1).
Figure 1.
The standard study timeline using the SmartPill device (AM=morning, NPO=nothing by mouth).
Data transmission
Subjects wore the two wireless data receivers either clipped to their clothing or on lanyards around their neck. Subjects were instructed to keep the receivers positioned within four feet of their abdomen at all times; it could be separated from the body during bathing and sleeping as long as it remained within this distance limitation. All subjects were asked to record bowel movements and meals by using the “Event” button on the data receivers. Subjects then correlated these instances with manual recordings in a diary of the timing of bowel movements and the timing and contents of meals.
To ensure that the data receivers would capture a temperature decrease as it transitioned from the body to the toilet, subjects were instructed to count to 100 after completion of a bowel movement before flushing the toilet. Concurrently, subjects were instructed to monitor the light on the receiver that confirms successful data transmission. If the sensing light remained inactive (red) for a period of 30 min, especially following a bowel movement, then the subject was to assume that the capsule had exited the body. The subjects returned the data receivers by mail in a pre-paid, pre-addressed containers.
Data analysis
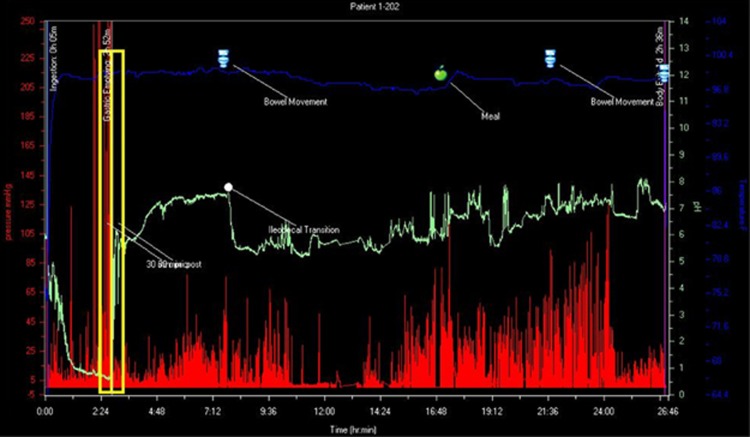
A convenient sample size of 11 patients (22 ingestions) was chosen to sufficiently demonstrate the safety and feasibility of the novel methodology of tandem ingestion and to produce hypothesis-generating data, which could then be used to guide future studies. After receipt of each subject's wireless data receivers, the data were downloaded via the SmartPill docking station and imported into the SmartPill MotiliGI (Minneapolis, MN) software. The raw data were then exported into a central database, where an unblinded individual performed data analysis. Certain landmarks within the GI tract (ingestion, gastric emptying time, ileocecal transition, and body exit) were determined by identifying simultaneous characteristic changes in pH, pressure, and temperature using the MotiliGI (Figure 2). Gastric emptying time was defined as the time at which there was an abrupt, sustained rise in pH (greater than 2 pH units) as the capsule entered the more alkaline duodenum. The ileo-cecal transition point was defined as the time at which there was a sudden drop of 1 pH unit after a gradual, sustained rise in pH over several hours. Body exit was defined as either the time at which there was cessation of the device generating data that coincided with a bowel movement or large increases in pressure that correlated with a sudden decrease in temperature.6, 7 Mean pH values for each ingestion were calculated for 30, 60, and 120 min after gastric emptying (AGE) time (representative of proximal small bowel), before (BIC) and after the ileocecal (AIC) transition (representative of distal small bowel and proximal colon, respectively), and before body exit (BBE) (representative of distal colon). Transit time values for each ingestion were also calculated for the small bowel, large bowel, and the entire GI tract. The mean pH and transit times were calculated based upon exported data from the data receiver. After determining the timestamp that correlated to a location in the GI tract, each subsequent or preceding data point included in the 30-min interval from this time was averaged together to determine a mean pH. Small bowel transit time was calculated by determining the difference between the times that correlated to stomach exit and to passage across the IC valve. Large bowel transit time was calculated by determining the difference between the times that correlated to passage across the IC valve and body exit. Total transit time was calculated by determining the difference between the times of capsule ingestion and body exit.
Figure 2.
An example of the MotiliGI software. The red tracings represent pressure measurements (mm Hg), the green tracings represent pH measurements, and the blue tracings represent temperature measurements (degrees Fahrenheit) all plotted on the axis of time (h:min). This image effectively depicts the well-described pH profile of a normal gut: an acidic pH in the stomach, which abruptly increases in the small bowel (transition outlined by the yellow box), the gradual rise in pH throughout the small bowel, which abruptly decreases at the cecum (marked by the white dot), and the gradual increase through the colon. The data points on the graph were then exported to data spreadsheets, which were used in the data analyses.
Intrasubject variability was determined by computing the standard deviation (s.d.) between the two pH values of each segment of the GI tract for an individual subject. Agreement between the pH and transit times recorded at the two time points was assessed with Bland-Altman plots, 95% limits of agreement (LoA), and coefficients of repeatability (CRs=1.96 times the standard deviation of intrasubject differences). The LoA (mean intrasubject difference ±1.96 s.d. of intrasubject differences) is an interval within which most individual intrasubject differences are likely to fall. The interval characterized by the LoA is analogous to a 95% confidence interval for the mean intrasubject difference, computed using the standard deviation instead of the standard error. When the mean difference is equal to zero, the LoA is symmetric about zero, and the interval limits are equal in magnitude but have opposite signs. The upper limit of an interval characterized by LoA centered at zero is defined as the CR. For example, if CR=0.5, then most pairs of measurements from the same subject are expected to be no more than 0.5 units apart (i.e., their differences would mostly fall in the interval (−0.5, 0.5)). When the mean intrasubject difference is significantly different from zero (i.e., when computation of the CR is not possible), the asymmetric 95% LoA is provided. Intrasubject variability in transit times was summarized using coefficients of variation.
Bland-Altman plots were also used to investigate whether differences between subsequent measurements varied according to the magnitude of the measurements.8 Paired t-tests were also used to compare the mean differences in pH values and transit times for all 10 subjects' first and second ingestions. As a sensitivity analysis, non-parametric analogs of these tests (i.e., Friedman test and Wilcoxon signed rank test) were also performed. All statistical analyses were performed using StatPlus (AnalystSoft, Alexandria, VA) and R version 3.02 (R Foundation for Statistical Computing, Vienna, Austria).
Results
A total of 11 subjects were recruited, screened, and enrolled in this study: seven were male and four were female. Participants' ages ranged from 18 to 26 years old (mean±s.d.: 21±2.68 years old).
Tandem device ingestion and data transmission occurred without any adverse events experienced by the subjects. However, one subject's data could not be included as data transmission for the second injection did not occur past the stomach. The subject was able to visibly confirm the presence of the second pill following a bowel movement. A similar, though less substantial event occurred in the second ingestion for subject #9 when data transmission was lost during colonic transit.
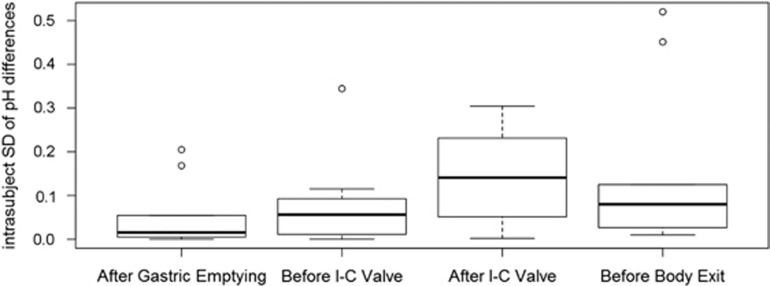
The mean pH values for 30 min after each landmark for each individual ingestion are shown in Table 1. The average pH values for all 20 ingestions together were 5.71±0.44 (standard deviation) for 30 min AGE, 7.35±0.32 for the 30-min BIC valve, 6.07±0.38 for the 30-min AIC valve, and 6.84±0.51 for the 30-min BBE, with median values of 5.79, 7.37, 6.04, and 6.77, respectively. The medians and ranges of the intrasubject standard deviations between the two ingestions for all 10 patients are 0.02 (0.0002–0.2048) for 30 min AGE, 0.06 (0.0002–0.3445) for 30 min BIC, 0.14 (0.0018–0.3042) for 30 min AIC, 0.08 (0.0098–0.5202) for 30 min BBE, and 0.05 (0.0002–0.5202) for all four locations combined (Figure 3). There is a trend of stable standard deviations in the small bowel with an increase in the proximal colon that decreases in the distal colon, but this trend is not statistically significant.
Table 1. The pH values for each patient's ingestion at each landmark.
| Patient |
30 min after GE |
30 min before ICV |
30 min after ICV |
30 min before body exit |
||||
|---|---|---|---|---|---|---|---|---|
| A | B | A | B | A | B | A | B | |
| 1 | 5.05 | 5.14 | 7.66 | 7.51 | 6.54 | 6.04 | 7.54 | 7.14 |
| 2 | 6.14 | 5.81 | 7.80 | 7.45 | 6.50 | 6.18 | 6.41 | 6.64 |
| 3 | 5.51 | 4.87 | 6.98 | 7.3 | 6.08 | 5.4 | 6.88 | 5.86 |
| 4 | 6.59 | 6.01 | 7.49 | 7.37 | 6.03 | 6.25 | 6.3 | 6.55 |
| 5 | 5.87 | 5.89 | 7.68 | 7.25 | 6.32 | 5.63 | 6.72 | 7.67 |
| 6 | 5.87 | 5.76 | 7.70 | 6.87 | 6.72 | 5.94 | 6.91 | 6.77 |
| 7 | 5.25 | 5.41 | 6.87 | 6.89 | 5.78 | 5.22 | 6.53 | 6.03 |
| 8 | 6.08 | 6.36 | 7.78 | 7.36 | 6.38 | 5.91 | 7.49 | 6.99 |
| 9 | 5.55 | 5.45 | 6.92 | 7.19 | 6.03 | 5.97 | 6.71 | — |
| 10 | 5.87 | 5.68 | 7.67 | 7.19 | 6.5 | 5.89 | 7.26 | 7.48 |
| Mean pH (s.d.) A or B | 5.78 (0.45) | 5.64 (0.43) | 7.46 (0.38) | 7.24 (0.22) | 6.29 (0.30) | 5.84 (0.33) | 6.88 (0.43) | 6.79 (0.61) |
| Mean pH (s.d.) A and B | 5.71 (0.44) | 7.35 (0.32) | 6.07 (0.38) | 6.84 (0.51) | ||||
| Median pH A and B | 5.79 | 7.37 | 6.04 | 6.77 | ||||
| Mean Δ pH (s.d.) B−A | −0.14 (0.30) | −0.22 (0.36) | −0.45 (0.31) | −0.10 (0.58) | ||||
GE, gastric emptying; ICV, ileocecal valve; s.d., standard deviation.
This table includes the pH values for each 30-min segment of time measured from the four landmarks of the small/large bowel for each individual ingestion. Also included are the values of the within-ingestion mean pH, overall mean and median pH values across all 20 ingestions, and mean intrasubject pH differences.
Figure 3.
Mean intrasubject variation in pH values for each section of gastrointestinal (GI) tract, expressed as the standard deviation between ingestions. For an individual subject, the pH values were calculated for each section of the GI tract for the first ingestion and for the second ingestion. The standard deviation of the two pH values for each location was then calculated. The intrasubject standard deviations in each of the four landmarks are graphically displayed using boxplots, with heavy lines representing the median and outer edges of the boxes representing the first and third quartiles. “Whiskers” extend above and below the first and third quartiles to indicate the nominal range (first quartile−1.5 IQD, third quartile+1.5 IQD), where IQD is the absolute difference between the first and third quartiles. Circles are used to represent outliers, i.e., extreme intrasubject standard deviations that extend beyond the nominal range. There is a trend of stable intrasubject variability in the small bowel with an increase in the proximal colon that decreases in the distal colon. I-C, ileocecal valve; s.d., standard deviation.
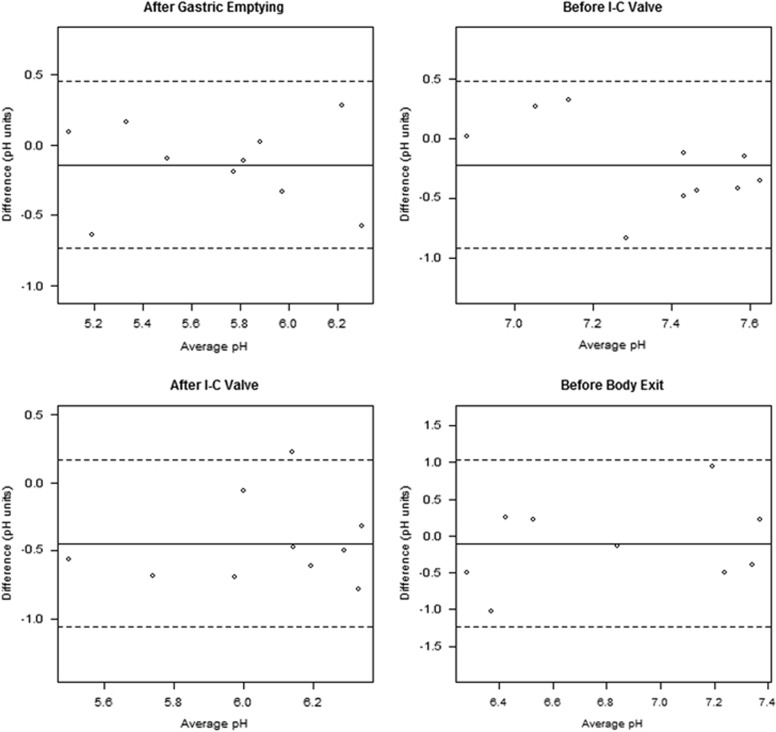
The mean differences in pH values between the two ingestions were −0.14±0.30 for 30 min AGE (P=0.18), −0.22±0.36 for 30 min BIC (P=0.09), −0.45±0.31 for 30 min AIC (P=0.0015), and −0.10±0.58 for 30 min BBE (P=0.62). In regards to AGE and BIC, the CRs are 0.60 and 0.70, respectively, meaning that 95% of the absolute differences in pH in these two locations are expected to be less than the values of these coefficients. It was not appropriate to calculate a repeatability coefficient for AIC because the mean difference is significantly different from zero (as demonstrated above). However, most intrasubject pH differences associated with the AIC landmark are expected to fall within the interval characterized by the 95% LoA (−1.06, 0.16). BBE pH has a slightly higher CR (1.14). There was no evidence of a linear relationship between magnitude of the pH difference and magnitude of the absolute measurements in the Bland-Altman plots (Figure 4). Regression analyses of the relationship between differences and means for the pairs of observed pH values (not shown) did not reveal any evidence of a systematic bias.
Figure 4.
Bland-Altman plots for the pH values across the two ingestions for each patient at each location. Solid and dashed lines represent mean and 95% confidence limits of the pairwise differences, respectively. There was no evidence of a relationship between magnitude of the pH difference and magnitude of the absolute measurements. I-C, ileocecal valve.
The mean transit times for each individual ingestion are shown in Table 2.
Table 2. The transit time data (in minutes) for the small bowel, large bowel, and the entire gut for each individual ingestion.
| Patient |
Small bowel (min) |
Large bowel (min) |
Total (min) |
|||
|---|---|---|---|---|---|---|
| A | B | A | B | A | B | |
| 1 | 289 | 301 | 938 | 1,123 | 1,419 | 1,591 |
| 2 | 299 | 330 | 1,654 | 2,784 | 2,069 | 3,262 |
| 3 | 292 | 263 | 1,451 | 1,058 | 1,979 | 1,500 |
| 4 | 196 | 272 | 323 | 157 | 719 | 503 |
| 5 | 340 | 356 | 876 | 807 | 1,408 | 1,285 |
| 6 | 219 | 255 | 1,091 | 1,009 | 1,554 | 1,366 |
| 7 | 312 | 326 | 955 | 1,004 | 1,366 | 1,428 |
| 8 | 399 | 329 | 1,394 | 865 | 1,947 | 1,384 |
| 9 | 232 | 314 | 4,029 | 4,388 | ||
| 10 | 216 | 232 | 624 | 851 | 1,006 | 1,432 |
| Mean (s.d.) A or B | 279.4 (63.72) | 297.8 (40.14) | 1,333.5 (1026.22) | 1,073.11 (701.91) | 1,785.5 (1009.31) | 1,527.89 (723.48) |
| Mean (s.d.) A and B | 288.6±52.7 | 1,210.2±873.7 | 1,663.5±871.46 | |||
| Median | 295.5 | 1,004.0 | 1,428.0 | |||
| Mean Δmin (s.d.) B−A | 18.4 (44.68) | 39.11 (477.57) | 31.56 (533) | |||
A, first ingestion; B, second ingestion; s.d., standard deviation.
Also displayed are the within-ingestion mean, overall mean and median transit times across all 20 ingestions.
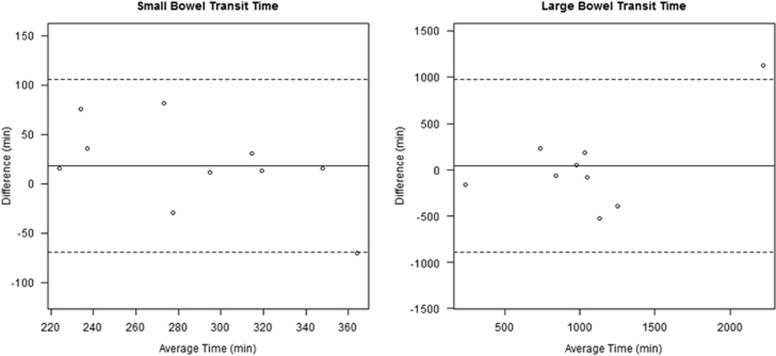
The mean transit time across all 20 ingestions for the small bowel was 288.6±52.7 min (4.81 h), 1,210.2±873.7 min (20.17 h) for the large bowel, and 1667.3±871.46 min (27.8 h) for the entire gut, with median values of 295.5, 1,004.0, and 1,428.0, respectively. The mean coefficients of variation between the two ingestions for all 10 subjects were 12.0±7.4% for the small bowel, 25.8±15.8% for the large bowel (P=0.01), and 19.4±10.2% for the entire gut. Transit time coefficients of reliability in the small bowel, large bowel, and overall (87.57, 936.05, and 1,044.68, respectively) are quite large, suggesting that transit times significantly vary from 1 day to the next. There was no evidence of a linear relationship between transit time difference and magnitude in the Bland-Altman plots (Figure 5).
Figure 5.
Bland-Altman plots for the small and large bowel transit time values across the two ingestions for each patient. Solid and dashed lines represent mean and 95% confidence limits of the pairwise differences, respectively. There was no evidence of a linear relationship between transit time difference and magnitude.
Discussion
This study uniquely illustrates intrasubject variations in luminal pH and transit time in healthy volunteers. Our data show that the gut pH profile remains stable for an individual, with more variation seen in the colon compared with the small bowel. We also demonstrated that small bowel transit time is less variable than colonic transit time. Finally, we have revealed the safety and feasibility of the SmartPill device for tandem ingestion and investigative purposes in healthy volunteers.
Understanding reliable pH and transit times of the bowel is important for many reasons. There is increased appreciation for the role of underlying motility disorders in functional bowel problems. Accurate measurements of these variations are required to better describe the abnormalities and define the parameters of "normalcy." In addition, previous studies have demonstrated alterations in intraluminal gut pH that is associated with disease. These observations contribute to an understanding of pathophysiologic processes. Finally, many medications incorporate an oral delivery system that depends on appropriate gut transit and changes in pH. Further knowledge of variations among healthy and diseased individuals will guide interpretation of therapy effectiveness and design for future delivery systems.
Our subjects' pH profiles are similar to previous studies of the physiology of normal GI tracts.2, 4 We measured an acidic pH in the stomach, which abruptly increased in the proximal small bowel before a gradual increase in pH with distal movement. Likewise we noted a sharp decrease in pH in the cecum, which increased gradually with progression though the colon. We did, however, observe lower pH values in the proximal small bowel and distal colon compared with other publications. We hypothesize that this is due to the standardized meal or differences in techniques using SmartPill as compared with earlier studies.2, 3
The median s.d. of intrapatient differences in pH is 0.05 (0.0002–0.5202). Furthermore, the LoA was small, with absolute differences less than 0.6, 0.7, and 1.14 units in the AGE, BIC, and BBE landmarks, respectively, and pH values in the AIC landmark are generally within 1.06 units of one another. These data demonstrate that the intraluminal pH does not markedly fluctuate in a given region of the gut over the course of 24 h and that repeat measurements of mean pH for a given region in the same subject are highly reproducible.
However, although the LoA suggests that the individual intrasubject differences were relatively small, we did find that the mean intrasubject pH difference between the two ingestions was significantly different from zero. The largest standard deviation was observed in the proximal colon. These data in addition to the LoA for AIC (−1.06, 0.16) and BBE (−1.14, 1.14) being greater in absolute value than AGE (−0.60, 0.60) and BIC (−0.70, 0.70) suggest that the largest variations in pH differences between ingestions occur in the proximal and distal colon. We hypothesize that increased or decreased transit time caused transient changes in pH because of either accelerated or delayed clearance of alkaline bicarbonate secretions. An additional possibility is that these differences are secondary to measurement limitations of the device, which has an accuracy of ±0.5 pH units. We also considered a third possibility that variations in the amount of dietary insoluble fiber caused these differences. Brinkworth et al.9 has shown that a very low fiber diet is associated with a significant reduction in the fecal concentration of SCFA and a non-significant increase in stool pH as compared with a very high fiber diet. Furthermore, SCFA production seems to be maximal in the cecum and ascending colon, and then decreases progressively in the distal colon. These observations may also explain our findings of the increase in the coefficient of variability in the proximal colon that then slightly declines in the distal colon.
Our mean small bowel and colonic transit time values are similar to those described by Maqbool et al.10 and Sarosiek et al.,6 two studies that also utilized the SmartPill device. Additionally, our intrasubject variability for the small bowel (12.0%) is less than the intrasubject variability for mouth to cecum transit time as determined by the lactulose H2 breath test (mean coefficients of variation of 18.5, 29.7, and 28.3% with 10, 15, and 20 g of lactulose, respectively) and the intrasubject variability for scintigraphically determined small bowel transit time (coefficient of variation of 19%). Our intrasubject variability for colonic transit time was similar to the intrasubject variability of scintigraphically determined large bowel transit time (coefficients of variation of 14–28%).11, 12
Interestingly, there is a significant difference in the intrasubject variability between the small bowel and large bowel transit time (12.0% vs. approximately 25.8%). This difference may be secondary to more tightly regulated physiologic mechanisms in the small bowel vs. the colon, or to the small bowel being less sensitive to the fiber content of a meal than the colon.
Two technical malfunctions occurred during this study. The data from one subject could not be included due to an abrupt interruption of data transmission in the stomach during the second ingestion. The same receivers were used successfully by subsequent subjects in this study. This likely represented capsule failure, prolonged separation of the subject from the receiver, or loss of battery strength of the data receiver. During the second device ingestion for subject #9, data transmission also stopped abruptly in the colon. In this instance, given the extended period of time that had transpired (approximately 19 h), the failure in data transmission was thought to be secondary to a loss of battery strength in the data receiver as opposed to a defect in the capsule. Alternatively, it is possible that the subject had passed the pill device with the data receiver beyond the four feet range from toilet and then failed to record an event surrounding the bowel movement. This was a common occurrence as 19/125 subjects of Sarosiek's study had similar issues.6
Our study is limited by a small sample size of 10 young subjects, ranging from age 18 to 26. Future studies with a larger and more heterogeneous population (including geriatric patients) would further validate the findings of this study and broaden the applicability of the results. Furthermore, despite controlling the meals consumed with each device ingestion, the food consumed in between each ingestion was not standardized. Another variable that could be controlled before and between ingestions is physical activity, which could potentially affect gut transit and pH. Also, although this study characterizes variability with mean pH values, it does not provide insight into the variability of the physiologic mechanisms responsible for the mean pH values calculated at any given location and whether there is intrapatient variation within these mechanisms (e.g., a brisk bicarbonate response with a low baseline pH in AGE and a slow bicarbonate response with a high baseline pH would create similar mean pH values for AGE). Finally, future studies could include two blinded analysts to eliminate any possible bias or errors in the identification of landmarks.
In conclusion, this is the first study to assess tandem gut transit and pH assessments in healthy subjects. Our results demonstrate that within 24 h the gut pH profile remains relatively stable for an individual, with more variation seen in the colon as compared with the small bowel, and that small bowel transit time is less variable than colonic transit time. These findings provide important information to define accuracy parameters in physiologic studies and contribute to the information for future research as well.
Study Highlights
Acknowledgments
Writing support was provided by Elin Raun-Royer, who was employed by the University of Chicago Medicine.
Footnotes
Guarantor of the article: David T. Rubin, MD.
Specific author contributions: Designed the study: David T. Rubin; performed the research: Adam E. Mikolajczyk and Bonnie L. Surma; performed the data analysis: Adam E. Mikolajczyk and Sydeaka Watson; wrote the manuscript: David T. Rubin and Adam E. Mikolajczyk.
Financial support: This project was funded in part by the Calvin Fentress Fellowship Award through the Pritzker School of Medicine and the Digestive Disease Research Core Center of the University of Chicago (DK42086).
Potential competing interest: David T. Rubin previously served as a consultant for SmartPill for an unrelated matter. This current study was entirely investigator initiated.
References
- Watson BW, Meldrum SJ, Riddle HC et al. pH profile of gut as measured by radiotelemetry capsule. BMJ 1972; 2: 104–106. [DOI] [PMC free article] [PubMed] [Google Scholar]
- Nugent SG, Kumar D, Rampton DS et al. Intestinal luminal pH in inflammatory bowel disease: possible determinants and implications for therapy with aminosalicylates and other drugs. Gut 2001; 48: 571–577. [DOI] [PMC free article] [PubMed] [Google Scholar]
- Kloetzer L, Gaman A, Nojkov B. Complete pH profiling of the gastrointestinal tract in healthy volunteers with an ambulatory pH capsule [Abstract] Gastroenterology 2007; 132: A#M2149 461. [Google Scholar]
- Zarate N, Mohammed SD, O'Shaughnessy E et al. Accurate localization of a fall in pH within the ileocecal region: validation using a dual scinitigraphic technique. Am J Physiol Gastrointest Liver Physiol 2010; 299: G1276–G1286. [DOI] [PubMed] [Google Scholar]
- The SmartPill Capsule Operational Specifications. Available at www.givenimaging.com Accessed 30 July 2012.
- Sarosiek I, Selover KH, Katz LA et al. The assessment of regional gut transit time in healthy controls and patients with gastroparesis using wireless motility technology. Aliment Pharmacol Ther 2010; 31: 313–322. [DOI] [PMC free article] [PubMed] [Google Scholar]
- Evans DF, Pye G, Bramley R et al. Measurement of gastrointestinal ph profiles in normal ambulant human subjects. Gut 1988; 29: 1035–1041. [DOI] [PMC free article] [PubMed] [Google Scholar]
- Bland JM, Altman DG. Statistical methods for assessing agreement between two methods of clinical measurement. Lancet 1986; 1: 307–310. [PubMed] [Google Scholar]
- Brinkworth GD, Noakes M, Clifton PM et al. Comparative effects of very low-carbohydrate, high-fat and high-carbohydrate, low-fat weight- loss diets on bowel habit and faecal short-chain fatty acids and bacterial populations. Br J Nutr 2009; 101: 1493–1502. [DOI] [PubMed] [Google Scholar]
- Maqbool S, Parkham HP, Friedenberg FK. Wireless capsule motility: comparison of the SmartPill GI monitoring system with scintigraphy for measuring whole gut transit. Dig Dis Sci 2009; 54: 2167–2174. [DOI] [PubMed] [Google Scholar]
- La Brooy SJ, Male PJ, Beavis AK et al. Assessment of the reproducibility of the lactulose H2 breath test as a measure of mouth to caecum transit time. Gut 1983; 24: 893–896. [DOI] [PMC free article] [PubMed] [Google Scholar]
- Cremonini F, Mullan BP, Camilleri M et al. Performance characteristics of scintigraphic transit measurements for studies of experimental therapies. Alimentary Pharmacol Ther 2002; 16: 1781–1790. [DOI] [PubMed] [Google Scholar]


