Abstract
Background
Dental biomechanics based on finite element (FE) analysis is attracting enormous interest in dentistry, biology, anthropology and palaeontology. Nonetheless, several shortcomings in FE modeling exist, mainly due to unrealistic loading conditions. In this contribution we used kinematics information recorded in a virtual environment derived from occlusal contact detection between high resolution models of an upper and lower human first molar pair (M1 and M1, respectively) to run a non-linear dynamic FE crash colliding test.
Methodology
MicroCT image data of a modern human skull were segmented to reconstruct digital models of the antagonistic right M1 and M1 and the dental supporting structures. We used the Occlusal Fingerprint Analyser software to reconstruct the individual occlusal pathway trajectory during the power stroke of the chewing cycle, which was applied in a FE simulation to guide the M1 3D-path for the crash colliding test.
Results
FE analysis results showed that the stress pattern changes considerably during the power stroke, demonstrating that knowledge about chewing kinematics in conjunction with a morphologically detailed FE model is crucial for understanding tooth form and function under physiological conditions.
Conclusions/Significance
Results from such advanced dynamic approaches will be applicable to evaluate and avoid mechanical failure in prosthodontics/endodontic treatments, and to test material behavior for modern tooth restoration in dentistry. This approach will also allow us to improve our knowledge in chewing-related biomechanics for functional diagnosis and therapy, and it will help paleoanthropologists to illuminate dental adaptive processes and morphological modifications in human evolution.
Introduction
Dental biomechanics is a pivotal research area in dentistry to test materials for tooth restoration and to analyse the causes of dental failures [1, 2]. In biology and palaeontology, dental biomechanics is the basis for understanding the relationship between tooth morphology, functional demands and constraints, and evolutionary adaptive processes in the masticatory apparatus of living and extinct animals [3–7]. One of the virtual and numerical tools of dental biomechanics is finite element (FE) analysis which is commonplace in dental industry [8, 9] and has increasingly been used in evolutionary biological studies [7, 10–14].
Nonetheless, it has been recently observed that several shortcomings in FE modeling exist [15], one of which are unrealistic loading conditions. Occlusal loads are usually simplified as point loads applied parallel or oblique with respect to the long axis of the tooth [9, 16–18], but do not take into account the actual topography of the occlusal surface.
Benazzi and colleagues [15] pointed out that during antagonistic occlusal contact wear facets should be considered and loaded in different directions and to different extents. The authors used the Occlusal Fingerprint Analyser (OFA) software [19] to determine the individual contact areas during the power stroke, i.e. the phase of the chewing cycle when upper and lower dentitions meet and antagonistic crowns usually develop wear facets due to attritional and abrasive loss of enamel.
The OFA software is developed to virtually test, record and verify the real physiological directions of the individual power stroke movements, also reflected in the patterns and spatial positions of physical wear facets on the tooth crowns [19]. After loading surface models of antagonistic crowns aligned in maximum intercuspation into the OFA software, the user determines an assumed pathway of the power stroke with beginning and end points for each direction of power stroke movements [19]. The software then moves the models of the lower jaw along the determined pathway and as soon as tooth-to-tooth contact occurs the models are automatically guided along their relief surfaces towards the next defined path-point of the power stroke, generating a real relief guided trajectory. The accuracy of the individual kinematics can be assessed afterwards by comparing the original contact patterns (wear facet position) on the crowns with the results of virtual contact areas, detected during the calculation of the pathway trajectory. The individuals`trajectory is recorded per user-defined time step. Based on OFA results, Benazzi and colleagues [15] selected for their FE analysis the power stroke contact areas (collision surfaces) recorded in three power stroke-representative time steps, i.e., during the incursive phase I, at maximum intercuspation contact (centric occlusion), and in the excursive phase II to evaluate the stress distribution in teeth during occlusion.
Even though this approach is by far more realistic than simply reducing the occlusal force to point loads, it explains just three static moments of a sequentially changing stress scenario in a chewing cycle.
Recent contributions tried to overcome this issue by combining FE analysis and information on the human chewing process acquired either by using a jaw motion-capture system from live patients [20], or by simulating digitally the closing phase of the masticatory cycle. The latter was done by moving vertically upwards and medially the lower molar toward the upper molar to achieve maximum intercuspation [21].
Despite the obvious merits (e.g., more realistic simulations), these approaches are based on patient teeth, which impose several crucial limitations: 1) often only the external surface of the crown and not the entire tooth morphology is considered (e.g. [20]); 2) the low resolution of the underlying image data to build a volumetric mesh or coarse resolution of the volumetric mesh itself (e.g. [21]); 3) the boundary conditions, which are applied on the tooth itself and thus can lead to unrealistic local stresses (e.g. [21]). Alternatively, the complete cranium or mandible is considered [22–24], but again to the detriment of volumetric mesh resolution and dental structure accuracy. In general, most contributions developed so far, which combine FE analysis and dynamic loading conditions, do not employ high resolution models to accurately identify the changes in occlusal contact areas during the simulation. Yet, these are needed to assess the force distribution on the tooth surface with cascading effects on stress/strain distributions in the whole tooth and dental supporting tissues.
In this contribution we used the full individual kinematic pathway reconstructed and recorded in a virtual environment during the power stroke (i.e., the trajectory of the mandibular molar relative to its antagonist) to run a non-linear dynamic FE crash colliding test in a high resolution digital model of the upper and lower first molars and their dental supporting tissues. To our knowledge this approach provides the most realistic simulation of how chewing forces are distributed over the tooth surface, which is fundamental for an accurate evaluation of the stresses and strains occurring in teeth and dental supporting tissues under physiological loading conditions.
Materials and Methods
Micro-Computed Tomography Scanning, Segmentation and 3D Reconstruction
In 2011, the skull of a young adult female (ID = S23) selected from the archaeological skeletal sample collected by Rudolf Poech in South Africa in 1907–1909 [25], currently stored at the Department of Anthropology of the University of Vienna, was micro-CT scanned at the Vienna Micro-CT Lab, Department of Anthropology, University of Vienna, with a Viscom X8060 μCT (scan parameters: 130kV, 100 mA). Volume data were reconstructed using isometric voxels of 60μm.
The micro-CT image data was cropped mesially and distally to the socket of the right mandibular and maxillary first molar (RM1 and RM1, respectively) to reduce the size of the digital models. Segmentation of the dental and bone tissues (enamel, dentine, pulp, trabecular and cortical bone) was carried out in Avizo 7 (Visualization Sciences Group Inc.). The cementum was modeled as a 0.135 mm and 0.195 mm thick layer that envelops the external root surface of the lower and upper molars, respectively (average cementum thickness from [26] (Fig 1). The periodontal ligament (PDL) was created by filling the gap between the cementum and the alveolar socket, thus varying in thickness (Fig 1). Moreover, a layer of 0.1 mm was created between enamel and dentine [27] to reflect the cushioning zone between the two tissues (enamel-dentine junction, hereafter called EDJ), following recent findings that highlight the importance of this layer to accommodate mechanical stresses [14, 28, 29]. The final refinement of the digital model (i.e., triangles optimization) was carried out in Geomagic Studio 2012 (Geomagic, Inc) (Fig 1A).
Fig 1. Digital models of the upper and lower first molars.
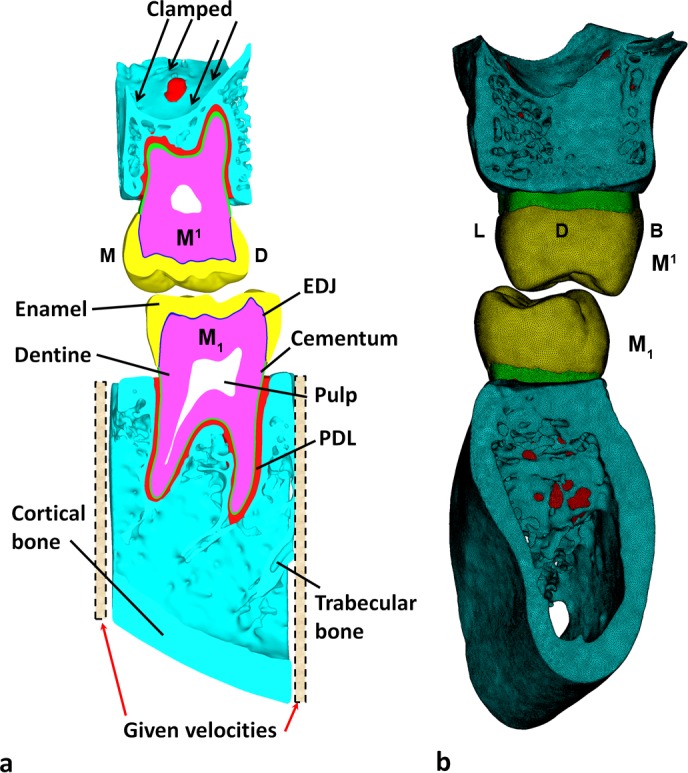
a) Segmented model of lower right first molar (M1, bottom) and upper right first molar (M1, top). Section is through the mesio-distal axis of the teeth. b) FE mesh in distal view. PDL = periodontal ligament; EDJ = Enamel-dentine junction. B = buccal; D = distal; L = lingual; M = mesial.
In order to define an orientation system for the digital models, the best-fit plane through the cervical outline at the enamel-cementum junction (i.e., cervical plane) of the RM1 was computed in Geomagic Studio 2012. The RM1 was aligned with the cervical plane parallel to the xy-plane of the Cartesian coordinate system and rotated around the z-axis, so that the mesial side was parallel to the y-axis (Fig 2) [15].
Fig 2. Occlusal view of the oriented lower right first molar (RM1).
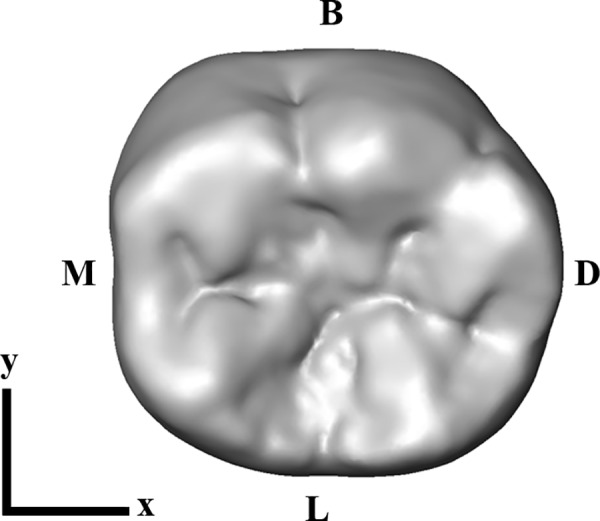
The tooth is aligned with the cervical plane parallel to the xy-plane of the Cartesian coordinate system, and the mesial side parallel to the y-axis. B = buccal; D = distal; L = lingual; M = mesial.
Occlusal Kinematics
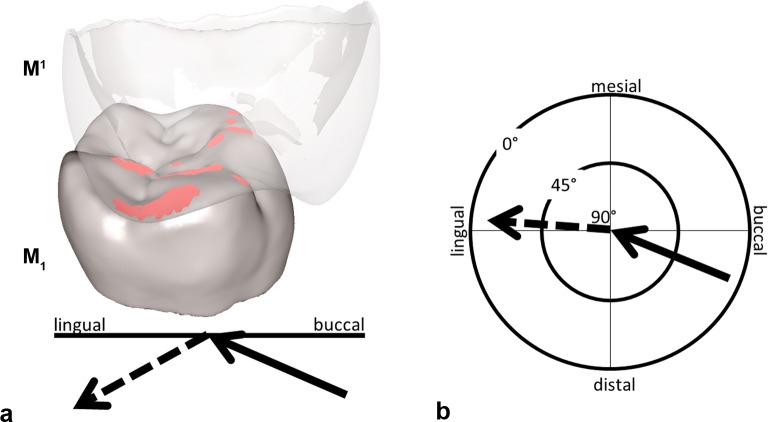
The dental surface models of the RM1/RM1 were imported into the OFA software and the RM1 was adjusted in maximum intercuspation position on the oriented RM1. Following general knowledge about functional anatomy and biomechanics of mastication [30], an assumed pathway for the power stroke was set for the lower molar coming from distobuccally upward and slightly anteriorly until maximum intercuspation, and then downward towards slightly mesiolingually. Thanks to collision detection, deflection and break free algorithms implemented in the OFA software, one model is allowed to move against the other, ultimately providing a kinematic analysis of the surface contacts between RM1 and RM1 during the power stroke [15]. In detail, after having set a starting point and an endpoint for the movements, as soon as the lower and upper teeth collide, the travelling model (RM1) is deflected and guided by the antagonistic crown relief producing its individual power stroke trajectory. Contact areas are marked in different colors and the occlusal pathway trajectory is recorded, informing on the occlusal movements during the incursive (phase I) and excursive (phase II) of the power stroke (Fig 3A and 3B; S1 Video). The calculated collisions were compared to the wear facets (macrowear pattern) present on the occlusal surface of the real tooth in order to verify the accuracy of the generated trajectory. The starting and endpoints of the trajectory calculation were repeated three times until the resulting collisions matched with the functional macrowear pattern on the original specimen. The verified individuals`pathway trajectory was exported as a list of Cartesian coordinates (x,y,z) and used in the FE software to guide the RM1 in the crash colliding test.
Fig 3. Collision detection for RM1 with the antagonist RM1 in the Occlusal Fingerprint Analyser software (OFA) during maximum intercuspation contact.
a) The RM1 is transparent to show the collision (red areas) in the occlusal surface of the RM1; the recorded power stroke pathway trajectory of the RM1 (summarized by the two arrows) is subdivided into an incursive (black arrow = phase I) and an excursive (dashed arrow = phase II) vector. b) The mastication compass visualizes the spatial orientation of phase I and II. The length of the two arrows informs about the inclination angle (after [31]).
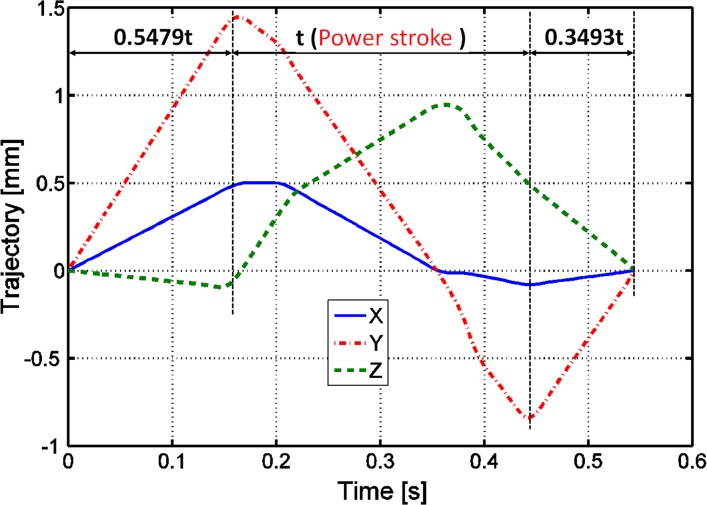
The OFA software allows for recording the occlusal pathway trajectory (or power stroke, i.e. phase I and phase II), but the duration of the chewing cycle (i.e., closing phase + power stroke + opening phase) is automatically, yet unphysiologically determined by the software [19]. Therefore, we used information gathered from the literature to calibrate the duration of each of the phases of the chewing cycle. Specifically, modern human jaw movements recorded with a magnet-sensing jaw-tracking system suggest that the power stroke may last about 289 ms (measured from [30]; his Fig 1–15). Since in the OFA simulation the closing and opening phases were computed to be 0.5479 and 0.3493 times the power stroke, respectively (Fig 4), we estimated a total movement time of 548.311ms.
Fig 4. The trajectory of the power stroke.
Trajectory (x-, y- and z-axes) obtained for the RM1 during the chewing cycle (i.e., close + power stroke + open) in the OFA software scaled to the duration of the power stroke (t = 289 ms).
Volumetric Mesh Generation and FE Analysis
The surface models were imported into HyperWorks Software (Altair Engineering, Inc.), where volumetric meshes were created (Fig 1B). Two simulations with 4-noded 2,846,131 tetrahedral elements (hereafter called “coarse” mesh) and 8,832,739 tetrahedral elements (hereafter called “fine” mesh), respectively, were carried out to verify the convergence of the results. For the hard tissues (enamel, dentine, EDJ, cementum, bone), tetrahedral elements with 6 rotational and translational degrees of freedom (DOF) at each node were used [32], hence improving accuracy of the simulation. For the soft tissues (pulp, PDL) each node had 3 DOFs and tetrahedral elements with constant pressure formulation for incompressible material were used. The number of elements arranged across the 0.15–0.85 mm PDL thickness varies between 2 and 8, accordingly. Only a single layer of elements was arranged across the 0.1 mm thick EDJ. Adaptive meshes were not required to capture the thin geometric features of PDL and EDJ, because in both cases the mesh size satisfied the mesh quality requirements (e.g., warpage, aspect ratio).
Material property values (elastic modulus E, Poisson’s ratio and density ν) were collected from the literature (Tables 1 and 2). The same mechanical properties and density were used for cortical and trabecular bone (hereafter called “bone”), following the suggestion by Hall [43].
Table 1. Elastic properties of isotropic materials.
| Material | E (GPa) c | Poisson's ratio | References |
|---|---|---|---|
| Enamel | 84.1 | 0.3 | [33] |
| Dentine | 24.5 | 0.31 | [34] |
| EDJa | 51.35 | 0.3 | Average between enamel and dentine |
| Pulp | 0.002 | 0.45 | [35] |
| Cementum | 15.5 | 0.31 | [34] |
| PDLb | 0.0689 | 0.45 | [36] |
| Bone (cortical and trabecular) | 13.7 | 0.3 | [37] |
aEnamel-dentine junction
bPeriodontal ligament
cElastic modulus
Table 2. Density of tissues (ρ) and speed of sound (Vsound).
For the EDJ, E and ν were computed as the average values between enamel and dentine [14]. All materials were considered homogeneous, linearly elastic and isotropic, which is an evident simplification but it is comparable with current studies in dental biomechanics [44].
Regarding the boundary constraints, the superior surface of the maxilla was totally fixed in X, Y and Z directions, as during mastication the maxillary bone does not move. In contrast, since the mandible moves during mastication and is subjected to torsional loading and sagittal bending [45, 46], for all the surface nodes of the mesial and distal surfaces of the mandible section the velocities calculated in X, Y and Z directions were imposed simultaneously (see below for details about the velocity).
The explicit scheme was used to solve the governing equations [47]. This method is efficient for highly non-linear problems, especially when dealing with complex contacts and large deformations. Moreover, it is particularly reasonable for FE models with several million elements, for which the implicit scheme has problems with computational cost, convergence or contact failure [48].
In FE non-linear simulations, the movement time (see above) is subdivided in multiple time steps (∆t), which should be small to guarantee 1) a linearly approximated behavior of the structure and 2) a stability of algorithm. In general, ∆t is automatically calculated by the software. The initial default value is ∆t = 2.1E-09s, but to save computational time ∆t was scaled to 5.0E-08s for the open and close phases (mass scaling, i.e. the software increases the density of the components of the model; see [49]). The default ∆t assigned by HyperWorks was used for the power stroke.
While the time scaling (i.e., increasing velocity) does not affect the linear elastic material used for the FE models (i.e., there is no strain rate dependency), high scaled velocity may introduce nonrealistic dynamic effects that can alter the accuracy of the solution. However, limiting scaled velocity to less than 1% of the wave speed in the simulated materials does not affect significantly the accuracy [49]. After several trials with different scaling factors (145, 100, 80, 60 and 50), the time scaling factor was set to Fsc = 50, because it assured the smallest acceptable kinetic energy in the closing phase. The maximum velocity after scaling was still smaller than 1% speed of sound (Vsound) of pulp tissue (Table 2), the latter was computed following [42]:
| (1) |
where E = Young’s modulus (MPa), v = Poisson’s ratio and ρ = density (kg/mm3).
Moreover, we introduced a diagonal damping matrix C, proportional to mass matrix M, in the dynamic equation to damp spurious oscillations:
| (2) |
| (3) |
where: K is the stiffness matrix; the time-dependent vectors u(t), (t) and ü(t) are nodal displacements, velocities and accelerations, respectively; F(t) is time-dependent external load vector; B is the relaxation value (default value 1); T is the period to be damped (imposing T = 0.0035s, close to the highest frequency of the model from PDL).
The direct integration method used in the HyperWorks solver package is derived from Newmark time integration scheme. Velocity and displacement at time tn+1 = tn + Δt are calculated:
| (4) |
| (5) |
The integration scheme used by HyperWorks’ solver RADIOSS is based on the central difference integration algorithm with coefficients β = 0 and γ = 0.5. It is conditionally stable when the time step Δt is small enough to integrate accurately the response in the highest frequency component.
A penalty type formulation [32], which is accounted for by the type 7 interface of HyperWorks software, allows sliding between a master surface (occlusal surface of the M1 enamel) and a set of slave nodes (occlusal surface of the M1 enamel). This interface has spring stiffness when a slave node penetrates the interface gap. At a contacted node the elastic contact force has two components: normal and tangent. The normal component of the contact force is a function of contact-related parameters as:
| (6) |
with
- g is the gap value (i.e., to determine when contact between slave nodes and master surface occurs), which by default was defined by the software HyperWorks as one tenth of the smallest side of all master element segments (g = 6.636E-03 mm);
- p is the penetration of a slave node into a master segment (g ≥ p ≥ 0). Penetration is checked in each time step of the power stroke. When a penetration is registered, the force proportional to the penetration depth (6) is applied to resist the penetration;
- K is the interface spring stiffness: K = min(Km, KS, Kmin).
The master stiffness is computed as ;
The slave stiffness is an equivalent nodal stiffness computed as ;
Minimum stiffness is Kmin = 84100, equal to Young’s modulus of enamel.
In the above formulae StFAC = 1 (stiffness factor); Bu is the bulk modulus of enamel material; S is the master element area; V is the master element volume. Overall, the interface spring stiffness is related to material parameters, ultimately favoring the efficacy of the penalty method, because the stiffness of contacting enamels has the same order of magnitude.
We introduced a Coulomb friction law, using a friction coefficient μ = 0.2, a value found for wet conditions [50]. The tangent component of the contact force is then calculated as:
| (7) |
A nodal contact force is the resultant force of a normal component (6) and a tangent component (7). Summation of contact forces at each node produced by the enamel contact interface provides the contact force between the lower and upper enamel caps, which is equivalent to the chewing force. During the power stroke values of the chewing force are changing according to the changes of contact area size and spatial position between enamel caps. Therefore, the power stroke chewing force is time dependent, whereas in both the closing and opening phase the chewing force is equal to zero.
Gravity force was constantly applied on all parts of the model, even though we observed that gravity effect is not important for this simulation.
Results for were qualitatively and quantitatively evaluated according to the first maximum principal stresses criterion for brittle materials (as stress wave propagation is fundamental to investigate dynamic effects of chewing load on materials) [51, 52], but for the PDL (i.e., soft tissue) the first principal strain was evaluated.
Sensitivity of FE Methodology
When experimental data are not available, fundamental checks should be undertaken to reduce the error of the explicit simulation (S1–S5 Figs). First, the mesh size of the FE model must be fine (namely small) to prevent unphysical stress even when the velocity is high. To address this issue, the average mesh size value is h (height) = 0.13mm, with a total number of 8,832,739 tetrahedral elements. Second, the quality of the simulation’s results was estimated through the evaluation of the 1) energy balance (S1 Fig); 2) ratio of kinetic energy to internal energy (S2 Fig); and 3) time history of kinetic energy, internal energy and contact energy [48] (S1 Text). Moreover, differences between the two simulations (using the “coarse” and “fine” meshes, respectively) were <5% for displacement (S3 Fig) and internal energy (S4 Fig), confirming the convergence of the results. Only results obtained using the “fine” mesh are reported below.
Results
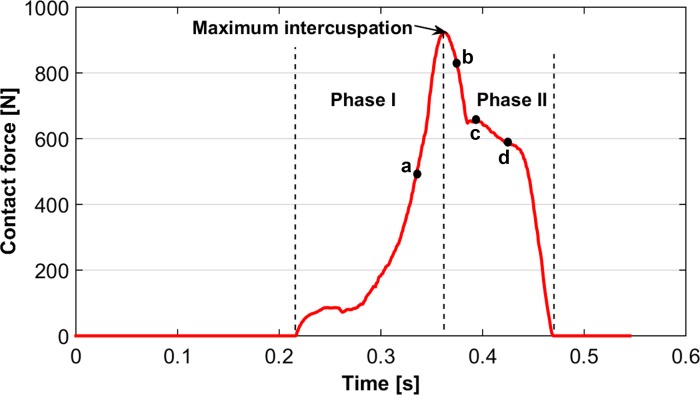
The maximum contact force achieved by solving the system is 923N (Fig 5). The force increased during phase I, reaching its greatest magnitude during maximum intercuspation contact. Even though the force reduced during phase II, values remained relatively high (Fig 5).
Fig 5. Contact forces (N) obtained during the non-linear dynamic FE crash colliding test.
The four points in the plot correspond to the time steps at 0.335s (a), 0.375s (b), 0.394s (c) and 0.425s (d) discussed in the text and in Figs 8 and 9.
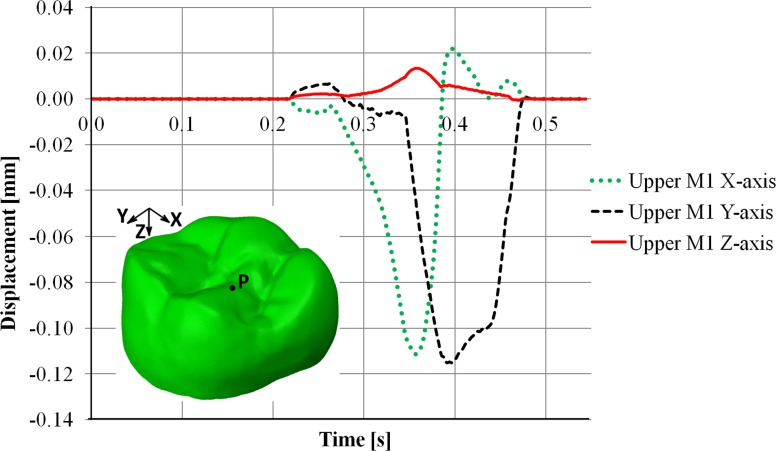
The displacements of the RM1 and RM1 along x-, y- and z-axes are summarized in Figs 6 and 7, respectively. For the RM1, the larger contact areas on the lingual cusps displaced the tooth mainly in the negative direction of the x- and y-axes, i.e. mesiolingually (Fig 6; S2 Video).
Fig 6. Displacement of the RM1.
Displacement at a point (P), randomly selected in the occlusal surface of the RM1, during the non-linear dynamic FE crash colliding test. Note that the x-axis corresponds to the mesiodistal direction, the y-axis to the buccolingual direction and the z-axis to the crown-root direction.
Fig 7. Displacement of the RM1.
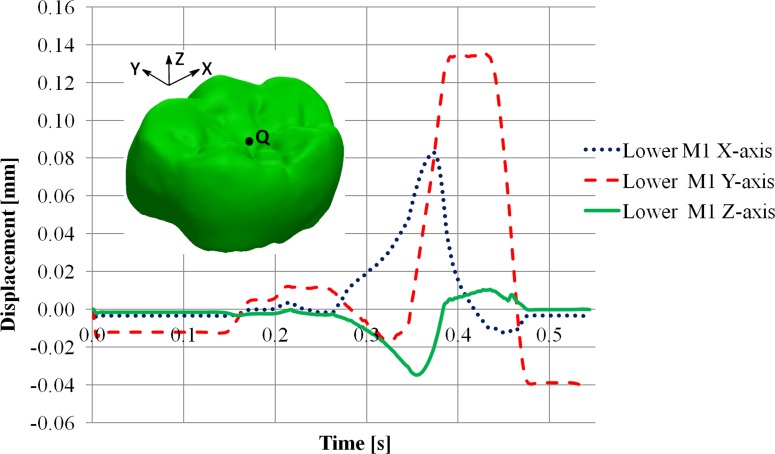
Displacement at a point (Q), randomly selected in the occlusal surface of the RM1, during the non-linear dynamic FE crash colliding test. Note that the x-axis corresponds to the mesiodistal direction, the y-axis to the buccolingual direction and the z-axis to the crown-root direction.
Due to dynamic effects the displacements of the RM1 during the closing and opening phases are different from zero. However, during the power stroke the dynamic effects were constrained by contacts between antagonists, and the RM1 displaced in the positive direction of the x- and mainly y-axes, i.e. distobuccally (Fig 7).
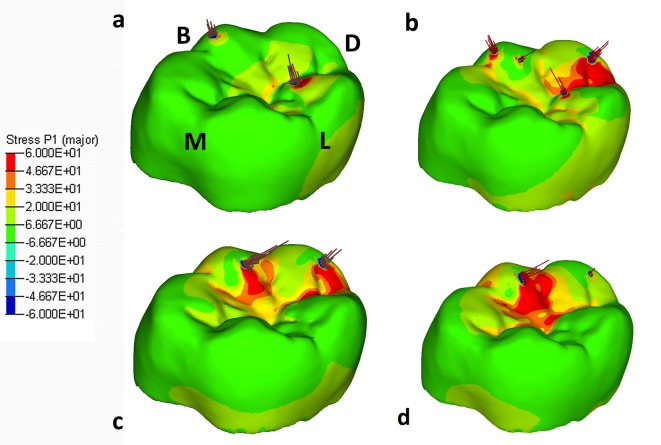
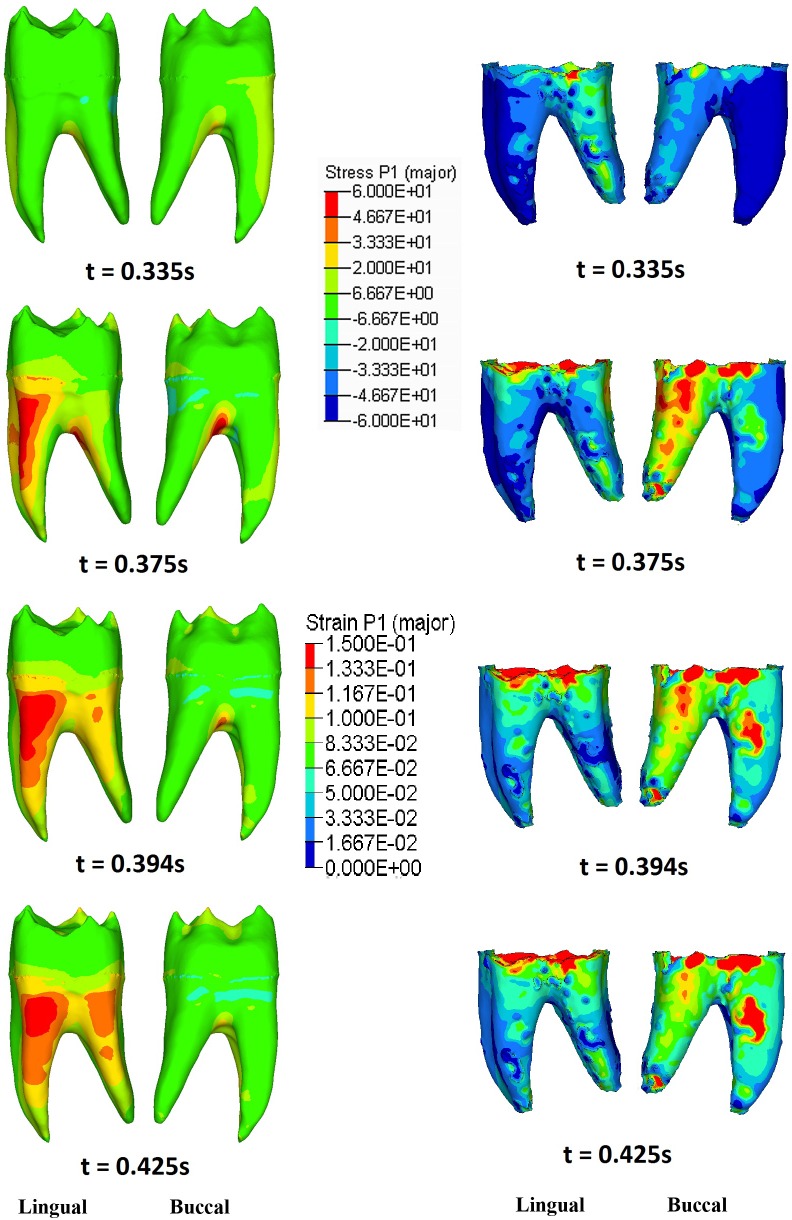
The distribution of maximum principal stresses on the enamel followed the same pattern for both RM1 and RM1. Contact pressure causes tensile stresses concentrated in the grooves of the occlusal surface, and their magnitude and area of interest reached its peak during maximum intercuspation (Fig 8; S3 Video). At mid-time of the power stroke (t ≈ 0.375s) the RM1 is mostly moving in the negative direction of the y-axis, causing high contact pressure and a sudden increase of tensile stresses on the distal cusps (mainly the hypoconulid), affecting also the grooves that surround these cusps (Fig 8B). As a consequence, tensile stresses increased also in the mesiolingual wall of the root (Fig 9) and, to a lower extent, in the superior alveolar margin of the mandible (S6 Fig; S3 Video). In the PDL tensile strains were highest in the distobuccal region (Fig 9).
Fig 8.
The maximum principal stress distribution observed in RM1 at 0.335s (a), 0.375s (b), 0.394s (c) and 0.425s (d). See Fig 5 for the corresponding times during the power stroke. Arrows on the enamel are elemental contact forces. B = buccal; D = distal; L = lingual; M = mesial.
Fig 9. The maximum principal stress distribution observed in RM1 dentine (left) and the maximum principal strain distribution observed in RM1 PDL (right) at 0.335s, 0.375s, 0.394s and 0.425s.
See Fig 5 for the corresponding times during the power stroke.
Towards the end of the closing cycle, the RM1 continues moving in the negative direction of the y-axis, leading to maximum contact pressure on the hypoconid (at t ≈ 0.425s). Consequently, tensile stresses increased in the occlusal basin of the crown (Fig 8), in the lingual aspect of the root (Fig 9) and, more generally, in the upper half of the cortical bone of the mandible (S6 Fig). As far as the PDL is concerned, tensile strains remained higher in the buccal side than in the lingual one (Fig 9).
Discussion and Conclusions
Currently, most of the FE simulations of teeth are limited to static loading conditions [7, 12, 13, 53], which reflect only a partial view of the dental hard and soft tissues’ functional response. Few studies combine FE methods and dynamic loading conditions [19, 20], but the analyses were restricted to coarse volumetric meshes that simplify the complex dental architecture and, importantly, did not envision the physiological sequential changes of occlusal contacts occurring during the power stroke. Yet, this information is pivotal to simulate realistic loading conditions.
The dynamic approach presented here is the logical advance following recent contributions that combined FE methods and occlusal macrowear analysis using high resolution digital models of teeth and dental supporting tissues [14, 15, 53, 54]. Using a non-linear dynamic FE crash colliding test based on the trajectory computed in the OFA software, we were able to compute tensile stresses and displacements of the FE models during the complete power stroke. The maximum contact force registered solving the system (923N) is in agreement with maximum values obtained during in vivo bite force measurements [55–58]. Moreover, our findings support previous FE studies that suggest both the importance of the PDL for load transfer to the alveolar wall [59] and the increase of tensile stresses in the upper half of the mandible, mainly in the lingual side [53].
This approach will be very useful in research pertaining to clinical dentistry, because the individual direction and position of occlusal forces are important factors for, e.g., estimating the long-term success of dental and endodontic treatments, dental implant designs, dental prostheses. A precise and individual occlusal surface reconstruction is crucial for a functional and balanced stress distribution in the dental arches with an optimum chewing efficiency, during the maintenance phase for patients with periodontitis, as well as for an understanding of the etiology of some very common dental pathologies, such as non-carious cervical lesions and abnormal tooth wear [60–62]. Moreover, our dynamic approach will enhance interpretations of investigative results related to evolutionary biology of teeth, e.g. to unravel the adaptive processes and significance of dental and resulting masticatory variations in respect to the development of various dental features, e.g. such as protostylid and mid-trigonid crests as well as enamel thickness and root shape.
It is important to note that the large size of the FE models (which is pivotal to maintain a detailed representation of the various tissues) and the complex computation to solve the non-linear equations require powerful computer facilities and is very time consuming. We are confident, however, that future technological advancements will address this practical issue, ultimately making the entire process less demanding and allowing us to implement food items between the occlusal surfaces in the simulation as well. Ultimately, experimentally derived in vitro or in vivo data on tooth function are required to substantiate our findings.
Supporting Information
The ratio between the total energy of the system and the initial total energy and the external energy.
(TIF)
(TIF)
Comparison of the displacement values between coarse mesh and fine mesh at a single point (P), randomly selected in the occlusal surface of the RM1, during the non-linear dynamic FE crash colliding test. Note that the x-axis corresponds to the mesiodistal direction, the y-axis to the buccolingual direction and the z-axis to the crown-root direction.
(TIF)
(TIF)
(TIF)
See Fig 5 for corresponding times during the power stroke.
(TIF)
Verification of FE methodology.
(DOC)
Simulation of the individual occlusal “power stroke” of the right mandibular and maxillary first molar applying the Occlusal Fingerprint Analyser (OFA) software.
(AVI)
Displacement of the RM1 during the non-linear dynamic FE crash colliding test.
(AVI)
The distribution of maximum principal stresses in the RM1 during the non-linear dynamic FE crash colliding test.
(AVI)
Acknowledgments
The authors thank the Vienna micro-CT Lab (University of Vienna, Austria) for micro-CT scanning of the modern human skull. We are grateful to Johannes Schöneich for help with the CT segmentation. This research was supported by the Max Planck Society and the German Science Foundation (DFG). This is publication no 84 of the DFG Research Unit 771 “Function and performance enhancement in the mammalian dentition—phylogenetic and ontogenetic impact on the masticatory apparatus”.
Data Availability
All relevant data are within the paper and its Supporting Information files.
Funding Statement
This research was supported by the Max Planck Society and the German Science Foundation (DFG). The funders had no role in study design, data collection and analysis, decision to publish, or preparation of the manuscript.
References
- 1.Prombonas A, Vlissidis D. Effects of the position of artificial teeth and load levels on stress in the complete maxillary denture. J Prosthet Dent. 2002; 88: 415–22. [DOI] [PubMed] [Google Scholar]
- 2.Natali AN. Dental biomechanics London: Taylor & Francis; 2003. [Google Scholar]
- 3.Macho GA, Spears IR. Effects of loading on the biochemical behaviour of molars of Homo, Pan, and Pongo. Am J Phys Anthropol. 1999; 109: 211–227. [DOI] [PubMed] [Google Scholar]
- 4.Barak MM, Geiger S, Chattah NLT, Shahar R, Weiner S. Enamel dictates whole tooth deformation: a finite element model study validated by a metrology method. J Struct Biol. 2009; 168: 511–520. 10.1016/j.jsb.2009.07.019 [DOI] [PubMed] [Google Scholar]
- 5.Chattah NLT, Kupczik K, Shahar R, Hublin J-J, Weiner S. Structure–function relations of primate lower incisors: a study of the deformation of Macaca mulatta dentition using electronic speckle pattern interferometry (ESPI). J Anat. 2011; 218: 87–95. 10.1111/j.1469-7580.2010.01234.x [DOI] [PMC free article] [PubMed] [Google Scholar]
- 6.Kupczik K, Stynder DD. Tooth root morphology as an indicator for dietary specialization in carnivores (Mammalia: Carnivora). Biol J Linn Soc. 2012; 105: 456–471. [Google Scholar]
- 7.Kupczik K, Chattah NLT. The adaptive significance of enamel loss in the mandibular incisors of cercopithecine primates (Mammalia: Cercopithecidae): a finite element modelling study. PloS One 2014; 9: e97677 10.1371/journal.pone.0097677 [DOI] [PMC free article] [PubMed] [Google Scholar]
- 8.Cheng YY, Li JY, Fok SL, Cheung WL, Chow TW. 3D FEA of high-performance polyethylene fiber reinforced maxillary dentures. Dent Mater. 2010; 26: 211–219. [DOI] [PubMed] [Google Scholar]
- 9.Fu G, Deng F, Wang L, Ren A. The three-dimension finite element analysis of stress in posterior tooth residual root restored with postcore crown. Dent Traumatol. 2010; 26: 64–69. 10.1111/j.1600-9657.2009.00829.x [DOI] [PubMed] [Google Scholar]
- 10.Macho GA, Shimizu D, Jiang Y, Spears IR. Australopithecus anamensis: a finite-element approach to studying the functional adaptations of extinct hominins. Anat Rec A Discov Mol Cell Evol Biol. 2005; 283: 310–8. [DOI] [PubMed] [Google Scholar]
- 11.Berthaume M, Grosse IR, Patel ND, Strait DS, Wood S, Richmond BG. The effect of early hominin occlusal morphology on the fracturing of hard food items. Anat Rec. 2010; 293: 594–606. [DOI] [PubMed] [Google Scholar]
- 12.Benazzi S, Nguyen HN, Schulz D, Grosse IR, Gruppioni G, Hublin J-J, et al. The Evolutionary Paradox of Tooth Wear: Simply Destruction or Inevitable Adaptation? PLoS One 2013; 8: e62263 10.1371/journal.pone.0062263 [DOI] [PMC free article] [PubMed] [Google Scholar]
- 13.Benazzi S, Nguyen HN, Kullmer O, Hublin J-J. Unravelling the functional biomechanics of dental features and tooth wear. PLoS One 2013; 8: e69990 10.1371/journal.pone.0069990 [DOI] [PMC free article] [PubMed] [Google Scholar]
- 14.Benazzi S, Nguyen HN, Kullmer O, Hublin J-J. Exploring the biomechanics of taurodontism. J Anat. 2015; 226: 180–8. 10.1111/joa.12260 [DOI] [PMC free article] [PubMed] [Google Scholar]
- 15.Benazzi S, Kullmer O, Grosse I, Weber G. Using occlusal wear information and finite element analysis to investigate stress distributions in human molars. J Anat. 2011; 219: 259–72. 10.1111/j.1469-7580.2011.01396.x [DOI] [PMC free article] [PubMed] [Google Scholar]
- 16.Jiang W, Bo H, YongChun G, LongXing N. Stress distribution in molars restored with inlays or onlays with or without endodontic treatment: A threedimensional finite element analysis. J Prosthet Dent. 2010; 103: 6–12. 10.1016/S0022-3913(09)60206-7 [DOI] [PubMed] [Google Scholar]
- 17.Vukicevic AM, Zelic K, Jovicic G, Djuric M, Filipovic N. Influence of dental restorations and mastication loadings on dentine fatigue behaviour: Image-based modelling approach. J Dent. 2015; 43:556–67. 10.1016/j.jdent.2015.02.011 [DOI] [PubMed] [Google Scholar]
- 18.Zelic K, Vukicevic A, Jovicic G, Aleksandrovic S, Filipovic N, Djuric M. Mechanical weakening of devitalized teeth: three-dimensional Finite Element Analysis and prediction of tooth fracture. Int Endod J. 2015; 48:850–63. 10.1111/iej.12381 [DOI] [PubMed] [Google Scholar]
- 19.Kullmer O, Benazzi S, Schulz D, Gunz P, Kordos L, Begun DR. Dental arch restoration using tooth macrowear patterns with application to Rudapithecus hungaricus, from the late Miocene of Rudabánya, Hungary. J Hum Evol. 2013; 64:151–60. 10.1016/j.jhevol.2012.10.009 [DOI] [PubMed] [Google Scholar]
- 20.Pascale AM, Ruge S, Hauth S, Kordaß B, Linsen L. Chewing simulation with a physically accurate deformable model. Int J Comput Dent. 2015;18: 237–58. [PubMed] [Google Scholar]
- 21.Dejak B, Młotkowski A. A comparison of stresses in molar teeth restored with inlays and direct restorations, including polymerization shrinkage of composite resin and tooth loading during mastication. Dent Mater. 2015; 31:e77–87. 10.1016/j.dental.2014.11.016 [DOI] [PubMed] [Google Scholar]
- 22.Kupczik K, Dobson CA, Crompton RH, Phillips R, Oxnard CE, Fagan MJ, O'Higgins P. Masticatory loading and bone adaptation in the supraorbital torus of developing macaques. Am J Phys Anthrop. 2009; 139: 193–203. 10.1002/ajpa.20972 [DOI] [PubMed] [Google Scholar]
- 23.Commisso MS, Martínez-Reina J, Ojeda J, Mayo J. Finite element analysis of the human mastication cycle. J Mech Behav Biomed Mater. 2015; 41: 23–35. 10.1016/j.jmbbm.2014.09.022 [DOI] [PubMed] [Google Scholar]
- 24.Park JC, Shin HS, Cha JY, Park JT. A three-dimensional finite element analysis of the relationship between masticatory performance and skeletal malocclusion. J Periodontal Implant Sci. 2015; 45: 8–13. 10.5051/jpis.2015.45.1.8 [DOI] [PMC free article] [PubMed] [Google Scholar]
- 25.Pacher HM. Anthropologische Untersuchungen an den Skeletten der Rudolf Pöch'schen Buschmannsammlung Vol.1.: Herkunft des Sammlungsgutes, Maßbefunde und Lichtbilder der Schädel. Series: Rudolf Pöchs Nachlass, Subseries A: Physical Anthropology Vol. XII, Hermann Böhlaus Nachf., Kommissionsverlag der Österreichische Akademie der Wissenschaften, Graz—Wien -Köln, 1961. [Google Scholar]
- 26.Stamfelj I, Vidmar G, Cvetko E, Gaspersic D. Cementum thickness in multirooted human molars: A histometric study by light microscopy. Ann Anat. 2008; 190: 129–139. 10.1016/j.aanat.2007.10.006 [DOI] [PubMed] [Google Scholar]
- 27.Marshall GW Jr, Balooch M, Gallagher RR, Gansky SA, Marshall SJ. Mechanical properties of the dentinoenamel junction: AFM studies of nanohardness, elastic modulus, and fracture. J Biomed Mater Res. 2001; 54: 87–95. [DOI] [PubMed] [Google Scholar]
- 28.Zaslansky P, Friesem AA, Weiner S. Structure and mechanical properties of the soft zone separating bulk dentin and enamel in crowns of human teeth: Insight into tooth function. J Struct Biol. 2006; 153: 188–199. [DOI] [PubMed] [Google Scholar]
- 29.Zaytsev D, Panfilov P. Deformation behavior of human enamel and dentin-enamel junction under compression. Mater Sci Eng C Mater Biol Appl. 2014; 34: 15–21. 10.1016/j.msec.2013.10.009 [DOI] [PubMed] [Google Scholar]
- 30.Hylander WL. Functional anatomy and biomechanics of the masticatory apparatus In: Laskin JL, Greene CS, Hylander WL, editors. Temporomandibular Disorders: An Evidenced Approach to Diagnosis and Treatment. New York: Quintessence; 2006. pp. 3–34. [Google Scholar]
- 31.von Koenigswald W, Anders U, Engels S, Schultz JA, Kullmer O. Jaw movement in fossil mammals: analysis, description and visualization. Paläontologische Zeitschrift 2013; 87: 141–159. [Google Scholar]
- 32.Radioss theory manual. Version 13.0 –Jan 2014. http://www.altairhyperworks.com/hwhelp/Altair/hw13.0/help/hwsolvers/hwsolvers.htm?rd_theorymanual.htm
- 33.Magne P. Efficient 3D finite element analysis of dental restorative procedures using micro-CT data. Dent Mater. 2007; 23: 539–548. [DOI] [PubMed] [Google Scholar]
- 34.Ho SP, Marshalla SJ, Ryderb MI, Marshall GW. The tooth attachment mechanism defined by structure, chemical composition and mechanical properties of collagen fibers in the periodontium. Biomaterials 2007; 28: 5238–5245. [DOI] [PMC free article] [PubMed] [Google Scholar]
- 35.Rubin C, Krishnamurthy N, Capilouto E, Yi H. Stress analysis of the human tooth using a three-dimensional finite element model. J Dent Res. 1983; 62: 82–86. [DOI] [PubMed] [Google Scholar]
- 36.Holmes DC, Diaz-Arnold AM, Leary JM. Influence of post dimension on stress distribution in dentin. J Prosthet Dent. 1996; 75: 140–147. [DOI] [PubMed] [Google Scholar]
- 37.Ko CC, Chu CS, Chung KH, Lee MC. Effects of posts on dentin stress distribution in pulpless teeth. J Prosthet Dent. 1992; 68: 421–427. [DOI] [PubMed] [Google Scholar]
- 38.Duck FA. Physical Properties of Tissue—A Comprehensive Reference Book. York: Academic Press; 1990. [Google Scholar]
- 39.IT'IS (The Foundation for Research on Information Technologies in Society): Tissue properties http://www.itis.ethz.ch/virtual-population/tissue-properties/database/density/ (access September 2014).
- 40.Weidmann SM, Weatherell JA, Hamm SM. Variations of enamel density in sections of human teeth. Arch Oral Biol. 1967; 12: 85–97. [DOI] [PubMed] [Google Scholar]
- 41.Shen LK, Huang HM, Yu JJ, Lee SY, Lee CM, Hsieh SC. Effects of periodontal bone loss on the natural frequency of the human canine: a three-dimensional finite element analysis. J Dent Sci. 2009; 4: 81−86. [Google Scholar]
- 42.Trujillo L, Torres V, Peniche F, Sigalotti LG. Towards a Mathematical Model for Elastic Wave Propagation in Granular Materials. Eng. 2012; 4: 972–979. [Google Scholar]
- 43.Hall BK. Bone: Bone Growth, Volume 7 Bosa Roca (USA): Taylor & Francis Inc, 1992. [Google Scholar]
- 44.McCormack SW, Witzel U, Watson PJ, Fagan MJ, Gröning F. The biomechanical function of periodontal ligament fibres in orthodontic tooth movement. PLoS One 2014; 9: e102387 10.1371/journal.pone.0102387 [DOI] [PMC free article] [PubMed] [Google Scholar]
- 45.Daegling DJ, Hylander WL. Biomechanics of torsion in the human mandible. Am J Phys Anthropol 1998; 105:73–87. [DOI] [PubMed] [Google Scholar]
- 46.Daegling DJ, Hotzman JL. Functional significance of cortical bone distribution in anthropoid mandibles: an in vitro assessment of bone strain under combined loads. Am J Phys Anthropol 2003; 122: 38–50. [DOI] [PubMed] [Google Scholar]
- 47.Zienkiewicz OC, Taylor RL. The Finite Element Method for Solid and Structural Mechanics—Sixth edition. Oxford: Elsevier; 2005. [Google Scholar]
- 48.Hughes K, Gulavani O, De Vuyst T, Vignjevic R. Explicit dynamic formulation to demonstrate compliance against quasi-static aircraft seat certification loads (CS25.561)–Part II: influence of body block, Proceedings of the Institution of Mechanical Engineers. Part G: J Aerosp Eng. 2014; 228: 1890–1903. [Google Scholar]
- 49.Schmidt H, Hattel J. A local model for the thermomechanical conditions in friction stir welding. Modelling Simul Mater Sci Eng. 2005; 13: 77–93. [Google Scholar]
- 50.Li H, Zhou ZR. Wear behavior of human teeth in dry and artificial saliva conditions. Wear 2001; 249: 980–984. [Google Scholar]
- 51.Field C, Li Q, Li W, Swain M. Biomechanical response in mandibular bone due to mastication loading on 3-unit fixed partial dentures. J Dent Biomech. 2010; 2010: 1–11. [DOI] [PMC free article] [PubMed] [Google Scholar]
- 52.Hasegawa A, Shinya A, Nakasone Y, Lassila LV, Vallittu PK, Shinya A. Development of 3D CAD/FEM Analysis System for Natural Teeth and Jaw Bone Constructed from X-Ray CT Images. Int J Biomater. 2010; 2010: 1–7. [DOI] [PMC free article] [PubMed] [Google Scholar]
- 53.Benazzi S, Kullmer O, Grosse I, Weber G. Brief communication: comparing loading scenarios in lower first molar supporting bone structure using 3D Finite Element Analysis. Am J Phys Anthropol. 2012; 147: 128–134. 10.1002/ajpa.21607 [DOI] [PubMed] [Google Scholar]
- 54.Benazzi S, Grosse IR, Gruppioni G, Weber GW, Kullmer O. Comparison of occlusal loading conditions in a lower second premolar using three-dimensional finite element analysis. Clin Oral Investig. 2014; 18: 369–375. 10.1007/s00784-013-0973-8 [DOI] [PubMed] [Google Scholar]
- 55.Okiyama S, Ikebe K, Nokubi T. Association between masticatory performance and maximal occlusal force in young men. J Oral Rehabil. 2003; 30: 278–82. [DOI] [PubMed] [Google Scholar]
- 56.Calderon Pdos S, Kogawa EM, Lauris JR, Conti PC. The influence of gender and bruxism on the human maximum bite force. J Appl Oral Sci. 2006; 14: 448–53. [DOI] [PMC free article] [PubMed] [Google Scholar]
- 57.de Abreu RA, Pereira MD, Furtado F, Prado GP, Mestriner WJr, Ferreira LM. Masticatory efficiency and bite force in individuals with normal occlusion. Arch Oral Biol. 2014; 59: 1065–74. 10.1016/j.archoralbio.2014.05.005 [DOI] [PubMed] [Google Scholar]
- 58.Kuninori T, Tomonari H, Uehara S, Kitashima F, Yagi T, Miyawaki S. Influence of maximum bite force on jaw movement during gummy jelly mastication. J Oral Rehabil. 2014; 41: 338–45. 10.1111/joor.12149 [DOI] [PubMed] [Google Scholar]
- 59.McCormack SW, Witzel U, Watson PJ, Fagan MJ, Gröning F. The biomechanical function of periodontal ligament fibres in orthodontic tooth movement. PLoS One. 2014; 9: e102387 10.1371/journal.pone.0102387 [DOI] [PMC free article] [PubMed] [Google Scholar]
- 60.Watanabe F, Hata Y, Komatsu S, Ramos TC, Fukuda H. Finite element analysis of the influence of implant inclination, loading position, and load direction on stress distribution. Odontology 2003; 91: 31–36. [DOI] [PubMed] [Google Scholar]
- 61.Lin TS, Huang TT, Wu JH. The effects of designs and materials of the posts on endodontically treated premolar using finite element analysis. J Med Biol Eng. 2010; 30: 79–83. [Google Scholar]
- 62.Pesqueira AA1, Goiato MC, Filho HG, Monteiro DR, Santos DM, Haddad MF, et al. Use of stress analysis methods to evaluate the biomechanics of oral rehabilitation with implants. J Oral Implantol. 2014; 40: 217–28. 10.1563/AAID-JOI-D-11-00066 [DOI] [PubMed] [Google Scholar]
Associated Data
This section collects any data citations, data availability statements, or supplementary materials included in this article.
Supplementary Materials
The ratio between the total energy of the system and the initial total energy and the external energy.
(TIF)
(TIF)
Comparison of the displacement values between coarse mesh and fine mesh at a single point (P), randomly selected in the occlusal surface of the RM1, during the non-linear dynamic FE crash colliding test. Note that the x-axis corresponds to the mesiodistal direction, the y-axis to the buccolingual direction and the z-axis to the crown-root direction.
(TIF)
(TIF)
(TIF)
See Fig 5 for corresponding times during the power stroke.
(TIF)
Verification of FE methodology.
(DOC)
Simulation of the individual occlusal “power stroke” of the right mandibular and maxillary first molar applying the Occlusal Fingerprint Analyser (OFA) software.
(AVI)
Displacement of the RM1 during the non-linear dynamic FE crash colliding test.
(AVI)
The distribution of maximum principal stresses in the RM1 during the non-linear dynamic FE crash colliding test.
(AVI)
Data Availability Statement
All relevant data are within the paper and its Supporting Information files.


