Abstract
Purpose
We present an MRI classification of benign prostatic hyperplasia (BPH) for use as a phenotype biomarker in the study of proposed therapeutic interventions.
Methods
T2 weighted magnetic resonance images were obtained at 3 Tesla in patients with suspicion of adenocarcinoma. Previous BPH classifications are reviewed, and implications for inclusion of lobar classification in therapeutic research for BPH are discussed.
Summary
Six patterns of BPH distribution were identified. Illustrations are shown for each classification type.
Introduction
In the United States, the prevalence of lower urinary tract symptoms (LUTS) is 31% to 36% in men aged 60 to 69 years and 44% in men 70 years and older [1]. Mean life expectancy worldwide is 64 years; the number of men over age 65 years (currently 380 million) is projected to increase to 680 million by 2020 [2]. The Director General of the World Health Organization reminds us “increased longevity without quality of life is an empty promise. Health expectancy is at least as important as life expectancy” [2]. Histopathologic benign prostatic hyperplasia BPH is age dependent. Early development usually occurs after age 40 years [3]; by age 60 years, its prevalence is greater than 50% and by age 85 years, it is as much as 90%. About 50% of men who have a histologic diagnosis of BPH have moderate to severe LUTS [4].
The initial assessment assigns the patient to one of two categories: mild symptoms with minimally obstructive uroflow or moderate to severe symptoms with obstructive uroflow. Medical and minimally invasive therapeutic techniques are recommended for men who have moderate to severe symptoms with abnormal uroflow whose quality of life is significantly affected and who desire treatment. The most commonly selected treatment is medical management with α-adrenergic blocking agents, 5α-reductase inhibitors or both [5,6].
Alternative therapies include thermal therapies, transurethral needle ablation using radiofrequency (RF) energy, laser or high-intensity focused ultrasound (HIFU) to shrink the enlarged lateral lobes (transition zones [TZ]) of the prostate. The details of these treatments are beyond the scope of this review [5,7].
Currently, open surgery, TURP, transurethral electrovaporization (TUEVP), and transurethral incision of the prostate are reserved for men who have moderately severe to severe symptoms with signs of obstruction and for those showing the complications of obstruction, such as renal insufficiency, urinary retention, or recurrent infection. Surgical and minimally invasive procedures are also advised in patients who do not respond to medical management [5,7].
If the initial clinical assessment discovers that the patient has a complicating disorder potentially affecting the upper urinary tract, imaging (urography, renal ultrasound, or CT) may be requested whether or not intervention is anticipated for relief of symptoms. When a decision is made to treat with surgery or a minimally invasive procedure, imaging becomes an important option (AUA Guidelines).
Recently, after considerable success in treating uterine fibroid tumors with arterial embolization (8,9) and with the further development of microcatheters, interventional radiologists in conjunction with urologists have begun experimenting with embolization of the arteries to the prostate to control excessive bleeding from cancer and for the treatment of BPH (10–14). Prostatic artery embolization (PAE) may represent an option in patients who are reluctant to have surgery or have failed medical management.
Magnetic resonance imaging (MRI) has, up to now, had a very limited role in the pretreatment management of patients with BPH with LUTS. However, MRI has potential use in the pre-procedural workup and evaluation of outcome of prostatic arterial embolization in the treatment of BPH (15,16). MRI, not only allows for pre- and post-treatment measurement of prostatic size, but can also characterize vascular perfusion and permeability with dynamic contrast studies (17), visualize the disruption of prostatic vessels with post-contrast anatomic imaging (11,18) and provide imaging correlates of histologic characteristics of the gland (19–25).
Until recently, treatment strategies for lower urinary tract symptoms LUTS have been tested on patient groups among whom there has been little distinction in type or distribution of hyperplasia: strategy A is compared with strategy B or placebo. Similarly, global measures of therapeutic outcome and conclusions have been made as though the experimental group was affected by only one disease (i.e. the treatment does or does not work compared with placebo or TURP). The only way such studies are ordinarily stratified is by prostatic volume (6). However, the First International Consultation of BPH has recommended that “future studies should seek determinants, or predictors of BPH parameters,” calling for “larger studies with adequate power for subgroup analysis” (26). It is entirely possible that therapeutic success for management of BPH subtypes is “lost” when BPH is treated as a global disorder, whereas stratification into subtypes may demonstrate considerable success depending on lobar distributions of hyperplasia.
Three ways of stratification might be considered: overall gland size, histology, and lobar distribution. LUTS is thought to be due to glandular (epithelial) hyperplasia producing increased bulk compressing the posterior urethra (static effect) and/or stromal hyperplasia resulting in increased muscular tone around the urethra producing a similar result (dynamic effect). Most commonly there is a mixture of stromal and epithelial hyperplasia (21). Direct measurement of these relationships can only be done with complex histopathologic morphometry analysis (21–22). Size could be considered a proxy for which of the two predominates for a given level of symptoms and signs. In general, it is assumed the greater the prostatic volume, the larger the component of epithelial hyperplasia (static effect). MRI has been used to quantify the stromal to epithelial ratio (20–25). From the standpoint of baseline imaging and changes on follow-up, lobar distribution as well as volume has potential for stratifying BPH for effects on treatment outcome.
The purpose of this article is to introduce radiologists to the concept of the lobar distribution of BPH using standard MRI anatomic images based on the previously published ultrasound classification, and to take a step toward providing a new tool that, if validated, can be used as an additional biomarker in research to find more individualized therapeutic strategies for BPH. Currently, MRI plays little or no role in routine BPH assessment. In fact, even more available TRUS is not consistently used. But if the more accurate MRI can be proved reliable and reproducible in classifying the lobar distribution, MRI can be tested against TRUS with the hope that TRUS will most often be sufficient and MRI needed only in selected patients with large glands in whom the deeper anatomy near the bladder outlet is not resolved by ultrasound.
Materials and Methods
Patient Selection
The University of Minnesota Medical Center Fairview Hospital database was interrogated covering the years between June 2011 through May 2013. This retrospective study was approved by our internal review board without the need for informed patient consent. A total of 192 men received diagnostic multi-parametaric MRI for suspected adenocarcinoma or staging MRI for biopsy proved adenocarcinoma of the prostate. An additional 94 were referred to the Center for Magnetic Resonance Research for endorectal coil (ERC) examination for similar clinical indications. Of the total of 286 patients, 21 were excluded because they had previous radical prostatectomies, transurethral resections, or such extensive adenocarcinoma on CT scanning as to make the images unclassifiable for BPH. This left a study population of 313 (224 studied without a ERC and 89 with the ERC).
MRI Techniques
For the purpose of demonstrating the lobar anatomy of the prostate gland, it is best studied with MRI fields ≥1.5 Tesla using phased array abdominal surface arrays with or without endorectal coils. The anatomic classification can be adequately done with T2-weighted sequences displaying axial, sagittal, and coronal planes. For the 41 ERC examinations in the current study, a surface array combined with an ERC was used for imaging on a clinical 3T scanner (Siemens Healthcare, Erlangen Germany). The ERC was inflated with 60 ml of perfluorocarbon to reduce air induced susceptibility artifacts. T2-weighted (T2w) axial MR images were generated perpendicular to the anterior rectal wall using a multi-slice Turbo Spin Echo acquisition with 4m 42s scan duration, TR 6000–7200 ms, TE 107 ms; ETL 23, NEX 2, BW 190 Hz/Px, 3 mm slice thickness, 50% oversampling, 140° refocusing flip angle, 2562 matrix, 19–21 slices, 140 mm2 FOV. The minimum TR was dependent for a given patient was dependent on the specific absorption rate limit (SAR) estimated by the system. Sagittal and coronal T2w planes were also acquired perpendicular to the axial planes. The same acquisition parameters were used for these other orientations but typically fewer slices ~15 were required to cover the anatomy of the prostate thus allowing the minimum TR to be used. To minimize motion artifacts, especially when using the ERC, attention to the phase-encoding direction of the acquisitions was important. For both the axial and coronal planes, the phase encode direction was in the right-left direction with respect to the patient and the foot-head direction for the sagittal orientation. Rotating the sagittal plane so that the phase-encode direction is parallel to the prostate-rectum interface is also important to obtain the best image quality.
Imaging protocol without endorectal coil was performed at 3T with a pelvic phased array coil (Magnetom TrioTim; Siemens Healthcare; Erlangen Germany). Axial, sagittal, and coronal T2-weighted imaging was performed (sample TR/TE 5500/105 msec; field of view 180 × 180 mm; matrix 256 × 256; slice thickness 3 mm; 4 signal averages). Dynamic contrast enhanced imaging was performed using a fat-suppressed spoiled gradient-echo T1-wieghted sequence before contrast and at multiple time points following gadolinium administration. Diffusion weighted imaging with b values of 50 and 800 s/mm3 is also routinely performed but not necessary in the evaluation of zonal anatomy
Zonal Anatomy of the Prostate
The histologic anatomy of the prostate, as thoroughly described by McNeil (27) was used in the analysis of the images in this study. The peripheral, central, periurethral, and transition zones are glandular. An anterior fibromuscular stromal area is also mentioned. Complete descriptions of the stromal anatomy of the prostate was reviewed in multiple scientific reports (28–32) and summarized in another (33).
Criteria for Lobar Classification of BPH
Table 1 summarizes the current lobar classifications of BPH. A full description of BPH lobar patterns can be found in a previous publication (33). MRI examples are shown in figures 1,2, 3, 4, 5, 6,7.
Table 1.
Comparison of Randall and Ultrasound Classifications of Benign Prostatic Hyperplasia
| Randall* | Ultrasound** |
|---|---|
| I Simple bilateral | 1 Bilateral TZ |
| II Solitary commissural | 2 Retrourethral |
| III Bilateral & commissural | 3 Bilateral TZ & retrourethral |
| IV Solitary subcervical | 4 Solitary or multiple pedunculated |
| V Bilateral & subcervical | 5 Pedunculated with TZ and/or retrourethral |
| VI Bilateral, subcervical & commissural | 6 Subtrigonal/ectopic |
| VII Anterior | 7 Other combinations |
Randall A. Surgical pathology of prostatic obstructions. Baltimore, Williams & Wilkins, 1931
Wasserman NF. Benign prostatic hyperplasia: A review and ultrasound classification. Radiol Clin N AM 2006;44:689–710
Fig. 1.
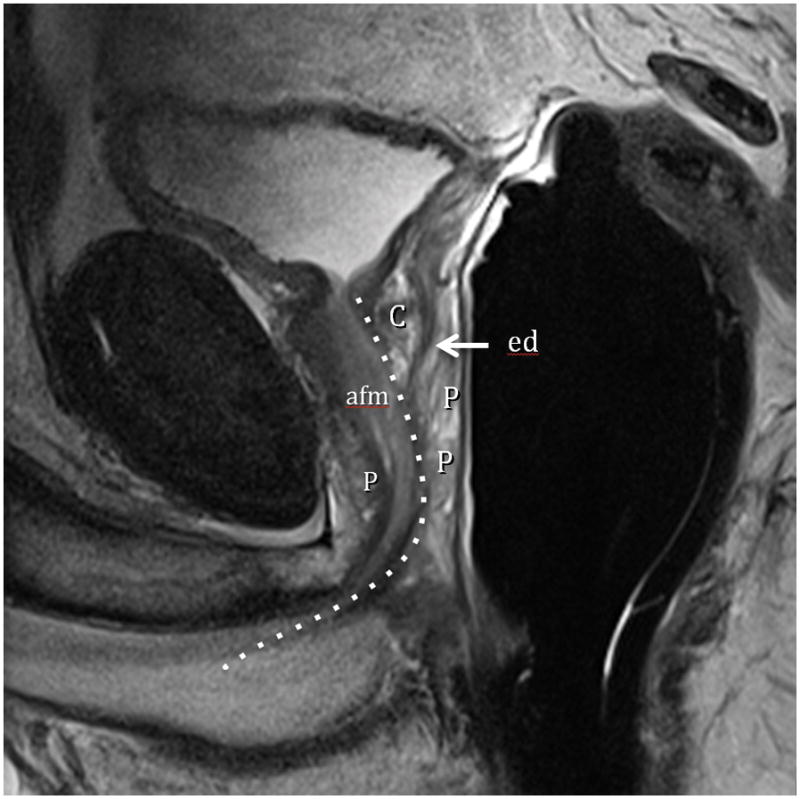
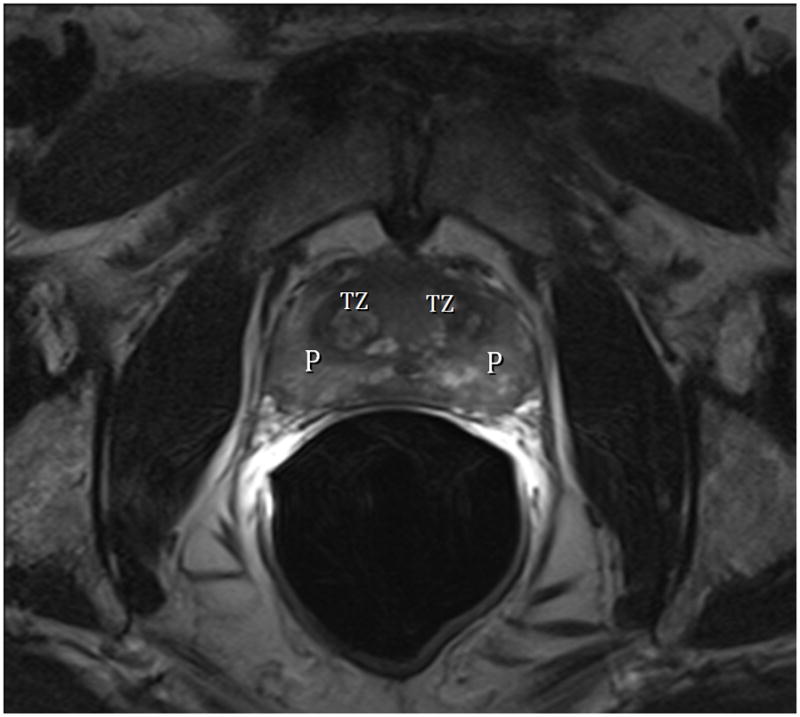

Fig. 1A. Type 0 (Normal) T2-weighted sagittal view at 3T with ERC (C=central Zone, P=peripheral Zone, ed=ejaculatory Duct, afm=anterior fibromuscular zone, dotted line=urethra).Fig. 1B. Type 0 (Normal) T2-weighted image at 3T with ERC at level above the veru. TZ=transition zone, P=peripheral zone. Note minimal TZ hyperplasia, very little, if any compression of the PZ, and overall volume of prostate < 25 cc. Fig. 1C. Type 0 (Normal) T2-weighted Axial View at 3T with ERC at level of verumontanum (V). P=peripheral zone.
Fig. 2.

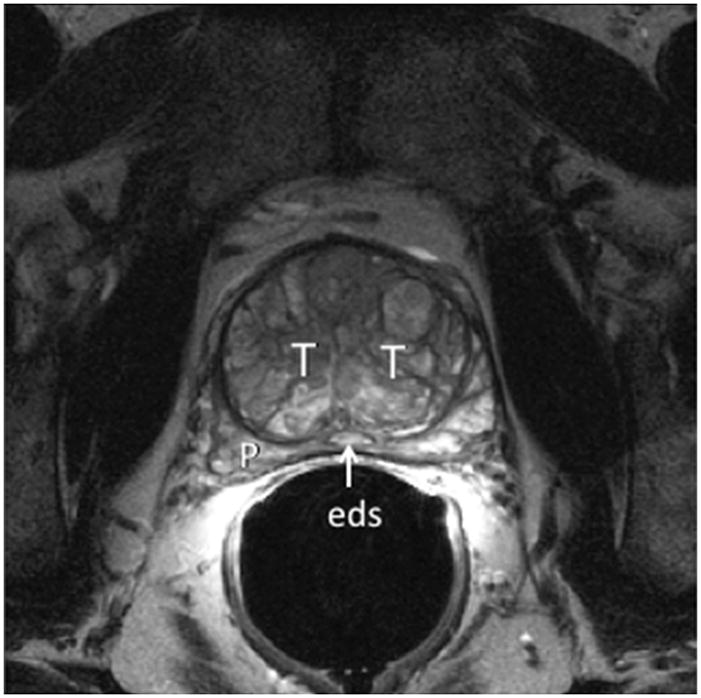
Fig. 2A. Type 1 BPH (Bilateral Transition Zone) T2-weighted sagittal view at 3T with ERC. T=transition zone, P=peripheral zone, C=central zone, e=ejaculatory duct, Dotted line=urethral course. Note expansion of TZ displaces the urethra posteriorly and compresses the central and peripheral zones. Fig. 2B. Type 1 BPH (Bilateral TZ and Retrourethral) T2-weighted axial view at 3T with ERC above the verumontanum. T=transition zone, P=peripheral zone, eds=ejaculatory ducts. Note compression of PZ.
Fig. 3.
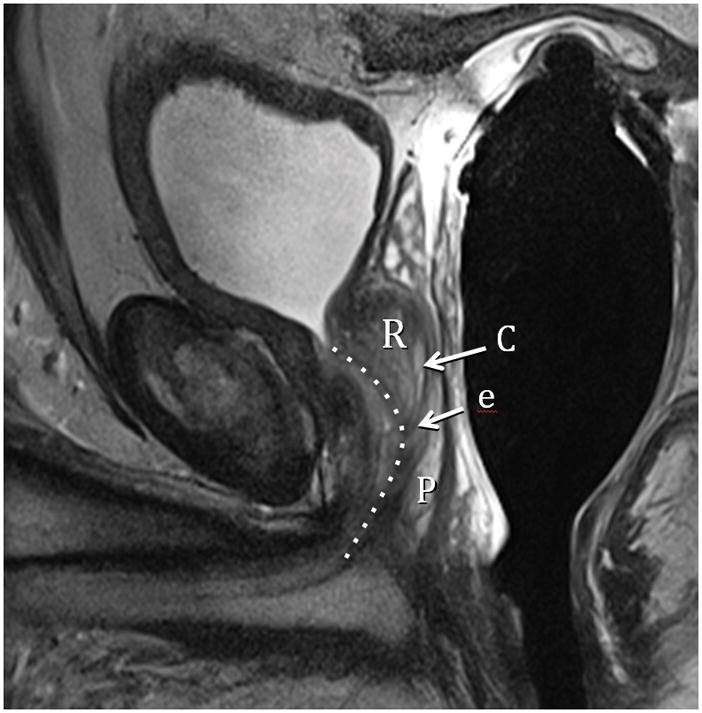

Fig. 3A. Type 2 BPH (Retrourethral) T2-weighted sagittal view at 3T with ERC. R=retrourethral lobe, C=central Zone, P=Peripheral zone, e=ejaculatory duct, dotted line= urethral course. Fig. 3B. Type 2 BPH (Solitary Retrourethral) T2-weighted axial view at 3T with ERC above verumontanum. T=TZ, P=PZ, eds=ejaculatory ducts. Note absence of significant TZ hyperplasia.
Fig. 4.
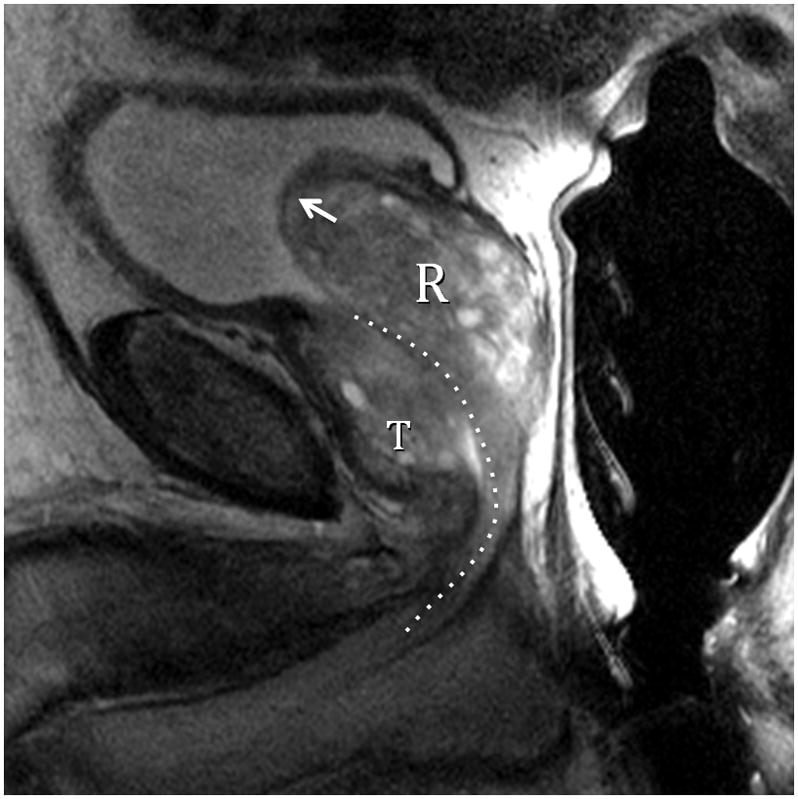
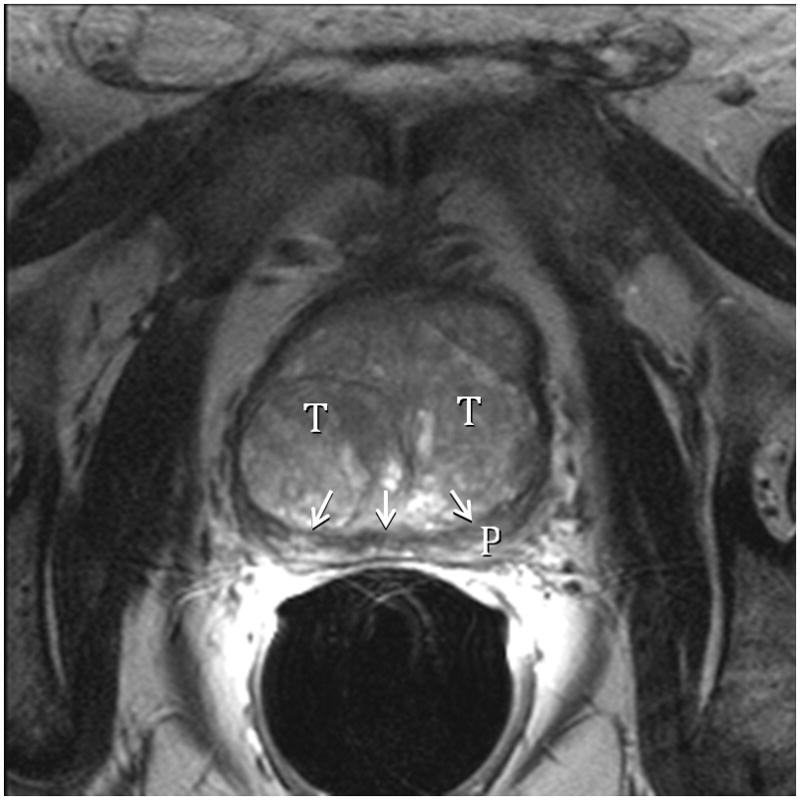
Fig. 4A. Type 3 BPH (Bilateral TZ & Retrourethral) T2-weighted sagittal view at 3T with ERC. R=retrourethral, T=transition zone, Dotted line=urethral course. The retrourethral lobe has herniated through the bladder neck indicating very high prostatic intracapsular pressure. Fig. 4B. Type 3 BPH (Bilateral TZ and Retrourethral). T2-weighted axial view at 3T with ERC above the veru. T=transition zone, P=peripheral zone. Note compression (arrows) of PZ indicating very high prostatic intracapsular pressure.
Fig. 5.
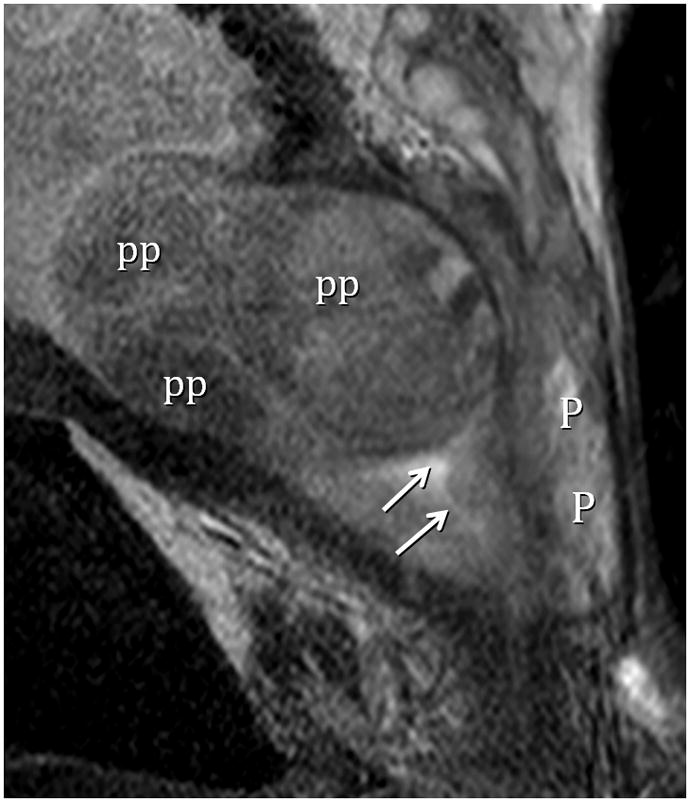
Type 4 BPH (Solitary Pedunculated) T2-weighted sagittal view at 3T with ERC. pp=polypoid adenomas, P=peripherial zone. Urethra indicated by arrows. (Turkbey B, Huang, RJ, Vourganti S, et. al., Educational Exhibit, 98th assembly Radiological Society of North America, Chicago, Ill., 2012)
Fig. 6.
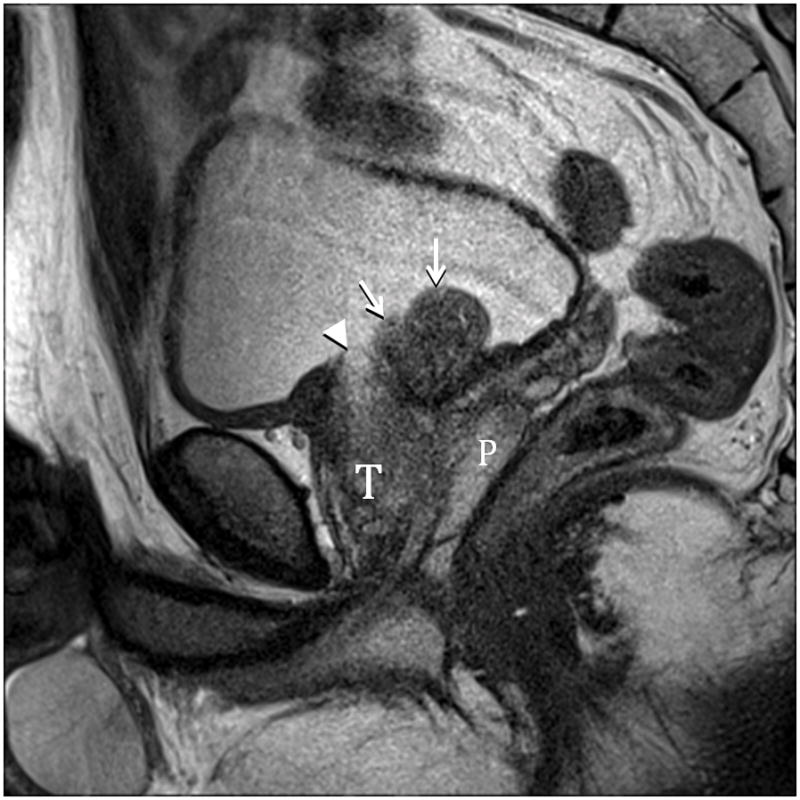
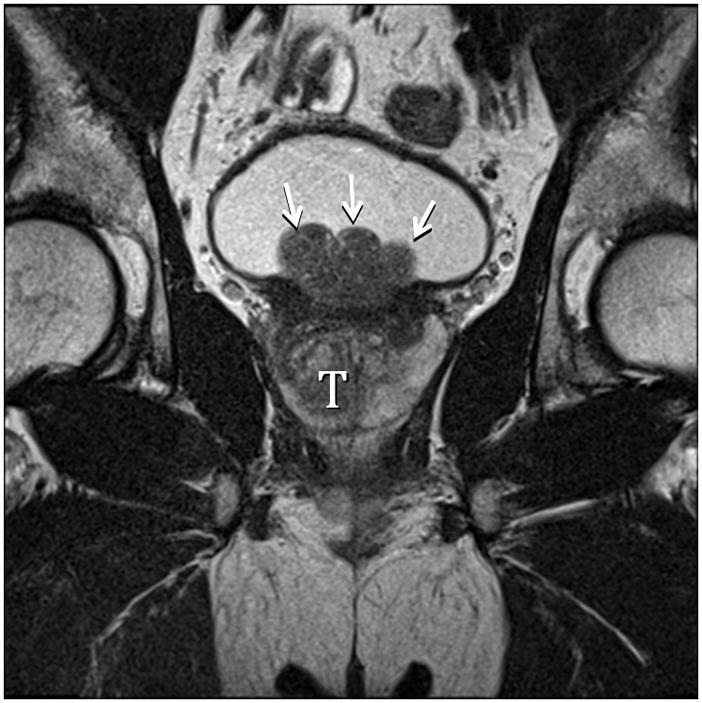
Fig. 6A. Type 5 BPH (Bilateral TZ and Pedunculated) T2-weighted sagittal view at 3T without ERC. T=transition zone, P=peripheral zone, pedunculated polypoid adenomas indicated by arrows. Slight herniation of TZ (arrowhead). Fig. 6B. Type 5 BPH (Bilateral TZ, Retrourethral and Pedunculated) T2-weighted coronal view at 3T without ERC. Pedunculated polypoid adenomas indicated by arrows. T=TZ. Fig. 6C. Type 5 BPH (Unilateral TZ and Pedunculated polypoid) T2-weighted sagittal view at 3T without ERC. Arrow indicates pedunculated adenoma.
Fig. 7.
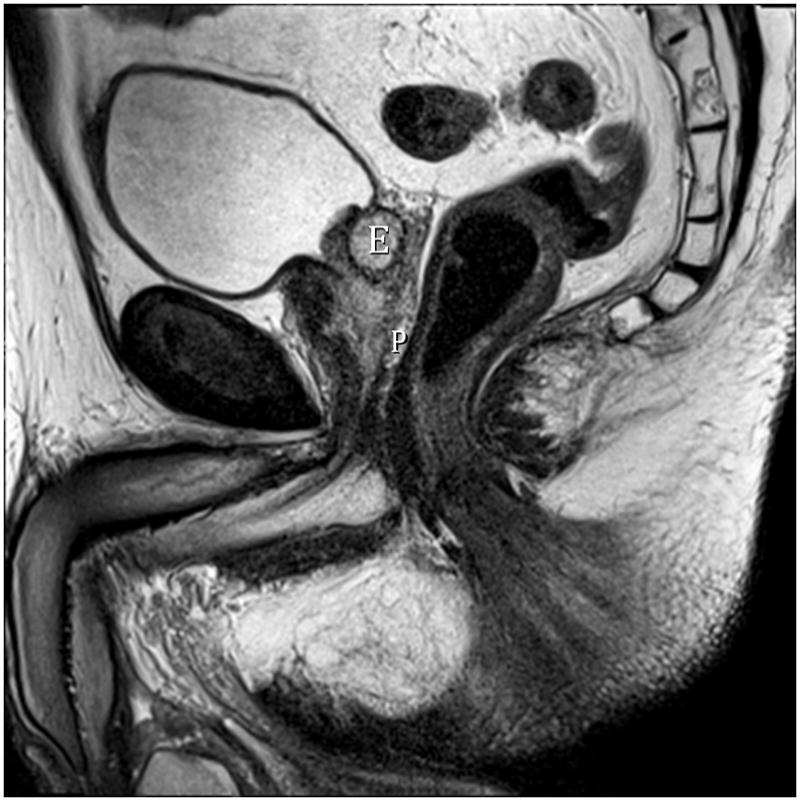
Fig. 7A. Type 6 BPH (Subtrigonal). T2-weighted sagittal image at 3T without ERC. E=ectopic subtrigonal adenoma.
A few guidelines for classification and comments might be helpful. There is a strong consensus in the literature that benign prostatic enlargement (BPE) must exceed 25 cc volume. This does not define the pathologic entity of BPH which is a histological diagnosis. Nor does it mean that a prostate under 25 cc total volume cannot show gross pathologic or imaging evidence of BPH nodules. But for the purposes of our classification we will consider any observed nodular hyperplasia in a gland under 25 cc volume as Type 0 (normal). In the real world, a smaller prostate may be Type 0 but symptomatic from musculo-stromal hyperplasia. In general, Type 1 (TZ), when large, displaces the urethra posteriorally unless there is a balanced anterior impression by an enlarged retrourethral lobe Type 3. Solitary retrourethral enlargement (Type 2) causes anterior displacement of the urethra above the verumontanum. If there is balanced enlargement of the bilateral TZ and retrourethral lobes there may be minimal displacement of the urethral course. It is not known how these relative enlargements effect uroflow or symptoms. Upward displacement of the bladder trigone or herniation through the bladder outlet may comprise TZ, retrourethral or all three lobes. These effects should also be ultimately described in the imaging report when we have a better idea of their influence on symptoms and outcomes. Measuring intravesical prostate protrusion (IPP) has emerged as an important imaging biomarker (see discussion), but is not a part of the basic classification. To determine if an enlarged lobe is “trapped” or herniated through the bladder outlet, careful attention must be paid to the presence or absence of any residual stretched trigone tissue overlying the adenoma. Type 4 (pedunculated) adenomas are the most difficult to define on imaging because the diagnosis rests on being able to see its inferior origin in the urethra which is usually concealed by apposed urethral walls. If the mass is squarely centered within the bladder neck in sagittal and coronal views, it is likely pedunculated. Additionally, the pedunculated adenoma will also have no trigonal muscle overlying it, since it arises completely from intraluminal urethral submucosa. It will be covered by thin uroepithelial mucosa only.
Discussion
Examples of enlargement patterns in response to extremely high intracapsular pressure are shown in figures 8–10 demonstrating the decompression processes of herniation through the bladder neck and disproportionate anteroposterior elongation of the prostate under the highest intracapsular pressure.
Fig. 8.
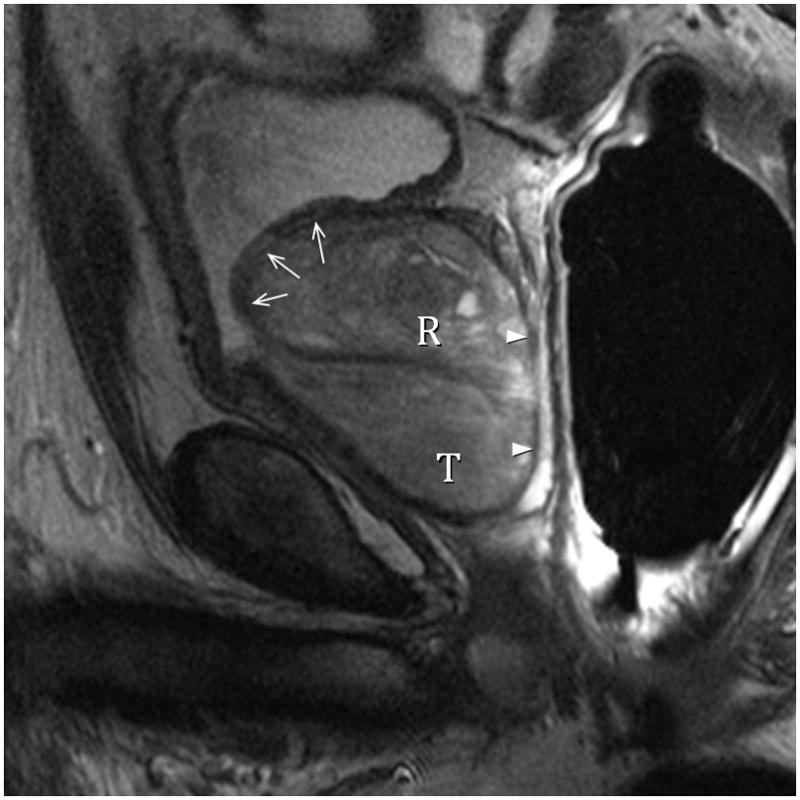
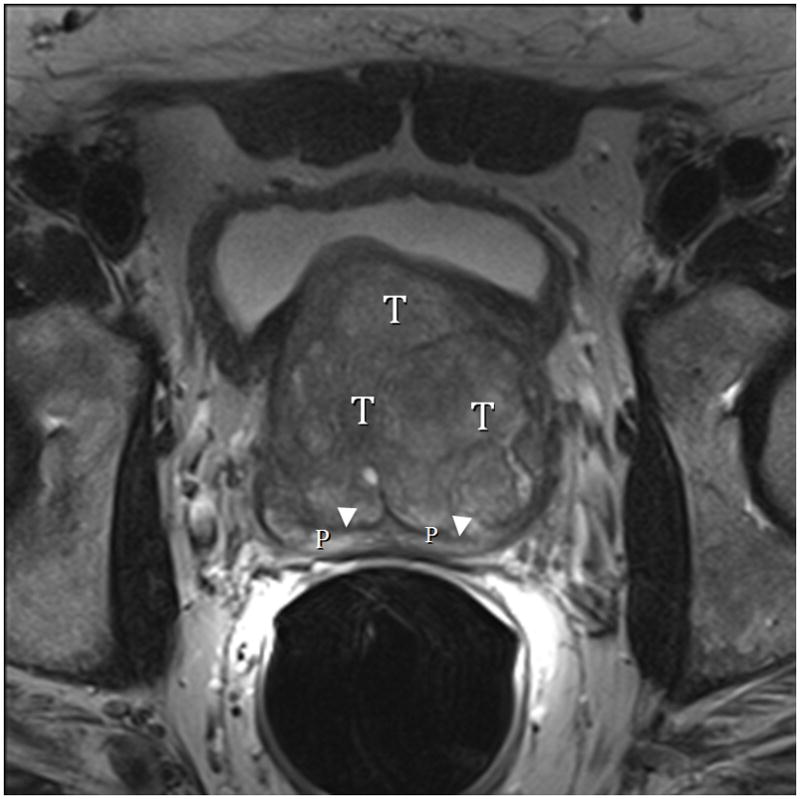
Fig. 8A. Type 3 BPH with “trapped” adenomas elevating the bladder trigone (arrows) and compressing the PZ (arrowheads). T2-weighted sagittal view at 3T with ERC. T=transition zone, R=retrourethral. Fig. 8B. Type 3 BPH with “trapped” adenoma compressing the peripheral zone (P) and elongating the anteroposterior diameter (AP/transverse axis ratio=0.91.) T2-weighted axial view at 3T with ERC.
Fig. 9.

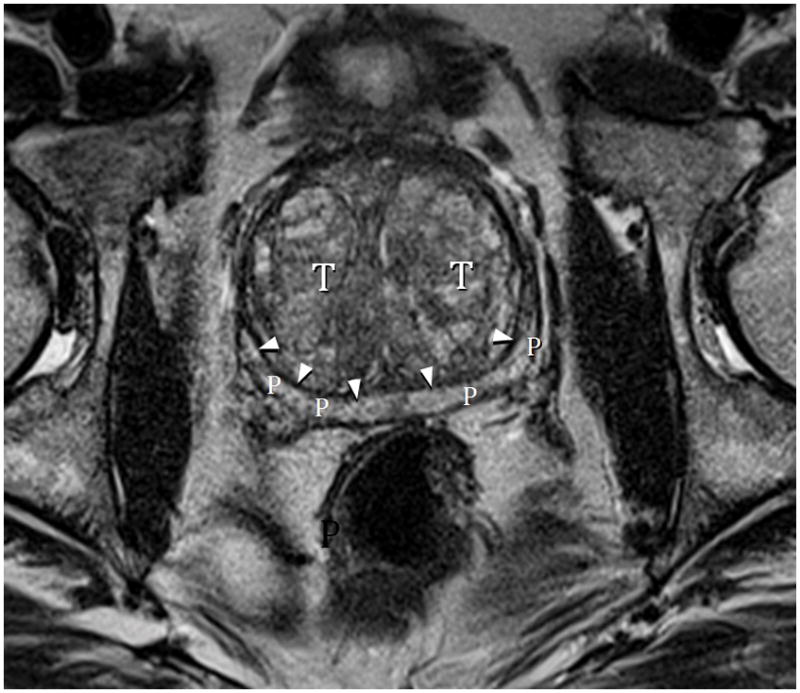
Fig. 9A. Type 3 BPH with “trapped” adenomas below bladder trigone and showing PZ compression (arrowheads). T=transition zone, P=peripheral zone. T2-weighted sagittal image at 3T without ERC.
Fig. 9B. Type 3 BPH axial image mid-gland showing PZ compression (arrows) and disproportionate AP elongation (AP/transverse axis ratio=0.91). Note that lateral PZ is nearly completely compressed indicating the extreme high intracapsular pressure. T2-weighted axial image at 3T without ERC.
Fig. 10.
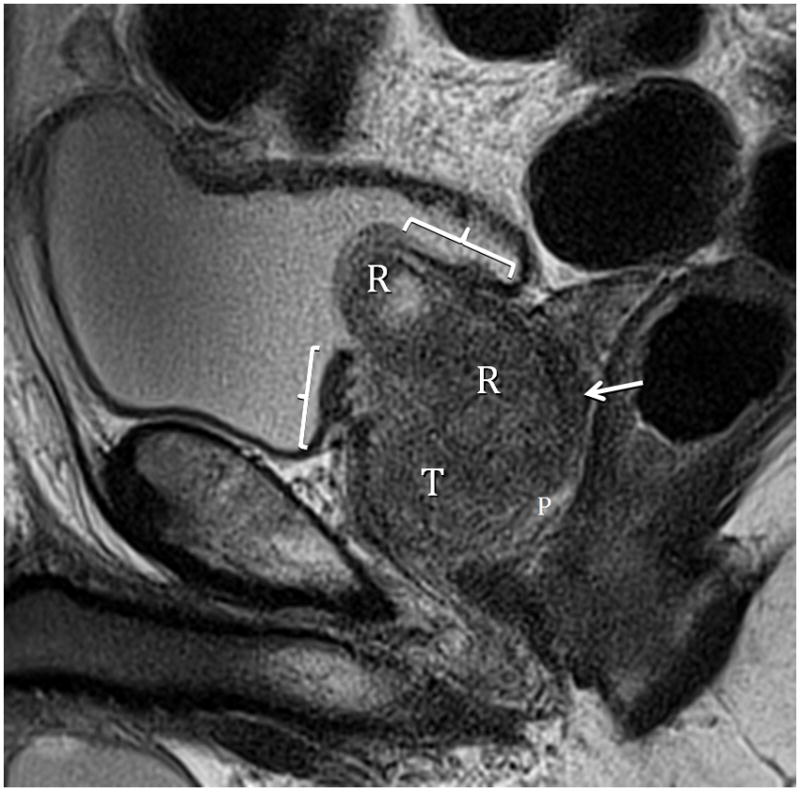
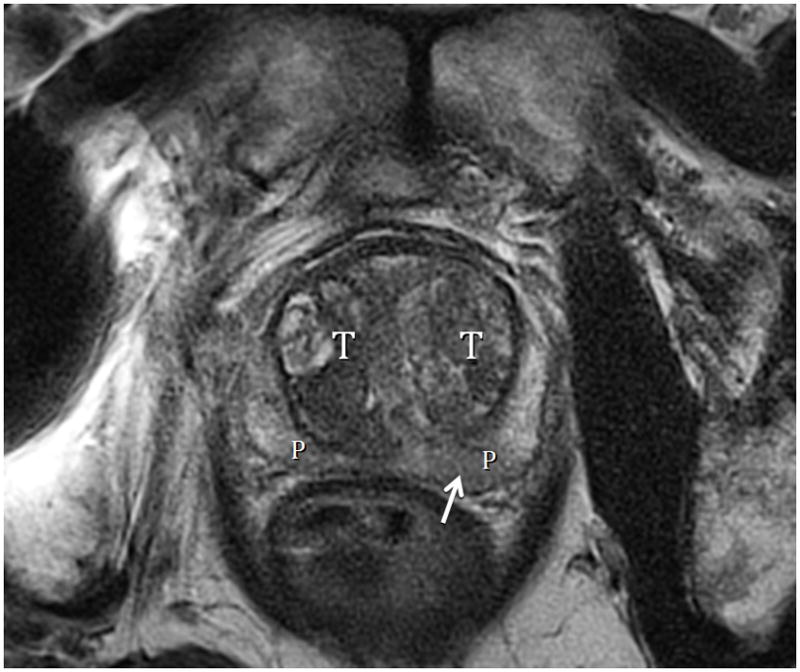
Fig. 10A. Type 3 BPH. T2-weighted sagittal view at 3T without ERC demonstrating retrourethral (R) herniation through the bladder neck. Brackets indicate splayed and thinned bladder trigone. The peripheral zone (P) is infliltrated by adenocarcinoma (arrow) except at the apex. Fig. 10B. Type 3 BPH T2-weighted axial view at 3T without ERC showing less compression on the peripheral zone (P), likely the result of decompression due to herniation of the adenoma through the bladder neck. Note also that there is less anteroposterior elongation (AP to transverse ratio=0.78). Arrow indicates adenocarcinoma in left PZ.
In our population of subjects, when 74 normals (Type 0) were accounted for, there were 239 patients with BPH. Types 1 and 3 BPH were most common (63% and 31% respectively). We found no men with Type 4 isolated pedunculated (Alberrann’s) pattern, although this pedunculated variant was found in conjunction with additional lobar enlargments in one Type 5 and one Type 7 patients (Figure 8). The spectrum of patterns was similar whether or not ERC was employed.
Lobar Classification of BPH
Alexander Randall was the first to attempt prostatic lobar classification using postmortem specimens in 1931(34). This was somewhat limited by the fact that he only observed gross surface anatomy. The work of McNeal beginning in the late 1960s resulted in a histologic reclassification of the internal zonal anatomy of the prostate (27). Enlargements of the glandular zones as described by McNeil have been summarized elsewhere (33) and were also be used to evaluate the MRI images. The zones most involved with BPH are the transition zones that when enlarged become the conventionally labeled “lateral lobes” and the deep glands of the periurethral zone that enlarge into the conventionally labeled “median lobe.” A proliferation of the superficial glands of the periurethral zone generates an intraurethral mass that ascends through the bladder neck at the end of a pedicle producing a “ball-valve” obstruction. This was originally described by Alberran and clarified by Randall (34). The above descriptions were lately reorganized into a clinically applicable ultrasound classification in 2006 (33). In that study comprising a population of American military veterans, there was similar preponderance of Types 1 and 3 lobar enlargement but in different percentages (35 and 46% respectively) compared with this report’s demographic of university patients.
Recent advances in endorectal and surface MRI radiofrequency (RF) coil technology, including both endorectal coils and multi-channel surface arrays, now provide an even greater resolution of both lobar and internal anatomy. We are now able to use MRI to classify BPH into lobar distributions based on well-documented zonal anatomy thus providing the required stratification. It should be noted that several minimally invasive interventions are directed primarily to the enlarged “lateral lobes” (transition zones) ignoring the effects of midline enlargement on voiding function. There have been several recent publications emphasizing the importance of measuring intravesical intrusion of median lobe (retrourethral) enlargement as distinct from lateral lobe (bilateral TZ) enlargement with respect to potential outcome from treatment strategies (35–38).
Related Observations
Under conditions of disease, the prostatic tissue pressure generated against the elastic recoil of the capsule can be extraordinarily high. Mean pressure of 85 mmHg have been measured in vivo at rest (39). Interstitial pressure can rise to levels over 250 mmHg with Valsalva and pelvic muscular contraction. (Wasserman NF, unpublished study, 1995). Indirect anatomic evidence of very high intraprostatic (intracapsular) tissue pressure includes change in the axial contour of the prostate from normal triangular to oval progressing to disproportionate elongation in the anteroposterior diameter relative to transverse diameter (Figs. 8,9). This occurs due to the capsule being incomplete anteriorally resulting in less elastic recoil and resistance to increased tissue pressure from within. As long as the vesicourethral sphincter remains competent to high intracapsular pressure, the growing tissues become “trapped” transferring pressure centrally around the urethra and stretching the anterior fibromuscular tissues producing the disproportionate anteroposterior enlargement (Figs. 8,9). If the vesicourethral sphincter becomes incompetent secondary to extreme prostatic tissue pressure, the prostate decompresses itself by herniating through the internal sphincter into the bladder (Fig. 10). These processes can be observed with ultrasound imaging (33), as well in our studies with MRI. In smaller prostates, TRUS is good enough, but in large volume glands, detailed anatomy is far superior with MRI-especially in the evaluation of intravesical intrusion where the distinction between herniation and trigone elevation without herniation through the bladder neck may be important. Characterization of signs of very high intracapsular pressure could also be used as markers in the assessment of outcome for therapeutic trials, including prostatic arterial embolization.
Based upon early promising studies from Brazil and Portugal, and the interest of the Society of Interventional Radiology in promoting American research with this treatment, it is possible that PAE may be emerging relatively soon as an optional way to manage BPH. As more outcome data becomes available about the safety and effectiveness of PAE and its relationship to lobar anatomy, the radiologist interpreting prostate MRI is encouraged to become familiar with the lobar classification of BPH.
Before this proposed classification can be used, it must be validated with multiple observers and tested for inter- and intraobserver reliability. Rigorous scientific analysis is required to assure that there is no significant difference between methods using ERC and non-ERC techniques.
Conclusion
We demonstrate the capacity of MRI to delineate prostatic lobar anatomy and stratify it into a potentially useful basic phenotypic classification system that can be applied to research on the effects of treatment strategies. It is anticipated that substratification of this pattern may be justified in the future based on results of initial application of the basic classification system.
The American Urological Society has suggested that we “Develop studies that assess disease phenotypes and lead to better disease definitions (e.g. size versus morphological characteristics and their relative importance in producing symptoms, obstructive versus irritative symptoms relative to prostate morphology and size, and patient phenotypes relative to urologic symptom profiles.)” (40)
References
- 1.Chute CG, Panser LA, et al. Prevalence of prostatism: a population based survey of urinary symptoms. J Urol. 1993;150:85. doi: 10.1016/s0022-5347(17)35405-8. [DOI] [PubMed] [Google Scholar]
- 2.Nakajima H. In: Denis L, Griffiths K, Khoury S, et al., editors. 4th International Consultation on Benign Prostatic Hyperplasia; Paris. July 2–5, 1997; Plymoth, UK: Plymbridge Distributors Ltd; 1998. p. 20. [Google Scholar]
- 3.Berry SJ, Coffey DS, Walsh PC, et al. The development of human benign prostatic hyperplasia with age. J Urol. 1984;132:474–479. doi: 10.1016/s0022-5347(17)49698-4. [DOI] [PubMed] [Google Scholar]
- 4.Roehrborn CG, McConnell JD. Etiology, patho- physiology, epidemiology and natural history of benign prostatic hyperplasia. In: Walsh PC, Retik AB, Vaughn EB Jr, et al., editors. Campbell’s urology. 8. Vol. 38. Philadelphia: WB Saunders Co; 2002. pp. 1297–330. [Google Scholar]
- 5.Parsons BA, Hashim H. Emerging Treatment Options for Benign Prostatic Obstruction. Curr Urol Pep. 2011;12:247–254. doi: 10.1007/s11934-011-0190-4. [DOI] [PubMed] [Google Scholar]
- 6.Lepor H, Williford WO, Barry MJ, et al. The efficiency of terazosin, finasteride or both in benign prostatic hyperplasia. N Engl J Med. 1996;335:533–9. doi: 10.1056/NEJM199608223350801. [DOI] [PubMed] [Google Scholar]
- 7.Lusuardi L, Hruby S, Janetschek G. New emerging technologies in benign prostatic hyperplasia. Curr Opin Urol. 2013;23:25–29. doi: 10.1097/MOU.0b013e32835abd34. [DOI] [PubMed] [Google Scholar]
- 8.van der Kooij SM, Ankum WM, Hehenkamp WJ. Review of nonsurgical/minimally invasive treatments for uterine fibroids. Current Opinion in Obstretrics & Gynecology. 2012;24:368–375. doi: 10.1097/GCO.0b013e328359f10a. [DOI] [PubMed] [Google Scholar]
- 9.Bullman JC, Ascher SM, Spies JB. Current concepts in uterine fibroid embolization. Radiographics. 2012;32:1735–1750. doi: 10.1148/rg.326125514. [DOI] [PubMed] [Google Scholar]
- 10.DeMeritt JS, Elmasri FF, Esposito MP, et al. Relief of benign prostatic hyperplasia-related bladder outlet obstruction after transarterial polyvinyl alcohol prostate embolization. J Vasc Interv Radiol. 2000;11(6):767–770. doi: 10.1016/s1051-0443(07)61638-8. [DOI] [PubMed] [Google Scholar]
- 11.Carnevale FC, Antunes AA, da Motta Leal Filho JM, et al. Prostatic artery embolization as a primary treatment for benign prostatic hyperplasia: preliminary results in two patients. Cardiovasc Intervent Radiol. 2010;33(2):355–361. doi: 10.1007/s00270-009-9727-z. [DOI] [PMC free article] [PubMed] [Google Scholar]
- 12.Carnevale FC, da Motta-Leal-Filho JM, Antunes AA, Baroni RH, Freire GC, Cerri LM, Marcelino AS, Cerri GG, Srougi M. Midterm follow-up after prostate embolization in two patients with benign prostatic hyperplasia. Cardiovasc Intervent Radiol. 2011;34(6):1330–3. doi: 10.1007/s00270-011-0136-8. [DOI] [PubMed] [Google Scholar]
- 13.Pisco JM, Pinheiro LC, Bilhim T, et al. Prostatic arterial embolization to treat benign prostatic hyperplasia. J Vasc Interv Radiol. 2011;22(1):11–9. doi: 10.1016/j.jvir.2010.09.030. [DOI] [PubMed] [Google Scholar]
- 14.Pisco JM, Pinheiro L, Campos Bilhim T, et al. Prostatic Arterial Embolization for Benign Prostatic Hyperplasia: Short and Intermediate term. Results Radiology. 2013;266:668–677. doi: 10.1148/radiol.12111601. [DOI] [PubMed] [Google Scholar]
- 15.Pisco JM, Rio Tinto H, Pinheiro LC, et al. Embolisation of Prostatic arteries as treatment of moderate to severe lower urinary symptoms (LUTS) secondary to benign hyperplasia: results of short- and mid-term follow up. European Radiology. 2013 doi: 10.1007/s00330-012-2714-9. on line. [DOI] [PubMed] [Google Scholar]
- 16.Pisco JM, Rio Tinto H, Pinheiro LC, et al. Embolisation of prostatic arteries as treatment of moderate to severe lower urinary symptoms (LUTS) secondary to benign hyperplasia: results of short- and mid-term follow up. Eur Radiol. 2013;23:2561–2572. doi: 10.1007/s00330-012-2714-9. [DOI] [PubMed] [Google Scholar]
- 17.Golzarian J, Antunes AA, Bilhim T, et al. Prostatic artery embolization to treat lower urinary tract symptoms related to benign prostatic hyperplasia and bleeding in patients with prostate cancer: proceedings from a multidisciplinary research consensus panel. J Vasc Interv Radiol. 2014;25:665–674. doi: 10.1016/j.jvir.2013.11.003. a study of pharmacokinetic parameters. AJR 2007; 189:[web]W192–W201. [DOI] [PubMed] [Google Scholar]
- 18.Buckley DL, Roberts C, Parker GJ, Logue JP, Hutchinson CE. Prostate cancer: evaluation of vascular characteristics with dynamic contrast-enhanced T1-weighted MR imaging--initial experience. Radiology. 2004;233(3):709–715. doi: 10.1148/radiol.2333032098. [DOI] [PubMed] [Google Scholar]
- 19.Donnelly SE, Donnelly BJ, Saliken JC, Raber EL, Vellet AD. Prostate cancer: gadolinium-enhanced MR imaging at 3 weeks compared with needle biopsy at 6 months after cryoablation. Radiology. 2004;232(3):830–833. doi: 10.1148/radiol.2323030841. [DOI] [PubMed] [Google Scholar]
- 20.Shapiro E, Hartanto V, Lepor H. The response to alpha blockade in benign prostatic hyperplasia is related to the percent area of density of prostate smooth muscle. Prostate. 1992;21:297–307. doi: 10.1002/pros.2990210406. [DOI] [PubMed] [Google Scholar]
- 21.Shapiro E, Becich MJ, Hartanto V, Lepor H. The relative proportion of stromal and epithelial hyperplasia is related to the development of symptomatic benign prostate hyperplasia. J Urol. 1992;147:1293–1297. doi: 10.1016/s0022-5347(17)37546-8. [DOI] [PubMed] [Google Scholar]
- 22.Weijers RE, Zamborn J-V, Dessels AG_H, de Brüine AP. On the prediction of the histologic composition of benign prostatic hyperplasia based on clinical and MRI parameters. The Prostate. 1997;32:179–187. doi: 10.1002/(sici)1097-0045(19970801)32:3<179::aid-pros4>3.0.co;2-g. [DOI] [PubMed] [Google Scholar]
- 23.Mimata H, Nomura Y, Kasagi Y, Satoh F, Emoto A, Li W, Douno S, Mori H. Prediction of alpha-blocker response in men with benign prostatic hyperplasia by magnetic resonance imaging. Urology. 1999;54:829–833. doi: 10.1016/s0090-4295(99)00258-7. [DOI] [PubMed] [Google Scholar]
- 24.Isen K, Sinik Z, Alkiby T, Sezer C, Sözen S, Atilla S, Ataoglu Ö, Isik S. Magnetic resonance imaging and morphometric histologic analysis of prostate tissue composition in predicting the clinical outcome of terazosin therapy in benign prostatic hyperplasia. Int J Urol. 2001;8:42–482. 497–491. doi: 10.1046/j.1442-2042.2001.00243.x. [DOI] [PubMed] [Google Scholar]
- 25.Ishida J, Sugimura K, Okizuka H, et al. Benign prostate hyperplasia: Value of MR imaging for determining histologic type. Radiology. 1994;190:329–331. doi: 10.1148/radiology.190.2.7506836. [DOI] [PubMed] [Google Scholar]
- 26.Barry MJ, Beckley S, Boyle P, et al. Importance of understanding the epidemiology and natural history of BPH. In: Cockett ATK, Aso Y, Chatelain C, et al., editors. Proceedings of the International consultation on benign prostatic hyperplasia (BPH) Paris: Scientific Communications International Ltd; 1991. p. 37. [Google Scholar]
- 27.McNeal J. The prostate and prostatic urethra: a morphologic synthesis. J Urol. 1972;107:1008–15. doi: 10.1016/s0022-5347(17)61195-9. [DOI] [PubMed] [Google Scholar]
- 28.Hutch JA, Rambo ON., Jr A study of the anatomy of the prostate, prostatic urethra and the urinary sphincter system. J Urol. 1970;104:443–52. doi: 10.1016/s0022-5347(17)61756-7. [DOI] [PubMed] [Google Scholar]
- 29.Blacklock NJ. Surgical anatomy of the prostate. In: Williams DI, Chisholm GD, editors. Scientific foundations of urology. Chicago: William Heinemann Medical Books Ltd., Year Book Medical Publishers; 1976. pp. 473–85. [Google Scholar]
- 30.Oelrich TM. The urethral sphincter muscle in the male. Am J Anat. 1980;158:229–46. doi: 10.1002/aja.1001580211. [DOI] [PubMed] [Google Scholar]
- 31.Tanagho EA. Postprostatectomy incontinence: urodynamic evaluation. In: Hinman F Jr, editor. Benign prostatic hypertrophy. New York: Springer-Verlag; 1983. pp. 985–96. [Google Scholar]
- 32.Turner-Warwick R. Sphincter mechanisms: their relation to prostatic enlargement and its treat ment. In: Hinman F Jr, editor. Benign prostatic hypertrophy. New York: 1983. pp. 809–838. [Google Scholar]
- 33.Turner-Warwick R. Sphincter mechanisms: their relation to prostatic enlargement and its treatment. In: Hinman F Jr, editor. Benign prostatic hypertrophy. New York, NY: Springer Verlag; 1983. pp. 809–838. [Google Scholar]
- 34.Randall A. Surgical pathology of prostatic obstructions. Baltimore (MD): Williams & Wilkins; 1931. [Google Scholar]
- 35.Tan YH, Foo KT. Intravesical prostatic protrusion predicts the outcome of a trial without catheter following acute urine retention. J Urol. 2003;170:2339–2341. doi: 10.1097/01.ju.0000095474.86981.00. [DOI] [PubMed] [Google Scholar]
- 36.Nose H, Foo KT, Lim Kbz, Yokoyama T, et al. Accuracy of two noninvasive methods of diagnosing bladder outlet obstruction using ultrasonography: intravesical prostatic protrusion and velocity-flow urodynamics. Urology. 2005;65:493–497. doi: 10.1016/j.urology.2004.10.014. [DOI] [PubMed] [Google Scholar]
- 37.Kequin Z, Zhishun X, Jing Z, Haixin W, et al. Clinical Significance of intravesical prostatic protrusion in patients with benign prostatic enlargement. Urology. 2007;70:1096–1099. doi: 10.1016/j.urology.2007.08.008. [DOI] [PubMed] [Google Scholar]
- 38.Cumpanas AA, Botoca M, Minciu R, Bucuras V. Intravesical prostatic protrusion can be a predicting factor for the treatment outcome in patients with lower urinary tract symptoms due to benign prostatic obstruction treated with tamsulosin. Urology. 2013;81:859–863. doi: 10.1016/j.urology.2012.12.007. [DOI] [PubMed] [Google Scholar]
- 39.Mehik A, Hellström P, Lukkarinen, et al. Increased intraprostatic pressure in patients with chronic prostatitis. Urol Res. 1999;27:277–279. doi: 10.1007/s002400050123. [DOI] [PubMed] [Google Scholar]
- 40.McVary KT, Roehrborn CG, Avins AL, Barry MJ, Bruskewitz RC, et al. American Urological Association Guideline: Management of Benign Prostatic Hyperplasia (BPH) 2010 http://www.auanet.org/common/pdf/education/clinical-guidance/Benign-Prostatic-Hyperplasia.pdf.


