Abstract
X-ray fluorescence offers unparalleled sensitivity for imaging the nanoscale distribution of trace elements in micrometer thick samples, while x-ray ptychography offers an approach to image light element containing structures at a resolution beyond that of the x-ray lens used. These methods can be used in combination, and in continuous scan mode for rapid data acquisition when using multiple probe mode reconstruction methods. We discuss here the opportunities and limitations of making use of additional information provided by ptychography to improve x-ray fluorescence images in two ways: by using position-error-correction algorithms to correct for scan distortions in fluorescence scans, and by considering the signal-to-noise limits on previously-demonstrated ptychographic probe deconvolution methods. This highlights the advantages of using a combined approach.
Keywords: Ptychography, fluorescence microscopy, fly scan, multiple probe modes, distortion correction, deconvolution
1. INTRODUCTION
Ptychography is a lensless imaging method in which a coherent illumination probe is scanned across the sample and the diffraction patterns are collected from each scanned position.1 With sufficient overlap between these illumination spots,2 one can use an iterative algorithm to reconstruct the object’s complex transmission function and the probe function as well.3–5 The spatial resolution obtained by ptychography is not limited by optics but rather by the object’s scattering strength6 and the geometry of the pixelated detector. Due to the short wavelength and high penetration of x-rays, x-ray ptychography has great promise as a microscopy tool for nanoscale imaging with applications in materials science7, 8 and biology.9–11 When combined with angular projections, x-ray ptychography can be used to generate tomographic reconstructions with 3D quantitative measurements of electron density.12–14
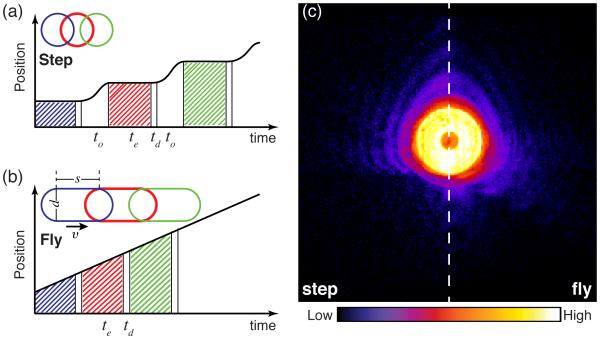
Ptychography was originally performed using a step-scan mode, in which the scanning microscope worked in a move-settle-acquire sequence for data acquisition (see Fig. 1(a)). The motor motion and settle time, which is often referred as overhead (to), was not used for data acquisition. With high brightness sources and high frame rate area detectors, the exposure time te and the readout time of detector td can be very small, so that the motion and settle overhead is responsible for a large wasted time fraction. For example, recent experiments have used the Eiger detector (td = 3 μs) to acquire ptychographic data with exposure times te = 200 ms and move-settle overhead times of to=150 ms,15 resulting in the wasted time fraction of ηstep = 43%. With diffraction limited storage rings expected to provide hundredfold gains in coherent flux,16 exposure times te will decrease accordingly so the percentage of wasted time could be larger than 90%, which will make scans grossly inefficient.
Figure 1.
Comparison of step-scan and fly-scan ptychography. In step-scan mode (a), the probe moves relative to the sample in a move-settle-acquire sequence, where the detector doesn’t acquire data during the move-settle overhead time to; then the diffraction pattern is collected over an exposure time of te, after which the detector becomes inactive for a dead time td for data transfer. In fly-scan mode (b), the probe moves relative to the sample in a scan line with a constant speed while data is acquired over exposure times te followed by brief detector dead times td. Insets show both step-scan and fly-scan beam footprints (assuming a round probe with a diameter d) with s representing the probe motion distance during exposure time te. (c) The diffraction intensities measured from a gold test sample in the two scan modes with te= 100 ms and s = 100 nm (experimental details are in Sec. 2). Speckle visibility is reduced in fly-scan mode. Figure based on.17
To address the scan overhead problem, a continuous motion approach to ptychography has been proposed18 and demonstrated in x-ray17, 19 and visible light20 ptychography. In fly scan ptychography, the probe moves relative to the object continuously within a scan line, while the data is acquired by detectors with a very small time interval of detector dead time, so this scan mode can have very low wasted time fraction. With the same exposure time te = 200 ms acquired by the Eiger detector in fly-scan mode, the wasted time fraction in a scan line would be ηfly = 0.0015%, which can be ignored. Continuous-motion scans have also been used in x-ray fluorescence microscopy for some time.21
Far-field diffraction patterns acquired from a continuously moving sample become blurry with degraded speckle visibility (Fig. 1c), bringing difficulties for ptychographic reconstruction. A recent developed algorithm in ptychography has shown that the decoherence of diffraction patterns, caused by incoherent illumination, sample dynamics, or detector point spread functions, can be used for reconstruction through multiple modes of the object and/or probe.22 This greatly alleviates the stringent requirements of ptychography experiments, allowing one to use partially coherent illumination23 and to deal with sample vibration.24 In our work,17 we have shown that ptychography can be implemented in fly-scan mode to dramatically speed up data acquisition while high quality images are obtained by using multiple probe modes in the reconstruction. The development of this technique is very important for ptychographic scans with large datasets, especially for tomographic imaging where 2D projections need to be acquired over many angles. This development also allows ptychography to be integrated with fly-scan fluorescence imaging for fast multimodal imaging.
2. FLY-SCAN PTYCHOGRAPHY
Fly-scan experiments were carried out at the Bionanoprobe25 at the Advanced Photon Source (APS) at Argonne National Laboratory. In the experiments, a 5.2 keV x-ray beam was focused by a Fresnel zone plate to produce an illumination of d ≃100 nm. A gold test pattern with 30 nm finest feature was driven by piezo stages with continuous motion in horizontal direction. During a continuous scan line, hardware triggers were generated at constant spatial intervals using a nanometer-resolution laser interferometer system, and these position triggers were used to trigger detector readout. All scans kept the same 4 μm×3 μm scan region and 50 nm vertical step size, while with different scan speeds in horizontal direction generating a series of fly-scans with s of 50, 75, 100, 125, 150, 200, 250 and 300 nm for 100 ms exposure time. The far-field diffraction patterns were recorded using a PILATUS 100K photon-counting pixel array detector placed 2.2 m downstream of the sample. The reconstruction codes26 use multiple probe modes in the iterative phasing process22 with GPU parallel programming for speedup.
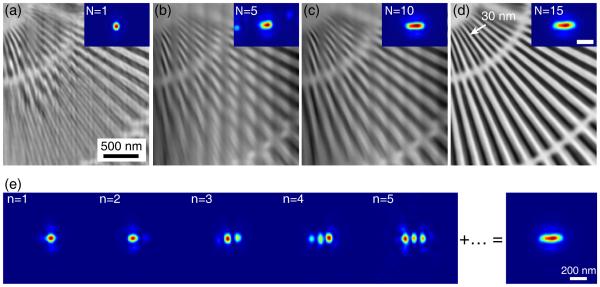
In the reconstructions, we find that the required probe mode number for fly-scan datasets increases proportionally as a function of s/d (d is the beam diameter).17 As the parameter of s/d increases in the above fly-scan datasets, the test pattern images can be successfully recovered using more probe modes in reconstructions. Figure 2 shows the reconstructions of the fly scan with a large s/d ≃ 2.5 (s = 250 nm) using different number of probe modes. An attempt of using single probe mode for reconstruction gives considerable artifacts. As the number of probe modes are increased (Fig. 2 (b)-(d)), the reconstruction quality is improved. The reconstruction using 15 probe modes can well resolve the 30 nm finest structure (see Fig. 2 (d)). The summed intensity (Fig. 2 (e)) of the total 15 modes yields a beam footprint on the sample with a horizontal size of ≃ 350 nm, which is consistent with the expected beam footprint size of l = s + d = 250 + 100 nm. Compared with a step-scan ptychography (50 nm step size) with the same exposure time (100ms) and an overhead of about 400 ms, the fly scan with s = 250 nm is about 25 times faster. This factor can become even larger using smaller exposure time with lower emittance, higher brightness source, such as are anticipated with multi-bend achromat storage rings.16
Figure 2.
The improvement of fly-scan ptychography reconstruction using multiple probe modes. (a)-(d) show reconstructions from the fly-scan dataset with s = 250 nm using 1, 5, 10 and 15 probe modes, respectively. The reconstruction quality is clearly improved as more probe modes are used. The reconstruction with 15 probe modes has nicely recovered the test pattern image with the 30 nm finest features well resolved (d). The first 5 dominant probe modes in (d) case are shown in (e), along with the summed intensity of the total 15 modes revealing the scan footprint. Figure reproduced from Deng et al.17
3. FLY-SCAN PTYCHOGRAPHIC AND FLUORESCENCE IMAGING
X-ray fluorescence microscopy (XFM) offers high sensitivity for quantitative mapping of elements in samples, while ptychography can provide structural information of the samples. The two complementary contrast modes can be obtained simultaneously by combining these two imaging techniques at once in one experiment. The combined imaging approach was demonstrated to image manufactured test structures27 as well as freeze-dried biological samples.9 Since frozen-hydrated samples are known to provide excellent structural and chemical preservation and radiation damage resistance, this combined approach has been recently used to image frozenhydrated algae with simultaneous views of ultrastructure and elemental compositions at high resolution.11 These first demonstrations of the combined technique were carried out in step-scan mode.
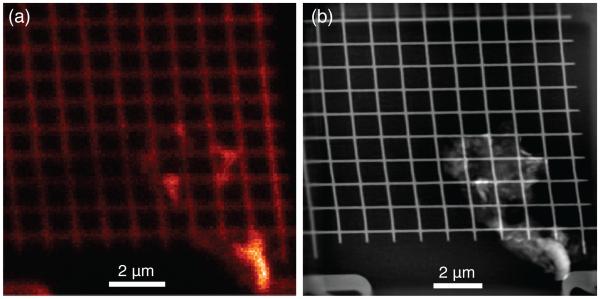
Here we show a demonstration of this combined imaging approach in fly-scan mode using a gold test sample at the Bionanoprobe. The gold test sample was fly scanned with a ~ 85 nm focused beam in horizontal direction with a fly-scan step size of 70 nm. The scan in vertical direction has no difference with conventional step scans with a step size of 70 nm. This fly scan generated 150 × 150 scan points, and at each scan point, both the fluorescence spectra and a far-field diffraction pattern were recorded simultaneously with 100 ms exposure time. The whole scan was finished within 41 minutes, which is about 5 times faster than a step scan with the same step size and exposure time (considering a 400 ms overhead at each scan position in step-scan mode). Gold M-shell fluorescence which has a spatial resolution of about 100 nm (determined by power spectral density) was shown in Fig. 3 (a). Figure 3 (b) is the ptychgraphic reconstruction of the sample from fly-scan data, which has a spatial resolution about 18 nm as determined by line-cut method.
Figure 3.
Simultaneous fly-scan ptychography and fluorescence imaging of a Au test sample. 150 × 150 diffraction patterns were recorded in fly-scan mode with a 5.2 keV focused beam of ~ 85 nm. The fly-scan step size s in continuously moving direction and the step size in the other direction were both kept as 70 nm, yielding a scan region of 10.5 × 10.5 μm. (a) shows the the fluorescence map of Au M-shell, the spatial resolution is limited by the size of the probe beam. (b) Ptychographic image reconstructed from simultaneously acquired diffraction patterns (without position correction). 3 probe modes were used in this reconstruction.
In addition to the simultaneous views of structural and chemical information, this combined approach also provides the opportunities for using ptychograhic results to improve the fluorescence data, which includes distortion correction and deconvolution of fluorescence.
3.1 Distortion correction
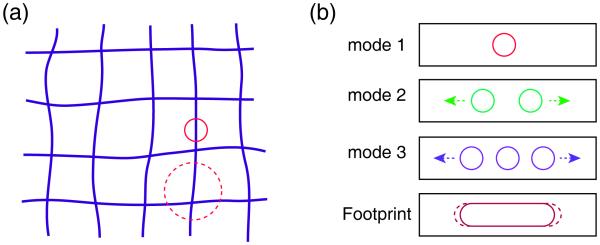
Because ptychography involves collecting diffraction information from overlapping probe positions, information on the relative distances between these illuminating beam positions is encoded in the set of diffraction patterns. If these positons are not as expected, then the reconstructed image will show errors due to the difference between the expected and actual probe positions, and an error minimization approach can be used to correct these differences.28, 29 If fluorescence data is acquired simultaneously, these corrected probe positions can be applied to the fluorescence image as well, thus correcting for any image distortions caused by unintended drifts of the probe versus specimen positions. However, there is a tension between two conflicting goals when using such an approach: for fluorescence microscopy the spatial resolution is limited by the probe size, so one wants the probe to be as small as possible, whereas for ptychography the probe size does not limit the achievable spatial resolution and larger probe sizes allow for more probe overlap over a larger distance for position error correction. This is illustrated in Fig. 4 (a), where a schematic represents an image with distortion. When the probe is large compared to the separation between probe points, there will be many overlapping beam spots and the displacement of one (due to a positioning error) will be easier to detect for two reasons: it will be just one of a greater number of measurements, and there is a greater chance that multiple distinctive features of the specimen will be present within each illumination spot to allow for position errors to be recognized. Therefore, the small beam size required in the combined fluorescence/ptychography technique will lead to some challenges on distortion correction. In addition to losing the advantages of a large probe discussed above, with a small probe one will also have a much larger dataset for imaging the same area. Since an error metric must be measured over the entire dataset while probe positions are adjusted, this will greatly increase the computational work required for a corrected reconstruction; for this challenge we have used an algorithm implemented on cluster computer systems with each node equipped with a graphical processing unit (GPU) to significantly speed up data processing.26
Figure 4.
Challenges of distortion correction in the combined fly-scan ptychographic and fluorescence imaging. (a) Schematic of scans with distortion using small probe (circle) and big probe (dash circle). The big probe covers more features of the sample, allowing for more probe overlaps at each specimen position for improved distortion correction. However, the small probe is better for fluorescence imaging. (b) Schematic of reconstructed probes in fly-scan ptychography. The scan speed in fly scan is assumed to be constant, which produces a uniform probe footprint (brown rounded rectangle) for each diffraction pattern. In real experiments the possibility of non-constant scan speed might result in various probe footprints (dash rounded rectangle) which correspondingly have a series of different probe modes; this would further complicate the task of correcting for probe position errors.
Operating ptychography in fly-scan mode requires a constant scan speed to assure an identical illumination condition for each data collection period. However, the scan speed might not be always constant in real experiments, with a consequence of various illumination conditions (see Fig. 4 (b)) for the acquired diffraction patterns. Therefore, the reconstruction from this kind of dataset will have “average” probe functions which of course contain position errors. This also poses a challenge for distortion correction.
3.2 Limits to ptychographic deconvolution of fluorescence
In ptychography, the probe function is reconstructed along with the object; as a result, ptychography is a useful tool for characterizing nanofocused beams.27, 30 When combining ptychography with fluorescence imaging, the recovered probe function can also be deconvolved from the fluorescence image so as to improve spatial resolution. This has already been demonstrated in images of freeze-dried samples, where the spatial resolution of fluorescence maps was improved by a factor of two.9
Deconvolution can be implemented as an inverse filter function. In x-ray fluorescence, the fluorescence image i(x, y) that one records is a convolution of the object o(x, y) with the intensity point spread function of the probe p(x, y), or
| (1) |
where * denotes convolution. The convolution of two functions i(x, y) = o(x, y) * p(x, y) can be represented in reciprocal space by the product of their Fourier transforms, or I(fx, fy ) = O(fx, fy ) · P (fx, fy ) where {fx, fy } are spatial frequencies and I(fx, fy) = ℱ{i(x, y)} is used to represent a Fourier transform. As a result, the object o(x, y) can be recovered from the recorded image data i(x, y) using
| (2) |
where P (fx, fy ) is the Fourier transform of the intensity point spread function which is in fact the modulation transfer function MTF(fx, fy ). While conceptually straightforward in the case of good knowledge of the probe function (such as provided by ptychography), the approach of Eq. 2 is subject to a significant limitation: the finite resolution of the probe function p(x, y) leads to a decrease of the MTF at high spatial frequencies, and since the image signal tends to decrease at high spatial frequencies the division by decreasing MTF values would tend to multiply noise by a large factor. One straightforward solution is to incorporate a Wiener filter into the deconvolution process,31, 32 since the Wiener filter W (fx, fy ) is an optimal filter if one has a priori knowledge of the spatial frequency distribution of the signal S(fx, fy ) and noise N (fx, fy ) power, or
| (3) |
The Wiener filter can be combined with the modulation transfer function to lead to a combined deconvolution filter D(fx, fy ) of
| (4) |
in which case one arrives at a expression of
| (5) |
for recovery of the fluorescing object o(x, y) from the measured fluorescence intensity i(x, y).
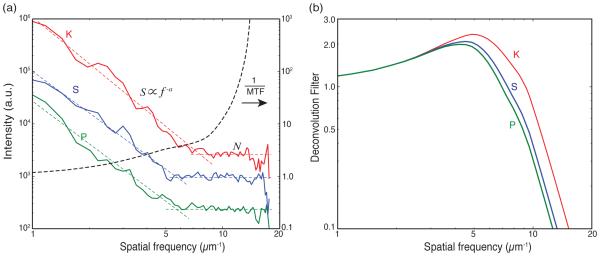
Because the deconvolution filter D(fx, fy ) of Eq. 4 incorporates the Wiener filter, it is necessary to consider the signal and noise in x-ray fluorescence images. X-ray excitation of x-ray fluorescence generates very low background scattering, and spectral processing can further separate that from characteristic fluorescence emission; we use a program MAPS33 to carry out this processing step using per-pixel spectral fitting. The resulting per-element fluorescence intensity maps i(x, y) have photon statistical noise, or shot noise, as their main noise contribution due to relatively low count rates from trace element signals in the case of biological specimens. Images from a wide range of modalities have a signal power in reciprocal space that decreases with spatial frequency as |S(fx, fy)| ∝ f−a. With photon statistical noise, there is no correlation of the noise from one pixel to the next so the noise function has the appearance of a delta function with a flat power spectrum. Therefore one can measure the trends of signal to noise from the power spectrum of an image and thus determine the Weiner filter from that particular image. In Fig. 5(a), we show the power spectral density of fluorescence image data from several trace elements, as well as the inverse MTF curve calculated from the intensity point spread function recovered using ptychography; these data were collected as part of a study of a frozen-hydrated green alga.11 As expected, the fluorescence signals follow the trend |S(fx, fy)| ∝ f−a, where a =2.94 for potassium (K), a =2.78 for sulfur S, and a =2.81 for phosphorous P. The signals roll off to a noise floor |N (fx, fy )| which in fact is a flat function with spatial frequency, but a differing magnitude for each element depending on elemental concentrations present in the sample. With these trends for signal and noise in hand, the Wiener filter can be calculated for each fluorescence image dataset i(x, y) using Eq. 3, and each element’s Wiener filter can then be multiplied by the inverse MTF curve to arrive at an element-specific deconvolution filter D(fx, fy ) given by Eq. 4. These deconvolution filters are shown in Fig. 5(b), and they show that the stronger fluorescence signal from potassium (K) should allow for a higher resolution recovered object o(x, y) than will be possible from the weaker phosphorous (P) fluorescence signal.
Figure 5.
Deconvolution of fluorescence images with the modulation transfer function (MTF) and a Wiener filter W (fx, fy) put together in a combined deconvolution filter D(fx, fy) of Eq. 4. The fluorescence data from several trace elements (K, S, P) were collected simultaneously with ptychography data while imaging a frozen hydrated green alga11 in an experiment using a Fresnel zone plate with an outermost zone width of 70 nm. (a) Power spectral density of the chemical element images shown along with their respective signal trends |S(fx, fy)| ∝ f−a, and the photon statistics noise floor N for each element. (b) The deconvolution filters D(fx, fy) for the trace elements K, S, P obtained using Eq. 4. The filters have small value at high spatial frequency so that the noise will not be amplified in the deconvolution process.
4. CONCLUSION
We have described here our previous results on continuous scan or fly-scan ptychography,17 as well as simultaneous x-ray ptychographic and fluorescence imaging.11 This combined approach offers opportunities for the correction of distortion in scanned images, and for improving the resolution of x-ray fluorescence images of trace element distribution using deconvolution. We have outlined some of the possibilities and potential limitations of these extensions of the combined imaging method. Future studies will be aimed at demonstrating distortion correction, and on exploring the limits of fluorescence image deconvolution. With fly-scan imaging, one can make more efficient use of today’s synchrotron light sources, and this will become essential with brighter sources such as from diffraction-limited storage rings.
ACKNOWLEDGMENTS
We thank K. Brister, C. Roehrig, J. VonOsinkski, and M. Bolbat for help during the experiments. We thank NIH NIGMS for support of this work under R01 grant GM104530. The Bionanoprobe is funded by NIH/NCRR High End Instrumentation (HEI) grant (1S10RR029272-01) as part of the American Recovery and Reinvestment Act (ARRA). Use of the Advanced Photon Source, an Office of Science User Facility operated for the U.S. Department of Energy (DOE) Office of Science by Argonne National Laboratory, was supported by the U.S. DOE under Contract No. DE-AC02-06CH11357.
REFERENCES
- [1].Hoppe W. Diffraction in inhomogeneous primary wave fields. 1. principle of phase determination from electron diffraction interference. Acta Crystallogr. A. 1969;25:495–501. [Google Scholar]
- [2].Bunk O, Dierolf M, Kynde S, Johnson I, Marti O, Pfeiffer F. Influence of the overlap parameter on the convergence of the ptychographical iterative engine. Ultramicroscopy. 2008;108:481–487. doi: 10.1016/j.ultramic.2007.08.003. [DOI] [PubMed] [Google Scholar]
- [3].Faulkner HML, Rodenburg J. Movable aperture lensless transmission microscopy: A novel phase retrieval algorithm. Phys. Rev. Lett. 2004;93:023903. doi: 10.1103/PhysRevLett.93.023903. [DOI] [PubMed] [Google Scholar]
- [4].Rodenburg J, Hurst A, Cullis A, Dobson B, Pfeiffer F, Bunk O, David C, Jefimovs K, Johnson I. Hard-x-ray lensless imaging of extended objects. Phys. Rev. Lett. 2007;98:034801. doi: 10.1103/PhysRevLett.98.034801. [DOI] [PubMed] [Google Scholar]
- [5].Thibault P, Dierolf M, Menzel A, Bunk O, David C, Pfeiffer F. High-resolution scanning x-ray diffraction microscopy. Science. 2008;321:379–382. doi: 10.1126/science.1158573. [DOI] [PubMed] [Google Scholar]
- [6].Schropp A, Schroer CG. Dose requirements for resolving a given feature in an object by coherent x-ray diffraction imaging. New J. Phys. 2010;12:035016. [Google Scholar]
- [7].Takahashi Y, Suzuki A, Zettsu N, Kohmura Y, Senba Y, Ohashi H, Yamauchi K, Ishikawa T. Towards high-resolution ptychographic x-ray diffraction microscopy. Phys. Rev. B. 2011;83:214109. [Google Scholar]
- [8].Shapiro DA, Yu Y-S, Tyliszczak T, Cabana J, Celestre R, Chao W, Kaznatcheev K, Kilcoyne ALD, Maia F, Marchesini S, Meng YS, Warwick T, Yang LL, Padmore HA. Chemical composition mapping with nanometre resolution by soft X-ray microscopy. Nature Photon. 2014;8:765–769. [Google Scholar]
- [9].Vine DJ, Pelliccia D, Holzner C, Baines S, Berry A, McNulty I, Vogt S, Peele AG, Nugent K. Simultaneous x-ray fluorescence and ptychographic microscopy of Cyclotella meneghiniana. Opt. Express. 2012;20(16):18287–18296. doi: 10.1364/OE.20.018287. [DOI] [PubMed] [Google Scholar]
- [10].Wilke RN, Priebe M, Bartels M, Giewekemeyer K, Diaz A, Karvinen P, Salditt T. Hard X-ray imaging of bacterial cells: nano-diffraction and ptychographic reconstruction. Opt. Express. 2012;20:19232–19254. doi: 10.1364/OE.20.019232. [DOI] [PubMed] [Google Scholar]
- [11].Deng J, Vine DJ, Chen S, Nashed YSG, Jin Q, Phillips NW, Peterka T, Ross R, Vogt S, Jacobsen CJ. Simultaneous cryo x-ray ptychographic and fluorescence microscopy of green algae. Proc. Natl. Acad. Sci. 2015;112:2314–2319. doi: 10.1073/pnas.1413003112. [DOI] [PMC free article] [PubMed] [Google Scholar]
- [12].Diaz A, Trtik P, Guizar-Sicairos M, Menzel A, Thibault P, Bunk O. Quantitative x-ray phase nanotomography. Phys. Rev. B. 2012;85:020104. [Google Scholar]
- [13].Dierolf M, Menzel A, Thibault P, Schneider P, Kewish C, Wepf R, Bunk O, Pfeiffer F. Ptychographic x-ray computed tomography at the nanoscale. Nature. 2010;467:436–439. doi: 10.1038/nature09419. [DOI] [PubMed] [Google Scholar]
- [14].Holler M, Diaz A, Guizar-Sicairos M, Karvinen P, Färm E, Härkönen E, Ritala M, Menzel A, Raabe J, Bunk O. X-ray ptychographic computed tomography at 16 nm isotropic 3D resolution. Sci. Rep. 2014;4:3857. doi: 10.1038/srep03857. [DOI] [PMC free article] [PubMed] [Google Scholar]
- [15].Guizar-Sicairos M, Johnson I, Diaz A, Holler M, Karvinen P, Stadler HC, Dinapoli R, Bunk O, Menze A. High-throughput ptychography using Eiger: scanning X-ray nano-imaging of extended regions. Opt. Express. 2014;22:14859–14870. doi: 10.1364/OE.22.014859. [DOI] [PubMed] [Google Scholar]
- [16].Eriksson M, van der Veen JF, Quitmann C. Diffraction-limited storage rings–a window to the science of tomorrow. J. Synchrotron Rad. 2014;21:837–842. doi: 10.1107/S1600577514019286. [DOI] [PubMed] [Google Scholar]
- [17].Deng J, Nashed YSG, Chen S, Phillips NW, Peterka T, Ross R, Vogt S, Jacobsen C, Vine DJ. Continuous motion scan ptychography: characterization for increased speed in coherent x-ray imaging. Opt. Express. 2015;23:5438–5451. doi: 10.1364/OE.23.005438. [DOI] [PMC free article] [PubMed] [Google Scholar]
- [18].Clark JN, Huang X, Harder RJ, Robinson IK. Continuous scanning mode for ptychography. Opt. Lett. 2014;39:6066–6069. doi: 10.1364/OL.39.006066. [DOI] [PubMed] [Google Scholar]
- [19].Pelz PM, Guizar-Sicairos M, Thibault P, Johnson I, Holler M, and Menzel A. On-the-fly scans for x-ray ptychography. Appl. Phys. Lett. 2014;105:251101. [Google Scholar]
- [20].Huang X, Lauer K, Clark JN, Xu W, Nazaretski E, Harder R, Robinson IK, Chu YS. Fly-scan ptychography. Sci. Rep. 2015;5:9074. doi: 10.1038/srep09074. [DOI] [PMC free article] [PubMed] [Google Scholar]
- [21].Lombi E, Jonge MD, Donner E, Ryan CG, Paterson D. Trends in hard x-ray fluorescence mapping: environmental applications in the age of fast detectors. Anal. Bioanal. Chem. 2011;400:1637–1644. doi: 10.1007/s00216-011-4829-2. [DOI] [PubMed] [Google Scholar]
- [22].Thibault P, Menzel A. Reconstructing state mixtures from diffraction measurements. Nature. 2013;494:68–74. doi: 10.1038/nature11806. [DOI] [PubMed] [Google Scholar]
- [23].Mandel L, Wolf E. Optical Coherence and Quantum Optics. Cambridge University; 1995. [Google Scholar]
- [24].Clark J, Huang X, Harder R, Robinson I. Dynamic imaging using ptychography. Phys. Rev. Lett. 2014;112:113901. doi: 10.1103/PhysRevLett.112.113901. [DOI] [PubMed] [Google Scholar]
- [25].Chen S, Deng J, Yuan Y, Flachenecker C, Mak R, Hornberger B, Jin Q, Shu D, Lai B, Maser J, Roehrig C, Paunesku T, Gleber S, Vine D, Finney L, Von Osinski J, Bolbat M, Spink I, Chen Z, Steele J, Trapp D, Irwin J, Feser M, Snyder E, Brister K, Jacobsen C, Woloschak G, Vogt S. The Bionanoprobe: hard x-ray fluorescence nanoprobe with cryogenic capabilities. J. Synchrotron Rad. 2014;21(1):66–75. doi: 10.1107/S1600577513029676. [DOI] [PMC free article] [PubMed] [Google Scholar]
- [26].Nashed Y, Vine D, Peterka T, Deng J, Ross R, Jacobsen C. Parallel ptychographic reconstruction. Opt. Express. 2014;22(26):32082–32097. doi: 10.1364/OE.22.032082. [DOI] [PMC free article] [PubMed] [Google Scholar]
- [27].Schropp A, Boye P, Feldkamp JM, Hoppe R, Patommel J, Samberg D, Stephan S, Giewekemeyer K, Wilke RN, Salditt T, Gulden J, Mancuso AP, Vartanyants IA, Weckert E, Schöder S, Burghammer M, Schroer CG. Hard x-ray nanobeam characterization by coherent diffraction microscopy. Appl. Phys. Lett. 2010;96(9):091102. [Google Scholar]
- [28].Maiden AM, Humphry MJ, Sarahan MC, Kraus B, Rodenburg JM. An annealing algorithm to correct positioning errors in ptychography. Ultramicroscopy. 2012;120:64–72. doi: 10.1016/j.ultramic.2012.06.001. [DOI] [PubMed] [Google Scholar]
- [29].Zhang F, Peterson I, Vila-Comamala J, Diaz A, Berenguer F, Bean R, Chen B, Menzel A, Robinson IK, Rodenburg JM. Translation position determination in ptychographic coherent diffraction imaging. Opt. Express. 2013;21:13592–13606. doi: 10.1364/OE.21.013592. [DOI] [PubMed] [Google Scholar]
- [30].Kewish CM, Thibault P, Dierolf M, Bunk O, Menzel A, Vila-Comamala J, Jefimovs K, Pfeiffer F. Ptychographic characterization of the wavefield in the focus of reflective hard x-ray optics. Ultramicroscopy. 2010;110:325–329. doi: 10.1016/j.ultramic.2010.01.004. [DOI] [PubMed] [Google Scholar]
- [31].Walden AT. Robust deconvolution by modified Wiener filtering. Geophysics. 1988;53:186–191. [Google Scholar]
- [32].Jacobsen C, Williams S, Anderson E, Browne MT, Buckley C, Kern D, Kirz J, Rivers M, Zhang X. Diffraction-limited imaging in a scanning transmission X-ray microscope. Opt. Commun. 1991;86:351–364. [Google Scholar]
- [33].Vogt S. MAPS: A set of software tools for analysis and visualization of3D x-ray fluorescence data sets. J. Phys. IV. 2003;104:635–638. [Google Scholar]


