Abstract
This paper develops a mathematical model for the physical properties of electrodes suitable for use in electric current computed tomography (ECCT). The model includes the effects of discretization, shunt, and contact impedance. The complete model was validated by experiment. Bath resistivities of 284.0, 139.7, 62.3, 29.5 Ω · cm were studied. Values of “effective” contact impedance z used in the numerical approximations were 58.0, 35.0, 15.0, and 7.5 Ω · cm2, respectively. Agreement between the calculated and experimentally measured values was excellent throughout the range of bath conductivities studied. It is desirable in electrical impedance imaging systems to model the observed voltages to the same precision as they are measured in order to be able to make the highest resolution reconstructions of the internal conductivity that the measurement precision allows. The complete electrode model, which includes the effects of discretization of the current pattern, the shunt effect due to the highly conductive electrode material, and the effect of an “effective” contact impedance, allows calculation of the voltages due to any current pattern applied to a homogeneous resistivity field.
Introduction
In 1987, we described a process for identifying the optimal currents for use in electric current computed tomography (ECCT) [1]. Implementation of this process requires the ability to apply arbitrary patterns of current density to the periphery of the body being studied. Arbitrary patterns of current density are most closely approximated using large electrodes with small interelectrode gaps. In fact, it has been shown [2] that signal-to-noise ratio is degraded approximately as the square root of the fraction of the available circumference which contains electrodes.
Yorkey et al. [3] have pointed out a “problem of shunting caused by the large floating electrodes.” The presence of a substantial quantity of highly conductive electrode material on the surface of the body provides an effective short circuit for the applied current, which may reduce the current density at the interior of the body.
This paper presents an approach which may limit the effect of the problem of shunting. A mathematical model of the electrodes is presented, which accounts for their presence on the body surface and includes the effect of electrode conductivity and contact impedance. This model is shown to be accurate at all spatial frequencies representable on a 32-electrode system. Since these spatial frequencies are orthogonal and span the current pattern space, the results are valid for all current patterns. By incorporating this electrode model into the forward solver of a reconstruction algorithm, a reduction in the unmodeled effect of the electrodes can be achieved. This may result in significantly improved static resistivity images.
The Problem
The electrical conductivity of an aliquot of saline or other electrolyte can be determined by placing the substance in a cylindrical test cell of length 1 and cross-section area A. If the resistance from end to end of the cell is measured to be R, the resistivity ρ is given by ρ = RA/1.
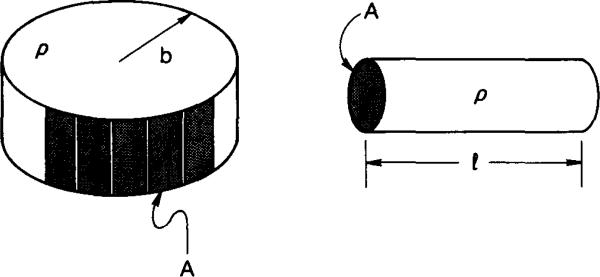
In electrical impedance imaging, the problem is that of evaluating the resistivity of a volume conductor using voltage and current measurements on its surface. This is analogous to but more complex than the cylinder considered above. Consider the impedance imaging problem for a homogeneous disk-like bath having resistivity ρ, and many electrodes placed around its circumference. This geometry is shown at the left in Fig. 1. The multiplicity of electrodes available allows nearly any current pattern to be applied. The problem is linear, however, so that any applied current pattern could be represented by its discrete Fourier series. Thus, we need only to consider the spatial sine and cosine current patterns having spatial frequencies up to L/2 where L is the number of electrodes available. When spatial sine or cosine current densities are applied to the circumference of a cylindrical homogeneous disk, the resulting voltage on that surface is proportional to the magnitude of the applied current density. The ratio of voltage to current density has been shown in [1] to be given by
| (1) |
where b is the radius of the disk, J is the applied current density in milliamperes per cm of circumference, V is the measured voltage, and k is the spatial frequency.
Fig. 1.
Schematic representation of the electrode configurations considered. At the left, many electrodes are placed at the periphery of a uniformly conducting disk. At the right, two electrodes are placed at the ends of a uniformly conducting cylinder.
In practice, L currents are applied to L discrete electrodes of area ACm2 applied at the circumference of the disk, and L voltages are measured on these electrodes. The disk is assumed to be of unit depth. We have defined a term called characteristic resistance r, which is the ratio of voltage to current on any electrode in the homogeneous bath. Thus, r = r̂/A. For the homogeneous bath, r is proportional to the reciprocal of the spatial frequency k. Thus, if one applied a spatial sine or cosine current density, measured voltages, calculated the characteristic resistance r and multiplied the result by k, a constant should result. This constant would be a geometrical factor relating the simple case of a cylinder with electrodes at its ends to the case of a disk with many electrodes around its periphery. For the multielectrode disk,
| (2) |
whereas for the cylindrical cell shown at the right in Fig. 1,
| (3) |
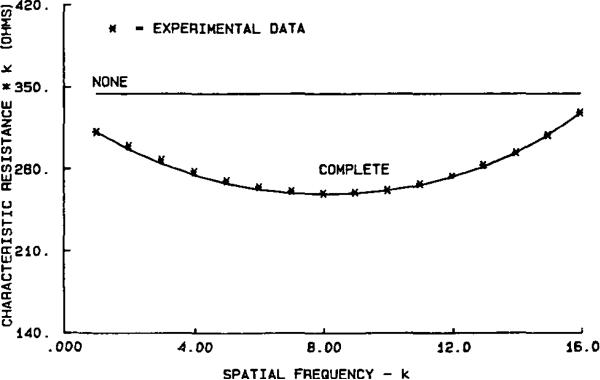
Experiments were conducted on a saline bath of radius b = 15 cm containing L = 32 electrodes with area, A = 12.0 cm2. Bath depth was 4.24cm. Currents were applied having maximum amplitude 5 mA rms at each of 16 spatial frequencies. The resulting voltages were measured and characteristic resistances were calculated according to (12) of the Appendix. The resulting data are shown as asterisks in Fig. 2. As these data clearly show, the experimental results are significantly different from the prediction based on a uniform current density with no electrodes present. This simplest model, kr(k), is illustrated in Fig. 2 by the horizontal line labeled “NONE.” The characteristic resistance represented by this line is that which would be calculated from (2) if current density were a spatial cosine or sine, and voltage were measured at any arbitrary site.
Fig. 2.
The product of characteristic resistance times spatial frequency is plotted versus spatial frequency for spatial frequencies between 1 and 16. Experimental measurements made with a homogeneous saline phantom of 284 Ω · cm resistivity are shown as asterisks. The horizontal line labeled “NONE” is the model with no electrodes considered. The curve through the asterisks labeled “COMPLETE” includes the effects of discretization, shunt, and a contact impedance of 58 Ω · cm2.
The discrepancies between the initial model and experiment appear related to three phenomena not considered in the initial model: a) the actual currents applied to the periphery of the bath are not continuous but are discretized by the electrodes and are zero in the interelectrode gaps; b) the highly conductive metal electrodes applied to the bath circumference shunt some of the current through the electrodes instead of through the bath; c) an effective electrode impedance Z is needed even in the cylindrical experiment to account for the electrode–electrolyte interface.
The Model
This paper develops mathematical models of each of these phenomena, and presents a complete model which accounts for all three effects. This complete model predicts a characteristic resistance which agrees with experiment to within the accuracy of the instruments used. Consider first the effect of discretizing the current density. This model assumes a current density given by
where f = fraction of circumference that constitutes electrodes, Δ = 2π/L and θl = 2πl/L, l = 1, 2, ··· L, and the boundary conditions are given by (14) of the Appendix.
We next model the property that the electrodes are perfectly conducting regions applied to the boundary of the disk. This model assumes that the voltages are constant across each electrode. This model accounts for the fact that the metal precludes any voltage difference across its surface so that voltage gradients on the periphery exist only in the interelectrode gaps. Interelectrode gaps in this experiment were 1 mm wide, separating electrodes 28.4 mm wide. We have shown in (1) that large electrodes provide the best approximation to the continuous current density distributions calculated as the “best” current patterns to optimize image distinguishability.
Consider next the electrode impedance. In the experiment in which current is passed from end to end of a cylindrical test cell an additional factor called an effective contact impedance must be taken into account. This impedance, which depends upon the electrolyte and the electrode material, may be accurately modeled by an impedance of Z Ω in series with the liquid sample. If Z is present at each electrode–electrolyte interface, the resistance to Z must be added in series with ρ1/A to account for the overall resistance observed. If this is done the observed overall resistance R = 2Z + ρ1/A describes the experimental results over a wide range of values of 1, A, and ρ. If this fixed resistance were considered as a lumped fixed resistance in series with the lead of each electrode, the situation is modeled by
where Z is the uniform value of fixed resistor added. In any configuration other than this cylindrical test cell, the model of a fixed resistor in series with the electrode lead is incomplete. Instead, the voltage on the electrode must be given by solving the boundary constraint U + zσ(∂u/∂n) = constant.
We propose a complete model consisting of all three of these effects as the adequate analytical representation for the presence of metal electrodes surrounding a homogeneous saline bath. By incorporating all three of these effects in a single model, the values of r were calculated and plotted as the curve labeled “COMPLETE” in Fig. 2. Values for the parameter z were determined by fitting r16 to r16exp for each value of ρ, the bath resistivity.
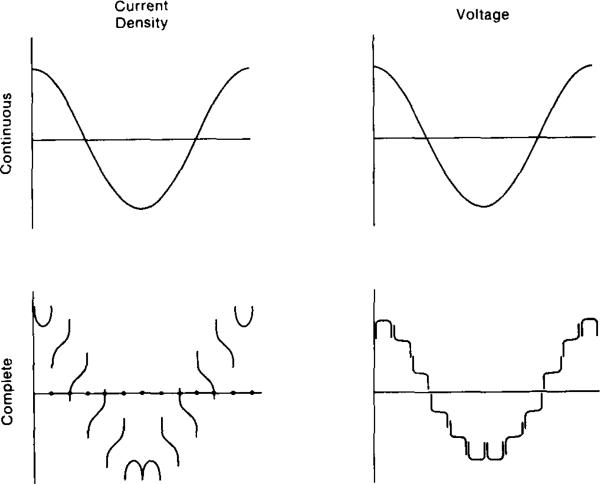
A schematic representation of this model is shown in Fig. 3 for the specific case of spatial frequency 1 or J = cos θ. The top of this figure illustrates the continuous case in which current density and the resulting voltage at the surface are the theoretical cosine function. The lower illustrations depict the normal component of the current density at the surface when currents are applied to L( = 12) electrodes on that surface. There are singularities of current density at the edges of each electrode, and a smooth gradient across the face of each electrode. The integral of the current density across each electrode face is equal to the total current applied to that electrode from the external current generator. The sum of all these externally applied currents is zero. The voltages resulting on these electrodes are shown schematically in the lower right illustration. Voltages are nearly constant across each electrode face, and change only in and near the interelectrode gaps. This schematic representation does not show the details of the voltage profile across each gap. In general, square root singularities in ∂V/∂θ occur at the edges of each electrode. The purpose of this figure is not to demonstrate the details of the voltage or current density profiles in the vicinity of electrodes and gaps, but rather to illustrate the overall effect of the presence of electrodes and how they contribute to the data displayed in Fig. 2 and modeled by the complete model proposed.
Fig. 3.
Current density and voltage profiles at the periphery of a homogeneous disk. Top: ideal case with no electrodes, when J = cos theta is applied. Bottom: approximate current density and voltage produced by a 12-electrode system. See text for details.
The validity of the complete model chosen was further investigated by studying homogeneous phantoms having four different values of background resistivity. Table I gives the characteristic resistances measured experimentally and compares these with computed numerical approximations to the complete model. Bath resistivities of 284.0, 139.7, 62.3, 29.5 Ω · cm were studied. The values of “effective” contact impedance z used in the numerical approximations were 58.0, 35.0, 15.0, 7.5 Ω · cm2, respectively. Agreement between the calculated and experimentally measured values is excellent throughout the range of bath conductivities studied. We note that the ratio of the “effective” contact impedance z to bath resistivity ρ is nearly constant, with z/ρ = 2.4 mm.
TABLE I
| ρo (Ω-cm) | 284.0 | 139.7 | 62.3 | 29.5 | ||||
|---|---|---|---|---|---|---|---|---|
| z (Ω-cm2) | 58.0 | 30.5 | 15.0 | 7.5 | ||||
| k | ρ k exp | ρ k (5) | ρ k exp | ρ k (5) | ρ k exp | ρ k (5) | ρ k exp | ρ k (5) |
| 1, | 312.0 | 312.0 | 156.8 | 156.8 | 70.7 | 70.7 | 33.9 | 33.9 |
| 2 | 150.0 | 148.4 | 75.0 | 74.4 | 33.8 | 33.7 | 16.3 | 16.1 |
| 3 | 96.0 | 94.8 | 47.9 | 47.5 | 21.7 | 21.5 | 10.1 | 10.3 |
| 4 | 69.5 | 68.7 | 34.6 | 34.4 | 15.7 | 15.6 | 7.6 | 7.5 |
| 5 | 54.0 | 53.5 | 27.0 | 26.8 | 12.2 | 12.2 | 5.9 | 5.8 |
| 6 | 44.1 | 43.7 | 22.0 | 21.9 | 10.0 | 10.0 | 4.8 | 4.8 |
| 7 | 37.3 | 37.0 | 18.6 | 18.6 | 8.5 | 8.5 | 4.1 | 4.1 |
| 8 | 32.4 | 32.3 | 16.2 | 16.2 | 7.4 | 7.4 | 3.6 | 3.6 |
| 9 | 28.9 | 28.8 | 14.4 | 14.4 | 6.6 | 6.6 | 3.2 | 3.2 |
| 10 | 26.2 | 26.2 | 13.1 | 13.1 | 6.0 | 6.0 | 2.9 | 2.9 |
| 11 | 24.3 | 24.2 | 12.2 | 12.1 | 5.6 | 5.6 | 2.7 | 2.7 |
| 12 | 22.8 | 22.8 | 11.4 | 11.4 | 5.2 | 5.2 | 2.6 | 2.5 |
| 13 | 21.8 | 21.7 | 10.9 | 10.9 | 5.0 | 5.0 | 2.5 | 2.4 |
| 14 | 21.0 | 21.0 | 10.6 | 10.6 | 4.9 | 4.9 | 2.4 | 2.3 |
| 15 | 20.6 | 20.6 | 10.3 | 10.4 | 4.8 | 4.8 | 2.3 | 2.3 |
| 16 | 20.5 | 20.5 | 10.3 | 10.3 | 4.7 | 4.7 | 2.3 | 2.3 |
Discussion
The “effective” contact impedance found for the complete model compares favorably with that reported for stainless steel electrodes by Geddes et al. [6]. Extrapolating their data (Fig. 6) for low current density to 15 kHz, correcting for electrode area, and calculating total impedance yields an expected contact impedance of impedance magnitude of 15 Ω. This is the same value as we measured for a bath resistivity of 62.3 Ω · cm, which is nearly the same as the 65 Ω · cm value of resistivity of saline at room temperature.
The two studies appear to differ, however, at different bath resistivities. Geddes et al. reported only a weak dependence on bath resistivity, and did not report data at the three different values used. We see a nearly proportional change of ρ with z.
Similar results were also reported by Pollack [7], who found a contact impedance of about 15 Ω at 15 kHz for a 10 mm diameter platinum disk electrode. This corresponds to an impedance of 11.8 Ω · cm2 in a bath of 75 Ω · cm resistivity. These values compare well with our value of 15 Ω · cm2 in a 62.3 Ω · cm bath.
The present model of electrode properties accounts for the presence of discrete metal electrodes on a body's surface, but does not account for all phenomena of interest or importance in impedance imaging. Variations in electrode size or in interelectrode gaps produce unmodeled spatial noise. Physical motion of the phantom, or possible electrochemical variations, produce additional temporal noise. The presence of a thin region of low conductivity immediately beneath the electrodes may impose additional system requirements. This skin resistance generally has large spatial variations, and may also introduce temporal variations due to electrode movement and other artifacts. These potential noise sources indicate that reconstruction algorithms should be designed with high resolution near the periphery, so that skin impedance can be distinguished from that of interior structures. Possible temporal variations in skin impedance require that the data acquisition operate rapidly so that resistivity changes are small during the acquisition interval.
It is instructive to compare the expected magnitude of the impedance across the skin to the magnitude of the electrode effects modeled in the present paper. At the frequencies and electrode sizes studied here, Rosell et al. [4] would predict a skin impedance of about 80-90 Ω for electrodes placed at any of several sites on unprepared skin. This is somewhat higher than, but roughly comparable to the results of Yamamoto et al. [5] who would expect an impedance of about 55 Ω under similar conditions. In comparison, for a spatial frequency of one and a bath resistivity of 284 Ω · cm, we measure a characteristic resistance of 312 Ω in a bath which would have been expected to yield a 355 Ω resistance. This effect of the electrodes of about 43 Ω is of a roughly comparable magnitude to the resistance expected due to the stratum corneum layer of the skin. Thus, the effects accounted for by the present model are approximately as large as the effects of the skin itself.
The influence of a low conductivity skin layer is greater at higher spatial frequencies than at low. The complete model described shows that for homogeneous fields, the discrepancy between characteristic resistance expected and that measured with electrodes increases until a spatial frequency of 8, and then the discrepancy narrows between spatial frequencies of 8 and 16. Thus, the relative importance of modeling electrodes is different at different spatial frequencies.
If the stratum corneum is thinned by the stripping technique described in [5], skin impedance can be reduced to under 20 Ω making it smaller than the electrode impedance effects described here. Nonetheless, the electrode model remains valid and its incorporation into reconstruction algorithms should provide a basis for their substantial improvement. We note that the effects of a highly resistive layer near the boundary are greatest at the highest spatial frequencies, and cosine current patterns and other low spatial frequency currents are least affected by this skin impedance. This observation lends further support to the proposal that large electrodes capable of closely approximating these current patterns should be employed for impedance imaging.
Summary
The effects of both shunting and contact impedance are, for these phantoms, modeled to within the system's precision by Appendix equations (1), (2), (3), the constraint (4), and a single “effective” contact impedance. We have given a mathematical model whose approximate numerical solutions accurately predict the voltages that would result on a homogeneous phantom from any set of applied currents. It is desirable in electrical impedance imaging systems to model the observed voltages to the same precision as they are measured, in order to be able to make the highest resolution reconstructions of the internal conductivity that the measurement precision allows. The present electrode model, which includes the effects of discretization of the current pattern, the shunt effect due to the highly conductive electrode material, and the effect of an “effective” contact impedance appears to meet this requirement.
Acknowledgment
The electrode material was kindly donated by Eltech Systems of Chardon, OH. The authors thank L. F. Fuks, T. Gallagher, and J. Goble for many helpful discussions of this work.
Acknowledgments
This work was supported by the National Institutes of Health under Research Grants RO1-GM15426, RO1-GM39388, and BRSG Grant RR-07104, and National Science Foundation Grants DMS8603957 and EET8706340.
Biographies
 Kuo-Sheng Cheng (S'82) was born in Taipei, Taiwan, Republic of China, on February 4, 1958. He received the B.Sc. and M.Sc. degrees in 1980 and 1982 from National Cheng Kung University, Tainan, Taiwan, both in electrical engineering. He also received the M.S. degree in biomedical engineering in 1988 from Rensselaer Polytechnic Institute, Troy, NY. He is currently a Ph.D. candidate in the Institute of Electrical and Computer Engineering at the National Cheng Kung University.
From 1983 to 1985, he worked as a Research Assistant in biopotential analysis at the Bioelectronics Lab, Institute of Electrical and Computer Engineering, National Cheng Kung University. During 1987 and 1988, he worked as a Research Assistant and Teaching Assistant in the Department of Biomedical Engineering at Rensselaer Polytechnic Institute. His research interests include biosignal processing, image processing, and electric current computed tomography.
David Isaacson (M'86) received the Ph.D. degree in mathematics from New York University's Courant Institute of Mathematical Sciences in 1976.
He is a Professor of Mathematics at Rensselaer Polytechnic Institute, Troy, NY. He is currently working on problems arising in the use of electromagnetic fields for the diagnosis and treatment of disease.
 J. C. Newell (M'74) received the B.S. and M.S. degrees in electrical engineering from Rensselaer Polytechnic Institute, Troy, NY, where he graduated in 1968 and the Ph.D. degree in physiology from Albany Medical College, Albany, NY, in 1974.
He was with the Missile Systems Division of Raytheon Company before joining the Powers Trauma Research Center at Albany Medical College as a Biomedical Engineer in 1970. He is now Professor of Biomedical Engineering at Rensselaer Polytechnic Institute, and Professor of Physiology and Surgery at Albany Medical College. His research interests have included the regulation of the pulmonary circulation in hypoxia, and pulmonary gas exchange in injured patients with acute respiratory failure. His recent work has been the development of an adaptive system for electrical impedance imaging.
 David G. Gisser (S'41-M'47) was born in Kingston, NY, on December 6, 1922. He was educated in electrical engineering at Rensselaer Polytechnic Institute, Troy, NY, and received the D.Eng. degree there in 1965.
He has been a member of the faculty of Rensselaer Polytechnic Institute since 1947. Currently, he is Professor Emeritus in the Electrical, Computer, and Systems Engineering Department. His research interests have been largely in the area of measurement instrumentation as applied to many fields, especially nuclear and biomedical. He is co-author of a textbook, Electrical Engineering: Concepts and Applications, as well as many papers.
Dr. Gisser is the recipient of a number of honors, notably an IEEE Centennial medal. He is a past Chairman of the Schenectady Section of IEEE and served for 20 years as Student Branch Counselor at Rensselaer Polytechnic Institute.
Appendix
U = U (p) denotes the potential at a point p inside the body B. V = V (p) denotes the voltage at a point p on the surface S of the body. Electrodes of area fΔ are located at the sets Δl S; l = 1, 2, ···, L. Here Δ = | S | / L, and f is the fraction of the available space actually occupied by electrodes. The conductivity or reciprocal impedance (admittivity, if considered to be complex) is denoted by σ = σ(p).
We assume the model:
| (1) |
The given current applied to the lth electrode is Il so
| (2) |
and
| (3) |
The unknown voltage to be measured on the lth electrode and predicted by the model is denoted by the constant Vl. The constants Vl, that are to be determined, satisfy
| (4) |
The last equation says that the unknown constants Vl are to be determined by solving (1) subject to the boundary conditions (2) and (3). The solution is further constrained that linear combinations of potential and current density are constants over the electrodes (4).
We regard the currents Il as given and require that they satisfy
| (5) |
in order to satisfy the conservation of charge. We also require the convention that
| (6) |
and Re(zl) ≥ 0.
With these requirements the electrode constraint (4) uniquely determines the Vl, as linear functions of the Il, and the model is well-posed.
The coefficients zl are called the “effective” electrode impedances, and are measured in Ω · cm2. We note that this term differs in meaning from that used in the lumped parameter models of electrode impedance in the work of Frick and that of Schwan. We remark that when zl = 0, the constraint is that of a perfectly conducting electrode touching an ohmic conductor.
Denote the solution operator that assigns the voltages Vl to the given currents Il by R = R(σ, z1, z2, ···, zL). Thus, V = RI.
Since R is self-adjoint if Re(zl) ≥ 0, then R has L − 1 orthogonal real eigencurrents: I1, I2, ···, IL−1, i.e.,
| (7) |
satisfying (5) and L − 1, possibly degenerate eigenvalues
| (8) |
We order the characteristic resistances ρk and characteristic currents Ik by the convention
| (9) |
Thus, the ρk and Ik characterize R in the sense that if I is any applied current pattern, the resulting voltage pattern V can be found by
| (10) |
In other words, in order to solve the model for arbitrary applied currents, we need only to find the characteristic current Ik and resistances ρk.
It follows from the discrete, rotation invariance of a homogeneous phantom that the characteristic currents of this system are
| (11) |
where for l = 1, 2, ···, 32, θl = l2θ/32, and Nk is chosen so that ⟨ tk, tk ⟩ = 1. This system is completely characterized by the characteristic resistances ; k = 1, 2, ···, since the first 15 eigenvalues are degenerate.
We experimentally measured by applying the currents to electrodes l = 1, 2, ···, 32, for k = 1, 2, ···, 31. The currents Tk are scaled in milliamperes (mA) and the voltages Vk were measured in millivolts. Then
| (12) |
The experimentally determined values of k are plotted as asterisks in Fig. 2.
Model Description
Model 1—No Electrode (Continuum Model)
Here we assume the current density on the boundary is given by
| (13) |
where A = area of the electrode = fhr02 / L and k = 1, 2, ···, 16. So the model is (1) plus the boundary condition that
| (14) |
In this case the theoretically predicted characteristic resistances are
| (15) |
The straight line labeled “NONE” in Fig. 2 is a graph of for k = 1, 2, ···, 16.
Model 2–Discretization Effect
Here we assume a current density given by
| (16) |
and the boundary conditions are given by (14). The values of kρk calculated from this model deviated from the experimental data by as much as 70 Ω · cm.
Model 3—Perfectly Conducting Electrode (No Contact Impedance-Pure Shunting)
Here we the boundary conditions (2) and (3) with the applied currents
| (17) |
where θl = l2π/32 and we assume the constraint (4) with zl = 0 for l = 1, 2, ···, 32. The computed characteristic resistances for this model deviated from the experimental values by as much as 116 Ω · cm.
Model 4—Lumped Contact Impedance
This model simulated a crude experimental approximation to electrode or contact impedance. The experiment consists of adding fixed resistors in series with the connection to each electrode. It is only an approximate model because interaction among adjacent electrodes related to this added resistance is not modeled.
The relevant boundary conditions applied are (2) and (3) with the constraint that
| (18) |
where Z is the (uniform) value of fixed resistor added. The value of Z for the model was chosen by fitting to ρ16 to . This model was closer than models 2 or 3 alone were to the experimental data, but nevertheless deviated by about 29 Ω · cm at spatial frequencies between 3 and 6.
Model 5—Discretization + Shunt + Contact Impedance
Here we assume the boundary conditions (2) and (3) and the constraint (4) with zl = z for l = 1, 2, ···, 32. The characteristic resistances are denoted by . The values z used for different conductivity phantoms are given in Table I. They were determined by fitting to for each phantom. The curve is labelled “COMPLETE” in Fig. 2.
The reason for using the highest spatial frequency characteristic resistance to determine the “effective contact impedance” in models 4 and 5 is that it is the most sensitive to changes in z. This is because the high spatial frequency current patterns put the most energy into a layer near the boundary where the electrodes are located.
Footnotes
IEEE Log Number 8929169.
Contributor Information
KUO-SHENG CHENG, Department of Electrical Engineering, National Cheng-Kung University, Taiwan, Republic of China..
DAVID ISAACSON, Departments of Mathematics and Computer Science, Rensselaer Polytechnic Institute, Troy, NY 12180..
J. C. NEWELL, Department of Biomedical Engineering, Rensselaer Polytechnic Institute, Troy, NY 12180..
DAVID G. GISSER, Department of Electrical, Computer, and Systems Engineering, Rensselaer Polytechnic Institute, Troy, NY 12180..
References
- 1.Gisser D, Isaacson D, Newell JC. Theory and performance of an adaptive current tomography system. Clin. Phys. Physiol. Meas. 1988;9(Suppl. A):35–41. doi: 10.1088/0143-0815/9/4a/007. [DOI] [PubMed] [Google Scholar]
- 2.Gisser D, Isaacson D, Newell JC. Current topics in impedance imaging. Clin. Phys. Physiol. Meas. 1987;8(Suppl. A):39–46. doi: 10.1088/0143-0815/8/4a/005. [DOI] [PubMed] [Google Scholar]
- 3.Yorkey TJ, Webster JG, Tompkins WJ. Errors caused by contact impedance in impedance imaging. Proc. IEEE/Seventh Ann. Conf. Eng. Med. Biol. Soc. 1985:632–637. [Google Scholar]
- 4.Rosell J, Colominus J, Riu P, Pallas-Areny R, Webster JG. Skin impedance from 1 Hz to 1 MHz. IEEE Trans. Biomed. Eng. 1988 Aug;35:649–651. doi: 10.1109/10.4599. [DOI] [PubMed] [Google Scholar]
- 5.Yamamoto T, Yamamoto Y. Electrical properties of the epidermal stratum corneum. Med. Biol. Eng. 1976;14:151–158. doi: 10.1007/BF02478741. [DOI] [PubMed] [Google Scholar]
- 6.Geddes LA, DaCosta CP, Wise G. The impedance of stainless-steel electrodes. Med. Biol. Eng. 1971;9:511–521. doi: 10.1007/BF02474708. [DOI] [PubMed] [Google Scholar]
- 7.Pollack V. Computation of the impedance characteristic of metal electrodes for biological investigations. Med. Biol. Eng. 1974;12:460–464. doi: 10.1007/BF02478602. [DOI] [PubMed] [Google Scholar]


