Figure 1.
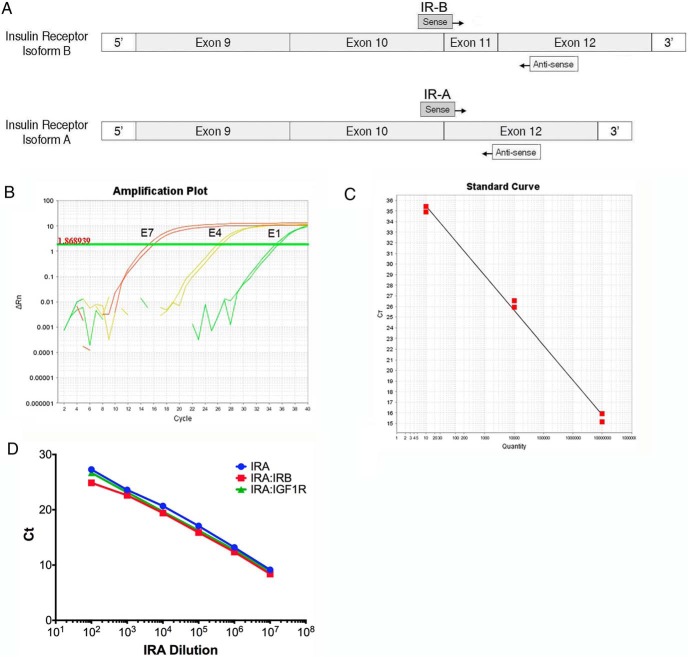
Human IR isoform-specific qRT-PCR primer design, and validation. A, Schematic representation of IR-B (exon 11+) and IR-A (exon 11−) primer design strategy. Both assays use a common reverse primer that anneals within exon 12 and isoform-specific forward primers that anneal across exon-exon junctions unique to each isoform. B, Sample amplification plot for IR-B assay using serial dilution of IR-B standard as template. Numbers to the left of each amplification curve indicate amount of standard used as template in each reaction. Horizontal line indicates threshold determined by Applied Biosystems sequence detection systems software. No template control reactions showed no amplification above baseline (not shown). C, A standard curve generated from the amplification plot of Ct vs log concentration of the plasmid standards for IR-B (slope = −3.33). D, Competition assay. A standard curve plot for IR-A (blue) is overlaid with standard curve plots using IR-A standards plus 107 copies of IR-B (red) or IGF-1R (green) standard at each data point.

