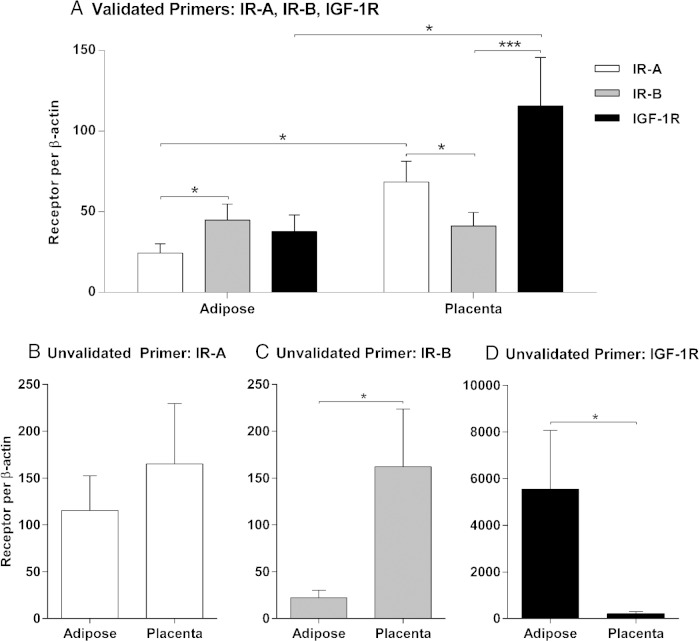
Figure 3.
Comparison of two different primer sets used to quantify relative receptor expression in adipose and placenta tissue. Similarities and discrepancies in the expression of IR-A, IR-B, and IGF-1R in adipose and placenta using the validated primer set (A) or the unvalidated primer set (B–D) are shown. The qRT-PCR assay with the validated primers enables direct quantification of relative receptor expression levels due to assay validation and optimization. Thus, the mean ± SEM for each receptor is presented on the same scale as shown in panel A. The unvalidated primers were designed and used according to common practices; thus, they provide a quantification of individual receptor expression and cannot be used to compare levels of different receptors in a given tissue. The mean ± SEM for each receptor are shown in three separate graphs: IR-A (B), IR-B (C), and IGF-1R (D). *, P < .05; **, P < .001.

