

Abstract
It is well-established that during goal-directed motor tasks, patients with essential tremor have increased oscillations in the 0–3 and 3–8 Hz bands. It remains unclear if these increased oscillations relate to activity in specific brain regions. This study used task-based functional magnetic resonance imaging to compare the brain activity associated with oscillations in grip force output between patients with essential tremor, patients with Parkinson's disease who had clinically evident tremor, and healthy controls. The findings demonstrate that patients with essential tremor have increased brain activity in the motor cortex and supplementary motor area compared with controls, and this activity correlated positively with 3–8 Hz force oscillations. Brain activity in cerebellar lobules I–V was reduced in essential tremor compared with controls and correlated negatively with 0–3 Hz force oscillations. Widespread differences in brain activity were observed between essential tremor and Parkinson's disease. Using functional connectivity analyses during the task evidenced reduced cerebellar-cortical functional connectivity in patients with essential tremor compared with controls and Parkinson's disease. This study provides new evidence that in essential tremor 3–8 Hz force oscillations relate to hyperactivity in motor cortex, 0–3 Hz force oscillations relate to the hypoactivity in the cerebellum, and cerebellar-cortical functional connectivity is impaired.
Keywords: cerebellum, essential tremor, fMRI, grip force, motor control, Parkinson's disease
Introduction
Essential tremor is an age-associated disorder and is the most common pathological tremor disorder in the world (Louis et al. 1998). The cardinal feature of essential tremor is an entrainment of motor unit activity at 3–8 Hz that produces a kinetic tremor of the hands and arms (Deuschl et al. 1998; Deuschl and Elble 2000; Louis et al. 2001; Louis 2011), and there are increased oscillations between 0 and 3 Hz in patients with essential tremor (Poon et al. 2011). At neuropathological examination, the most consistent changes identified in essential tremor are found within the cerebellum, including Purkinje cell axonal and dendritic swellings (Louis, Faust, Vonsattel, Honig, Rajput, Robinson, Pahwa, et al. 2007; Louis 2009; Kuo et al. 2011; Louis et al. 2011; Yu et al. 2012). The structural changes in the cerebellum identified in postmortem tissue could be related to abnormal cerebellar activity in patients who experienced tremor, but the extent that tremor recordings from patients with essential tremor directly correlate with cerebellar activity has not been reported in the literature. In the primary motor cortex (M1) of patients with essential tremor, studies using electroencephalography (EEG) and electromyography (EMG) report that scalp electrodes contralateral to the tremulous hand have coherence between EEG–EMG at a tremor frequency between 3 and 8 Hz (Hellwig et al. 2001, 2003; Raethjen et al. 2007). Further, magnetoencephalography (MEG) and EMG studies in patients with essential tremor report that the activity of M1 is coherent with EMG oscillations at the tremor frequency between 5–7 Hz (Schnitzler et al. 2009). The current study examines the blood oxygenation level-dependent (BOLD) signal in the cerebellum and cortex during a grip force task that elicits tremor to determine how the BOLD signal relates to 0–3 and 3–8 Hz oscillations in force in essential tremor.
The landmark study by Jenkins et al. (1993) used C15O2 positron emission tomography (PET) and found that resting regional cerebral blood flow (rCBF) was increased in the cerebellum of essential tremor patients compared with control subjects. Although the findings were clear at rest, the study did not find between-group differences during action tremor. The current study used task-based functional magnetic resonance imaging (fMRI) to determine if the BOLD signal is increased, decreased, or normal in patients with essential tremor compared with healthy controls. Since the BOLD signal for task-based fMRI represents the difference between task-based activity and rest (i.e., baseline) and essential tremor patients have elevated rCBF at rest, it could be that the resting signal in the cerebellum is elevated to the extent that it would cause the task-based BOLD signal to be reduced. We hypothesized that the BOLD signal in the cerebellum during a grip force task would be decreased in patients with essential tremor compared with control individuals. In contrast, based on prior work using EEG and MEG (Hellwig et al. 2001, 2003; Raethjen et al. 2007; Schnitzler et al. 2009), we predicted that the BOLD signal in motor cortex would be increased in essential tremor patients compared with control individuals. Since 0–3 and 3–8 Hz force oscillations are elevated in essential tremor (Poon et al. 2011), we also examined if distinct regions within the cerebellum and cortex relate to the 0–3 and 3–8 Hz force oscillations.
If the cerebellum and M1 produce abnormal BOLD activity in essential tremor, an important subsequent question is how this activity may impact other regions of the brain. Prior studies applying transcranial magnetic stimulation (TMS) to the cerebellar cortex of healthy adults report that stimulating the cerebellum prior to stimulating M1 reduces corticospinal excitability (Ugawa et al. 1995; Baarbe et al. 2014). In addition, resting state functional connectivity has shown important links between the cerebellum and motor cortex (Bernard et al. 2014). In this study, the primary interest was to examine functional connectivity during the force control task to assess the correlations between cortico-cortical and cerebellar-cortical oscillations. It was determined if cortico-cortical and cerebellar-cortical oscillations are increased or decreased in essential tremor compared with healthy controls and compared with Parkinson's disease. Since the motor cortex from EEG and MEG has increased coherence with EMG signals at the tremor frequency in essential tremor (Hellwig et al. 2001, 2003; Raethjen et al. 2007; Schnitzler et al. 2009), we expected to observe increased cortico-cortical task-based connectivity for patients with essential tremor. Also, since we hypothesized that the cerebellum activity would be reduced in essential tremor and the cerebellum is a site of pathology in essential tremor (Louis, Faust, Vonsattel, Honig, Rajput, Robinson, Rajput, et al. 2007; Louis 2009; Kuo et al. 2011; Louis et al. 2011; Yu et al. 2012), we predicted that the cerebellar-cortical task-based functional connectivity would be reduced in essential tremor.
In addition to studying essential tremor and controls, this study compares the BOLD signal and task-based functional connectivity between patients with essential tremor and individuals with Parkinson's disease. Parkinson's disease and essential tremor are among the most common movement disorders. While Parkinson's disease patients can have a resting tremor, they also can have action tremor that looks like essential tremor (Deuschl et al. 1998). The action tremor of Parkinson's disease occurs in a similar frequency band as patients with essential tremor making it difficult to use frequency analysis alone to distinguish a tremor associated with essential tremor from a tremor associated with Parkinson's disease (Sturman et al. 2005; Helmich et al. 2013). The action tremor of Parkinson's disease and essential tremor can appear similar to a physician, and the underlying pathophysiology that distinguishes these 2 diseases is not fully understood (Shahed and Jankovic 2007). Prior fMRI work examining the same grip task used in the current study has shown that the basal ganglia and M1 have a reduced BOLD signal compared with control individuals (Prodoehl et al. 2010; Spraker et al. 2010). Therefore, it was anticipated that clear differences would emerge in the basal ganglia and M1 between essential tremor and Parkinson's disease.
Materials and Methods
Participants
This study included 42 participants: 14 with essential tremor, 14 with Parkinson's disease, and 14 healthy controls. All essential tremor and Parkinson's disease patients were recruited and diagnosed by movement disorders specialists according to established criteria: essential tremor based on the Statement of the Movement Disorders Society on Tremor (Deuschl et al. 1998) and Parkinson's disease based on the United Kingdom Parkinson's Disease Society Brain Bank criteria (UPDRS) (Hughes et al. 2001). Essential tremor and Parkinson's disease patients were tested after overnight withdrawal from anti-tremor and anti-Parkinsonian medication, respectively. All Parkinson's disease patients had an action/postural tremor (range: 1–2 from question 21 of UPDRS). Healthy participants were recruited and matched to patients for age and handedness. All participants were tested between the hours of 7:30 AM and 12:30 PM. This study was conducted in accordance with the ethical standards outlined in the 1964 Declaration of Helsinki. Institutional Review Board approved procedures were carried out with the written consent of the participants.
Grip Force fMRI Task
Prior to the MRI session, each participant's maximum voluntary contraction (MVC) was measured using a Jamar Hydraulic Pinch Gauge. Participants then completed a training session to become familiar with the grip force task. In the training and experimental session, patients produced force with their most tremulous hand based upon self-report. In addition to matching for age and sex, healthy controls were matched to patients based on the hand used in the task and self-reported handedness.
Participants produced force against a custom-designed Bragg grating fiber optic transducer (Neuroimaging Solutions, Gainesville, FL). The transducer was housed in a precision grip apparatus that was held between the thumb and index finger in a modified precision grip (Fig. 1A). The force transducer and its housing were constructed from rigid, nonmetallic materials. As shown in Figure 1B, the visual display contained 2 horizontal bars presented against a black background: a red/green force bar and a white target bar. During rest periods, the force bar was stationary and was red.
Figure 1.
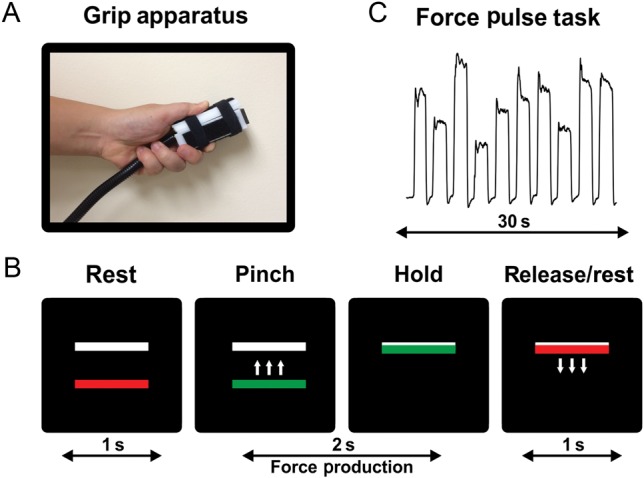
Methods for the precision grip task. (A) Modified precision grip shown with custom-built force transducer. (B) The visual display consists of 2 bars: a moveable red/green force bar and a (stationary) white target bar. The red bar turned green allowing it to be moved up and down in direct accordance to the amount of force applied to the transducer. The location of the white bar indicated the target amplitude. A green force bar indicated “go” and a red force bar indicated “rest”. (C) A representative raw force trace from a healthy participant. Participants completed 10, 2-s force pulses separated by 1 s of rest for 30 s.
Participants completed one 7.3-min precision grip force task in the fMRI session. We used a blocked-design paradigm consisting of alternating force and rest intervals. The task began and ended with a 30 s rest interval. During the force interval, participants were instructed to produce force for 2 s which began when the force bar turned green. Each 2-s force pulse was separated by 1 s of rest, which was cued by a color change of the force bar from green to red. A series of 10 force pulses plus rest were completed to achieve a block of 30 s (Fig. 1C). Participants were instructed to produce force to quickly reach the white target, maintain force on the target, and then quickly decrease force when the force bar became red. The target force amplitude varied from trial to trial. Participants completed 4 blocks of grip force in each of 2 visual feedback conditions. We included a vision condition and a no-vision condition to test for an interaction between group and visual condition. In the vision condition, participants were assigned target amplitudes by the location of the target bar and were provided with real-time force output information via the green bar. In separate blocks of trials, participants completed the task without vision (i.e., the green bar did not move) and were instructed to produce force to different target levels. The force bar changed from green to red (and red to green) to cue force onset and offset to control the duration of force. Participants were instructed to vary the force amplitude level for each pulse and not fall into a specific pattern.
Force data Acquisition and Analysis
The force transducer was calibrated and had a resolution of 0.025 N. Force data were digitized at 125 Hz using the si425 Fiber Optic Interrogator (Micron Optics, Atlanta, GA) and were collected and converted to Newtons with customized software written in LabVIEW (National Instruments, Austin, TX).
Data analysis procedures were consistent with the methodology developed in previous work (Spraker et al. 2009, 2010). Visual inspection of force output was performed and 4 time-points were determined for each force pulse: onset of force, force time point when the subject reaches a steady-state hold, force time point when the subject begins to decrease force, and offset of force. We then created 3 independently filtered datasets. For the first dataset, we used a 6th order low pass filter with a cutoff frequency of 3 Hz. This procedure removes the tremor component of force output. In a separate analysis, we used a 6th order bandpass filter with a frequency passband of 3–8 Hz. This procedure isolates the essential tremor component of the force output. Last, in a final analysis, we used a 6th order bandpass filter with a frequency passband of 8–15 Hz to isolate any physiological tremor. We next quantified for each set of filtered data the standard deviation of force with custom algorithms in MATLAB (The MathWorks, Inc., Natick, MA). We also report the results for the mean force for the 0–3 Hz band. The 3–8 and 8–15 Hz bands were filtered such that the oscillations occur about zero force and thus the mean is less relevant in these datasets. All variables were analyzed using a 2-way analysis of variance (ANOVA): 3 (group: essential tremor, Parkinson's disease, control) by 2 (vision: vision, no-vision). A main effect of group was decomposed using Tukey's HSD post hoc test. All statistical tests were evaluated at an alpha of 0.05.
FMRI data Acquisition and Preprocessing
Magnetic resonance images were collected using a quadrature volume head coil inside a 3-Tesla MRI Scanner (GE Healthcare 3T94 Excite 2.0, GE Healthcare, Waukesha, WI). Participants lay supine in the scanner while performing the task. Head position was stabilized with adjustable padding on both sides of the head. Scanner noise was attenuated by a combination of earplugs and earphones. Functional images were obtained using a T2*-weighted, single shot, gradient-echo echo-planar pulse sequence (echo-time (TE) 25 ms; time to repeat (TR) 2500 ms; flip angle 90°; field of view (FOV) 200 mm2; imaging matrix 64 × 64; 42 axial slices at 3 mm thickness; 0 mm gap between slices). Anatomical images were obtained using a T1-weighted fast spoiled gradient echo pulse sequence (TE 2.9 ms; TR 9.9 ms; flip angle 25°; FOV 240 mm2; imaging matrix 256 × 256; 120 axial slices at 1.5 mm thickness; 0 mm gap between slices).
FMRI Analyses
Data processing and analysis was performed using the public domain software AFNI (Automated Functional NeuroImaging: http://afni.nimh.nih.gov/afni/), SPM (Statistical Parametric Mapping: http://www.fil.ion.ucl.ac.uk/spm/), and custom shell scripts. Data processing for the whole brain and cerebellum were similar except where noted. All data processing was performed in AFNI except when normalizing to the cerebellum in MNI space. The first 4 volumes of each scan were discarded to allow for T1-equilibration effects. Motion detection functions were applied to each functional time series using standard procedures in AFNI. Remaining volumes underwent slice-acquisition-dependent slice-time correction followed by registration to the last echo-planar volume (via rigid body transformations), alignment with the anatomical scan, and then warping to the Montreal Neurological Institute (MNI) brain template (ICBM152) in a single transformation to avoid repeated resampling of the data. Next, each volume was smoothed to a final smoothness of 4 mm full width at half maximum (FWHM) consistent with prior studies (Prodoehl et al. 2010, P 2013). Head motion was evaluated and voxels greater than 0.5 mm from TR to TR were excluded. To normalize the data, the signal in each voxel at each time point was scaled by the mean of its time series on an individual subject basis. In a separate analysis for the cerebellum, functional data in the cerebellum were smoothed after the data were normalized and isolated from the whole brain. Because of the distortions that occur in the cerebellum during normalization, the cerebellum was normalized separately using a high-resolution atlas template of the cerebellum (SUIT: a spatially unbiased atlas template of the cerebellum and brainstem) (Diedrichsen 2006; Diedrichsen et al. 2009). Functional data in the cerebellum were smoothed to a final smoothness of 2 mm FWHM, consistent with the recommendations from SUIT procedures. Next, each functional data set was regressed to the expected hemodynamic response function for each task. The dependent variable at this level of the analysis was the estimated β-coefficient of the regressed time series. The 6 head motion parameters (3 rotations and 3 translations) calculated during registration were included in the general linear model as regressors of no interest. Importantly, since participants produced force with their most tremulous hand, fMRI data were left-right flipped for all participants that completed the task with their left hand. Thus, we refer to the left hemisphere as contralateral to the performing hand and the right hemisphere as ipsilateral to the performing hand. Since some of the functions of the human brain are lateralized, it is possible that such cerebral asymmetries could influence our findings. For example, it is established that right parietal cortex is lateralized for spatial attention and the left and right prefrontal cortex can be specialized for recall and recognition of memory, respectively (Posner and Petersen 1990; Cabeza et al. 2003). To address this issue, we kept the ratio of those who used their right hand and left hand consistent across subjects in each group, and we kept the ratio of right-handers consistent across groups.
For group-level analysis, the output data were analyzed using separate 2-way ANOVAs: 1) group (essential tremor, control) by vision (vision, no-vision), 2) group (essential tremor, Parkinson's disease) by vision (vision, no-vision), and 3) group (control, Parkinson's disease) by vision (vision, no-vision). The P-value threshold and the extent threshold required to achieve the reported familywise error rate (FWER) were determined using AFNI's 3dClustSim program, which takes into account the smoothness of the residual dataset and whole-brain mask as inputs, and creates Monte-Carlo simulations of noise-datasets with the specified smoothness. It then creates a frequency distribution of noise-cluster sizes and advises the P-value and cluster extent required to control the FWER at a chosen level. Group-level analyses were thresholded at the voxel-level at P < 0.005 and cluster size of 324, which provides P < 0.05 (corrected). Since the F-values do not provide the direction of the group effect, in the figures we label the data with warm (red) colors when the mean difference between groups was positive and cool (blue) colors when the mean difference between groups was negative.
Regions of activation were identified according to neuroanatomical coordinates reported in previous investigations (Culham et al. 2003; Mayka et al. 2006; Prodoehl et al. 2008; Diedrichsen et al. 2009). These regions served as the regions of interest (ROI) for the next step in the analysis. Percent signal change was extracted from each ROI and then correlated with force output variables in the 0–3, 3–8, and 8–15 Hz bands. To control for multiple comparisons, a correction at a false discovery rate (FDR) of 0.05 was performed using the Benjamini–Hochberg–Yekutieli method in MATLAB. The method can be found at: http://www.mathworks.com/matlabcentral/fileexchange/27418-benjamini-hochbergyekutieli-procedure-for-controlling-false-discovery-rate/content/fdr_bh.m. The adjusted P-value was 0.006 for the correlation analyses.
Functional Connectivity Analysis
Following task-based fMRI analyses, we performed functional connectivity analyses on the entire fMRI run including rest and task blocks using AFNI. It is likely that the functional connectivity results would differ for the resting condition alone, and therefore, we included both rest and force task blocks since essential tremor is a disorder of action. We used 3 seeds that differed significantly between essential tremor and healthy controls within the cerebellum, M1, and supplementary motor area. The following steps were used to process these data in AFNI: 1) despike to remove extreme time series outliers; 2) slice time correction for interleaved acquisition; 3) align EPI to the anatomy; 4) warp to MNI space; 5) segment anatomy into cerebral spinal fluid (CSF), gray matter (GM) and white matter (WM); 6) regress data for CSF and whole brain signal; 7) process time series through ANATICOR; 8) censor time points with head motion > 0.5 mm; and 9) smooth data with a 4 mm FWHM filter to reduce partial volume effects. Once we obtained the residual time series, the time series from the seed region was extracted and we computed correlation coefficients between the seed and other voxels that were transformed to a z-score. We then used 3dttest in AFNI to compare control versus essential tremor, control versus Parkinson's disease, and essential tremor versus Parkinson's disease within each of the 3 seed regions. The P-value threshold and the extent threshold required to achieve the reported FWER were determined using AFNI's 3dClustSim program. The data were thresholded at the voxel-level at P < 0.005 and cluster size of 324, which provides P < 0.05 (corrected).
Results
Participants
Table 1 shows the demographic and clinical information for each group in the study. The univariate ANOVA for age revealed that the groups did not differ significantly (P > 0.5).
Table 1.
Subject characteristics
| Variables | Group |
||
|---|---|---|---|
| ET | PD | Control | |
| Sample size | 14 | 14 | 14 |
| Right-hand tested | 8 | 7 | 9 |
| Right-handed | 12 | 13 | 12 |
| Dominant tremor side | 6 Lt, 8 Rt | 7 Lt, 7 Rt | n/a |
| Females | 8 | 4 | 8 |
| Age (years) | 61.7 (11.0) | 64.0 (8.7) | 60.2 (9.2) |
| UPDRS | n/a | 29.6 (5.3) | n/a |
Note: Values reported are sums or mean (SD). ET, essential tremor; PD, Parkinson's disease; UPDRS, Unified Parkinson's Disease Rating Scale.
Grip Force Output
We first evaluated the mean force from the 0–3 Hz band. There was no effect of group for mean force, F2, 78 = 1.70, P = 0.190. A main effect of vision was observed for mean force, F2, 78 = 8.27, P = 0.005, such that participants produced greater force in the no-vision condition (18.35% MVC ± 1.40% MVC) compared with the full-vision condition (15.80% ± 5.61% MVC). There was not a group by vision interaction for mean force.
Next, we evaluated the standard deviation of force in the 0–3, 3–8, and 8–15 Hz bands. Since the group by vision interaction was not significant, we averaged across visual conditions. The standard deviation for each frequency band and group is shown in Figure 2. There was a main effect of standard deviation for the 0–3 Hz band, F2, 78 = 8.84, P < 0.001. Tukey's HSD post hoc test indicated that patients with essential tremor had a higher standard deviation of force compared with patients with Parkinson's disease and healthy controls (see Fig. 2). In the 3–8 Hz band, Figure 2 shows that there was a main effect of group for the standard deviation, F2, 78 = 8.72, P < 0.001. Tukey's HSD post hoc test showed that patients with essential tremor had more variable force output compared with patients with Parkinson's disease and healthy controls. In the 8–15 Hz band, there was not a main effect of group for standard deviation of force output, F2, 78 = 2.52, P = 0.09. Only the 0–3 Hz dataset revealed an effect of vision, F2, 78 = 11.06, P = 0.001, such that the standard deviation of force was higher in the no-vision condition (1.13% ± 0.67% MVC) compared with the vision condition (0.79% MVC ± 0.25% MVC). The 3–8 and 8–15 Hz bands did not have a significant effect of vision F2, 78 = 0.41, P = 0.52 and F2, 78 = 3.45, P = 0.07, respectively. Overall, these data indicate that essential tremor patients had more variable force oscillations in the 0–3 Hz and 3–8 Hz bandwidths.
Figure 2.

The standard deviation (%MVC) of force output for essential tremor patients, Parkinson's disease patients, and controls in each filtered dataset. We show 0–3, 3–8, and 8–15 Hz bands. Error bars are one standard error from the mean. Significant findings are noted with a star.
fMRI Differences Between Essential Tremor and Healthy Controls
The effect of vision was significant in regions of the visual cortex. We observed that visual cortex regions had greater BOLD signal in the left and right V3 and left and right V5 regions. No other differences were found beyond visual cortex. Since there was not an interaction between essential tremor and controls, the remainder of the results were collapsed across visual conditions.
Table 2 reports the results of the voxelwise fMRI analyses comparing essential tremor patients to healthy controls. There were 8 clusters of activity in which essential tremor patients were hyperactive compared with healthy controls. In particular, BOLD activity in the supplementary motor area (SMA) was greater for essential tremor patients compared with healthy controls. In addition to SMA, the BOLD signal was greater for essential tremor patients compared with healthy controls in contralateral middle frontal gyrus, contralateral upper limb/hand region of primary motor cortex (M1), contralateral primary sensory cortex (S1), ipsilateral dorsolateral prefrontal cortex (DLPFC), and ipsilateral dorsal premotor cortex. Conversely, the BOLD signal was greater for healthy controls than for essential tremor patients in 4 clusters (Table 2). These regions include contralateral thalamus, lateral region of M1 and somatosensory cortex, and ipsilateral lobules I–V and Crus II of the cerebellum.
Table 2.
Results of voxelwise fMRI and percent signal change analyses in ET versus controls
| Cluster no. | Side | Region(s) | Size (mm3) | Peak MNI coordinates |
Pearson r-values for correlation between PSC and SD of force |
|||||
|---|---|---|---|---|---|---|---|---|---|---|
| x | y | z | F-value | 0–3 Hz | 3–8 Hz | 8–15 Hz | ||||
| ET > controls | ||||||||||
| Cluster 1 | Ipsi | V1*, V2 | 702 | 18 | −102 | −6 | 46.32 | 0.238 | 0.567 | 0.092 |
| Cluster 2 | Con | M1* | 594 | −26 | −24 | 60 | 30.85 | 0.167 | 0.460 | −0.016 |
| Cluster 3 | Con | SMA* | 837 | −2 | −10 | 66 | 23.70 | 0.210 | 0.373 | 0.097 |
| Cluster 4 | Ipsi | DLPFC* | 756 | 36 | 14 | 38 | 19.29 | 0.309 | 0.453 | 0.157 |
| Cluster 5 | Ipsi | PMd* | 621 | 36 | −10 | 44 | 19.27 | −0.025 | 0.228 | −0.088 |
| Cluster 6 | Con | Middle frontal gyrus*, middle cingulate cortex | 621 | −30 | 24 | 36 | 18.30 | 0.224 | 0.436 | −0.022 |
| Cluster 7 | Con | S1* | 324 | −38 | −36 | 50 | 14.41 | 0.126 | 0.217 | −0.103 |
| Cluster 8 | Con | Inferior parietal lobule* | 405 | −48 | −52 | 44 | 13.98 | 0.242 | 0.366 | 0.187 |
| ET < controls | ||||||||||
| Cluster 1 | Ipsi*, Con | Cereb lobules I-IV* | 1872 | 6 | −46 | −15 | 25.13 | −0.361 | −0.159 | −0.128 |
| Ipsi | Cereb lobule V | |||||||||
| Cluster 2 | Con | M1*, S1 | 128 | −60 | −10 | 20 | 24.38 | −0.300 | −0.246 | 0.026 |
| Cluster 3 | Con | Thalamus*, caudate | 96 | −18 | −12 | 20 | 22.18 | −0.231 | −0.129 | 0.057 |
| Cluster 4 | Ipsi | Cereb crus II*, lobule VIIb | 656 | 2 | −76 | −39 | 17.41 | −0.316 | −0.128 | −0.073 |
Note: Con, contralateral; DLPFC, dorsolateral prefrontal cortex; ET, essential tremor; Ipsi, ipsilateral; M1, primary motor cortex; PMd, dorsal premotor area; PSC, percent signal change; S1, primary somatosensory cortex; SMA, supplementary motor area; V1/V2, primary and secondary visual cortex. All clusters significant at P < 0.05, corrected. Region at peak coordinate is noted with an asterisk. The bold values are P < 0.006, FDR corrected P < 0.05.
Figure 3 shows the BOLD activity for contralateral upper limb/hand M1 and ipsilateral V1 for the comparison of essential tremor patients with healthy controls. Positive values, represented by warm colors, indicate that BOLD activity was greater for essential tremor patients compared with healthy controls. The corresponding line graphs show percent signal change in these voxels as a function of time for essential tremor patients and healthy controls. The line graphs demonstrate that essential tremor patients had higher percent signal change relative to healthy controls. Figure 3 also shows reduced BOLD activity in ipsilateral cerebellar lobules I–IV for essential tremor compared with control subjects. The line graphs demonstrate that essential tremor patients had lower percent signal change relative to healthy controls.
Figure 3.
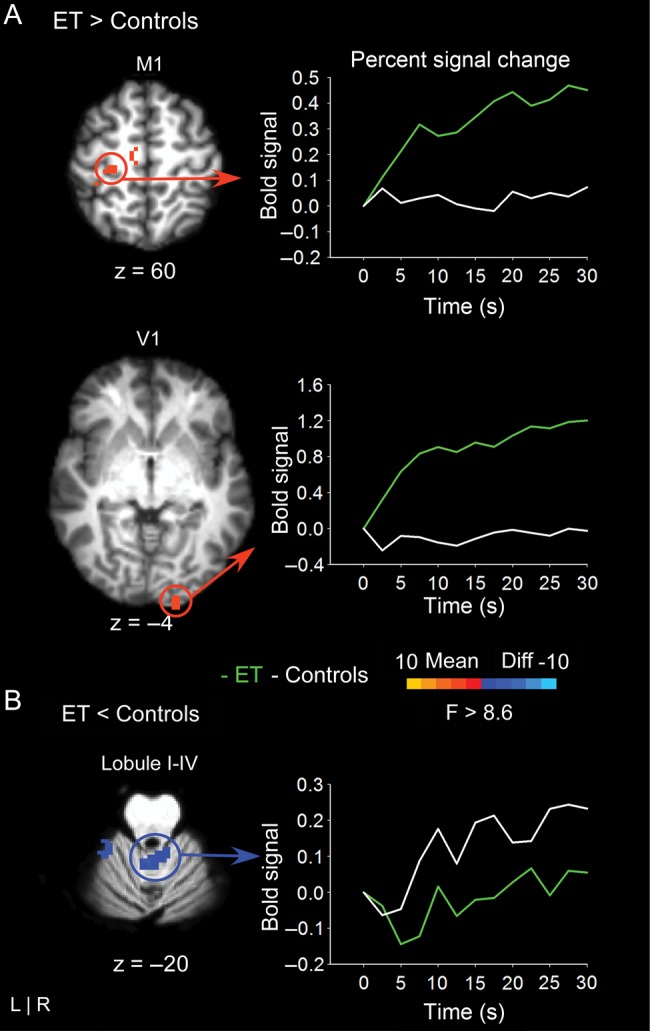
The results for the voxelwise analysis comparing essential tremor and controls are shown in 4 slices of the cortex. (A) At left, regions of hyperactivation are shown in left primary motor cortex (M1) and right primary visual cortex (V1). The corresponding line graph to the right shows that percent signal change is higher for essential tremor patients compared with controls across the time-series. The time-point “0” designates the onset of the 30-s force interval. (B) At left, regions of hypoactivation within the cerebellum are shown. The corresponding line graph to the right shows that percent signal change is lower for essential tremor patients compared with controls across the time-series. The time-point “0” designates the onset of the 30-s force interval.
Relation Between 3–8 and 0–3 Hz Force Oscillations and fMRI Activity
ROIs from the essential tremor versus controls comparison were created from the 12 clusters of activity reported in Table 2. Percent signal change was extracted from each ROI and then correlated with the standard deviation of force output in each filtered dataset across essential tremor and controls. Pearson r-values are reported in Table 2 and significant values are noted in bold font (P < 0.006; FDR corrected P < 0.05). Percent signal change in ipsilateral lobules I–V (Table 2, Cluster 1 for ET < controls) were correlated negatively with the 0–3 Hz band of force output. This was the only region significantly correlated with the 0–3 Hz band of force. The negative correlation indicates that as the BOLD signal is reduced in the cerebellum, force variability between 0 and 3 Hz increases. The 3–8 Hz band of force output was correlated positively with several areas of the cortex, including ipsilateral visual cortex, contralateral M1, SMA, ipsilateral DLPFC, contralateral middle frontal gyrus, and contralateral inferior parietal lobule (IPL) (Table 2). This indicates that when the BOLD signal is greater, that tremor amplitude is also increased. None of the hyperactive ROIs were negatively correlated with variability in force output in the 3–8 Hz band. Also, none of the 12 ROIs were correlated significantly with variability in the 8–15 Hz band.
fMRI Differences Between Essential Tremor and Parkinson's Disease
The data in Table 3 and Figure 4 is for vision and no vision combined since there was no interaction between group and vision. The effect of vision was significant in regions of the visual cortex, and we observed that visual cortex regions had greater BOLD signal in bilateral V3 and V5 with vision. Table 3 reports the results from the voxelwise fMRI analysis comparing BOLD activity in essential tremor and Parkinson's disease patients. In all cortical, basal ganglia, and cerebellar regions with differences between groups, the BOLD signal was greater for essential tremor patients compared with Parkinson's disease patients. This pattern of hyperactivity is shown in Figure 4 in several slices of the cortex and subcortex.
Table 3.
Group fMRI activation differences in ET versus PD
| Cluster no. | Side | Region(s) | Size (mm3) | Peak MNI coordinates |
|||
|---|---|---|---|---|---|---|---|
| x | y | z | F-value | ||||
| ET > PD | |||||||
| Cluster 1 | Ipsi | M1* | 432 | 34 | −12 | 66 | 40.21 |
| Cluster 2 | Ipsi | Cereb lobules VI*, V | 2592 | 20 | −60 | −25 | 39.68 |
| Cluster 3 | Con | Putamen*, GPe, insula, middle frontal gyrus, inferior frontal gyrus | 3807 | −30 | −4 | −4 | 37.19 |
| Cluster 4 | Ipsi | DLPFC*, anterior cingulate cortex, superior medial gyrus | 3510 | 28 | 38 | 26 | 33.35 |
| Cluster 5 | Con | SMA* | 351 | −8 | −18 | 56 | 33.00 |
| Cluster 6 | Con | GPe*, GPi, putamen, STN, thalamus | 1674 | −30 | −10 | −6 | 29.73 |
| Cluster 7 | Ipsi*, Con | Pre-SMA* | 1350 | 6 | 8 | 50 | 29.36 |
| Cluster 8 | Con | Middle cingulate cortex*, anterior cingulate cortex, PMd, SMA, pre-SMA | 4185 | −18 | 24 | 30 | 29.35 |
| Cluster 9 | Con | PMd*, pre-SMA | 810 | −18 | −4 | 62 | 28.25 |
| Cluster 10 | Con | Caudate* | 351 | −8 | 6 | 20 | 27.76 |
| Cluster 11 | Ipsi | Putamen*, caudate, insula, inferior frontal gyrus | 3942 | 24 | 2 | −10 | 27.25 |
| Cluster 12 | Ipsi | Middle temporal gyrus (V5)* | 486 | 46 | −70 | 8 | 26.64 |
| Cluster 13 | Con | S1*, M1 | 3834 | −48 | −36 | 50 | 26.22 |
| Cluster 14 | Con | Frontopolar cortex* | 3078 | −30 | 48 | 12 | 25.68 |
| Cluster 15 | Con | Inferior frontal gyrus* | 324 | −42 | 36 | 6 | 23.19 |
| Cluster 16 | Ipsi | Inferior parietal lobule* | 459 | 48 | −42 | 38 | 23.71 |
| Cluster 17 | Ipsi | PMv*, PMd, DLPFC | 1998 | 48 | 8 | 38 | 22.40 |
| Cluster 18 | Con | WM*, putamen | 567 | −26 | 6 | 18 | 21.00 |
| Cluster 19 | Ipsi | Thalamus*, GPe | 486 | 16 | −18 | 8 | 19.78 |
| Cluster 20 | Ipsi | GPi*, GPe, thalamus | 432 | 10 | −4 | 0 | 19.58 |
| Cluster 21 | Ipsi | Middle temporal gyrus* | 351 | 52 | −36 | 6 | 19.06 |
| Cluster 22 | Ipsi | M1*, PMd | 324 | 36 | −10 | 48 | 18.36 |
| Cluster 23 | Con | Substantia nigra* | 351 | −8 | −22 | −12 | 17.36 |
| Cluster 24 | Con | Angular gyrus* | 513 | −38 | −58 | 32 | 17.20 |
| Cluster 25 | Con | Inferior parietal lobule* | 486 | −32 | −48 | 50 | 16.49 |
| Cluster 26 | Ipsi | S1* | 351 | 48 | −22 | 30 | 15.36 |
Note; Con, contralateral; DLPFC, dorsolateral prefrontal cortex; GPe, external globus pallidus; GPi, internal globus pallidus; Ipsi, ipsilateral; M1, primary motor cortex; PD, Parkinson's disease; PMd, dorsal premotor area; PMv, ventral premotor area; S1, primary somatosensory cortex; SMA, supplementary motor area; STN, subthalamic nucleus. All clusters significant at P < 0.05, corrected. Region at peak coordinate is noted with an asterisk.
Figure 4.
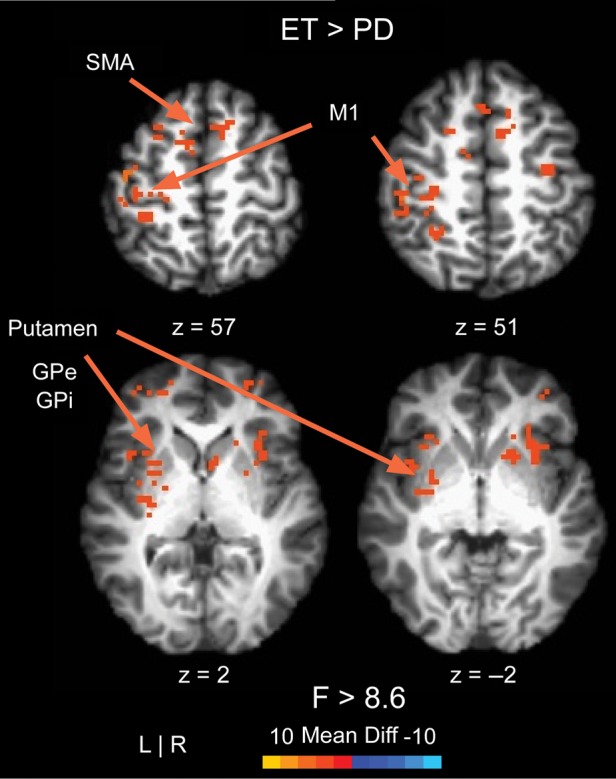
The results for the voxelwise analysis comparing essential tremor and Parkinson's disease patients are shown in 4 slices of the cortex and subcortex. All voxels with differences between groups showed higher BOLD signal for essential tremor patients compared with Parkinson's disease patients.
fMRI Differences Between Healthy Controls and Parkinson's Disease
The data in Table 4 is for vision and no vision combined since there was no interaction between group and vision. The effect of vision was significant in regions of the visual cortex. We observed that visual cortex had greater BOLD signal in the bilateral V3 and V5 with vision. Table 4 reports the results of the voxelwise fMRI analysis comparing BOLD activity in Parkinson's disease patients with controls. In all cortical, basal ganglia, and cerebellar regions with differences between groups, the BOLD signal was greater for controls compared with Parkinson's disease patients. This indicates a distributed pattern of hypoactivity that is specific to Parkinson's disease patients. The results are consistent with our previous work, in a different sample of patients and healthy controls, showing that Parkinson's disease patients are characterized by widespread hypoactivity in the cortex and basal ganglia compared with controls in task-based fMRI (Spraker et al. 2010).
Table 4.
Group fMRI activation differences in controls versus PD
| Cluster no. | Side | Region(s) | Size (mm3) | Peak MNI coordinates |
|||
|---|---|---|---|---|---|---|---|
| x | y | z | F-value | ||||
| Controls > PD | |||||||
| Cluster 1 | Con | M1*, S1 | 1431 | −36 | −24 | 60 | 48.86 |
| Cluster 2 | Ipsi | Putamen*, caudate, GPe, thalamus, amygdala, hippocampus, insula, inferior frontal gyrus | 7209 | 24 | 2 | −10 | 45.57 |
| Cluster 3 | Con | S1* | 351 | −50 | −28 | 54 | 44.81 |
| Cluster 4 | Con | Putamen*, caudate, GPe, GPi, thalamus, amygdala, hippocampus, insula, S1, M1, rolandic operculum, supramarginal gyrus, superior temporal gyrus, frontopolar cortex | 13 176 | −26 | 2 | 6 | 42.46 |
| Cluster 5 | Ipsi | Superior parietal lobule* | 378 | 22 | −42 | 60 | 33.50 |
| Cluster 6 | Ipsi | Cereb lobules VI*, I–IV, V, crus I | 6736 | 16 | −58 | −27 | 31.01 |
| Median | Cereb vermis VI | ||||||
| Con | Cereb lobules I–IV | ||||||
| Cluster 7 | Median | Cereb vermis VIIb*, VIIIa | 2128 | 2 | −70 | −35 | 29.63 |
| Ipsi | Cereb crus II, lobule VIIb | ||||||
| Cluster 8 | Con | Cuneus*, precuneus | 405 | −12 | −70 | 36 | 27.83 |
| Cluster 9 | Con | Fusiform (V4)* | 351 | −30 | −72 | −12 | 25.27 |
| Cluster 10 | Con | Cereb lobule VI*, crus I | 320 | −38 | −40 | −35 | 24.28 |
| Cluster 11 | Con | Cereb lobule VI* | 2056 | −30 | −52 | −23 | 22.68 |
| Cluster 12 | Con | Caudate* | 567 | −14 | 20 | 2 | 21.14 |
| Cluster 13 | Con | M1* | 324 | −38 | −18 | 42 | 20.90 |
| Cluster 14 | Ipsi | Inferior occipital gyrus (V3v/V4)* | 513 | 24 | −90 | −12 | 20.51 |
| Cluster 15 | Ipsi | Middle temporal gyrus*, superior temporal gyrus | 1296 | 54 | −52 | 14 | 20.46 |
| Cluster 16 | Con | Superior parietal lobule*, S1 | 864 | −30 | −46 | 48 | 20.43 |
| Cluster 17 | Ipsi | Inferior occipital gyrus*, fusiform gyrus | 486 | 34 | −72 | −10 | 20.16 |
| Cluster 18 | Con | Insula* | 486 | −44 | 8 | 0 | 19.78 |
| Cluster 19 | Con | PMd* | 324 | −36 | 6 | 44 | 18.22 |
| Cluster 20 | Ipsi | PMv*, PMd | 999 | 34 | −10 | 32 | 17.45 |
| Cluster 21 | Ipsi | S1*, M1 | 648 | 58 | −18 | 24 | 17.35 |
| Cluster 22 | Con | Middle cingulate cortex* | 324 | −8 | 14 | 36 | 16.63 |
| Cluster 23 | Con | Frontopolar cortex | 405 | −30 | 36 | 24 | 16.10 |
| Cluster 24 | Ipsi | Cereb crus II* | 544 | 26 | −84 | −43 | 14.65 |
| Cluster 25 | Ipsi | Supramarginal gyrus* | 324 | 46 | −24 | 24 | 14.08 |
| Cluster 26 | Con*, Ipsi | Cuneus* | 324 | 0 | −84 | 38 | 13.88 |
Note: Con, contralateral; GPe, external globus pallidus; GPi, internal globus pallidus; Ipsi, ipsilateral; M1, primary motor cortex; PD, Parkinson’s disease; PMd, dorsal premotor area; PMv, ventral premotor area; S1, primary somatosensory cortex; SMA, supplementary motor area. All clusters significant at P < 0.05, corrected. Region at peak coordinate is noted with an asterisk.
Task-based Functional Connectivity in Essential Tremor, Parkinson's Disease, and Healthy Controls
Figure 5 and Table 5 shows the findings from the task-based functional connectivity analysis with 3 seed regions for the motor cortex. In Figure 5A (top panel), we show the results for the ipsilateral cerebellum seed in lobules I–V. This seed revealed increased functional connectivity in healthy controls compared with patients with essential tremor throughout contralateral M1, SMA, and contralateral and ipsilateral dorsal premotor cortex (Fig. 5A). There were no significant differences in functional connectivity between healthy controls and patients with Parkinson's disease; however, patients with essential tremor had reduced functional connectivity compared with patients with Parkinson's disease for contralateral M1. Figure 5B (middle panel) shows the results for the left M1 seed. This analysis demonstrated that essential tremor patients have increased functional connectivity compared with healthy controls in contralateral M1, SMA, pre-SMA, and contralateral and ipsilateral dorsal premotor cortex. In a direct comparison of functional activity in patients with essential tremor and Parkinson's disease, we observed increased functional connectivity in patients with essential tremor in the SMA. As shown in Figure 5C (bottom panel), functional connectivity increased for essential tremor patients compared with healthy controls in contralateral and ipsilateral M1, SMA, and contralateral and ipsilateral dorsal premotor cortex. There were no differences observed for healthy controls compared with Parkinson's disease. Essential tremor patients had increased functional connectivity in contralateral M1 compared with Parkinson's disease. Taken together, these findings demonstrate that patients with essential tremor have increased cortico-cortical functional connectivity compared with healthy controls and patients with Parkinson's disease. Further, patients with essential tremor have reduced cerebellar-cortical functional connectivity compared with healthy controls and patients with Parkinson's disease.
Figure 5.

Functional connectivity for a seed in right lobule I–V (A), left M1 (B), and SMA (C). Comparisons of functional connectivity were made between controls versus essential tremor, controls versus Parkinson's disease, and essential tremor versus Parkinson's disease.
Table 5.
Group fMRI connectivity results for each seed region
| Cluster no. | Side | Region(s) | Size (mm3) | Peak MNI coordinates |
|||
|---|---|---|---|---|---|---|---|
| x | y | z | z-score | ||||
| Right cereb lobule I–IV seed | |||||||
| Control versus ET | |||||||
| Cluster 1 | Con | PMv* | 675 | −54 | 15 | 30 | 5.20 |
| Cluster 2 | Con | M1* | 648 | −36 | −24 | 60 | 4.68 |
| Cluster 3 | Con | PMd* | 459 | −36 | −6 | 63 | 4.26 |
| Cluster 4 | Ipsi | PMd* | 378 | 24 | 9 | 63 | 4.21 |
| Cluster 5 | Con | M1* | 324 | −45 | −9 | 57 | 4.17 |
| Cluster 6 | Ipsi*, Con | SMA | 351 | 3 | −18 | 66 | −4.20 |
| Con | M1 | ||||||
| ET versus PD | |||||||
| Cluster 1 | Con | M1* | 351 | −36 | −27 | 66 | −3.40 |
| Left M1 seed | |||||||
| Control versus ET | |||||||
| Cluster 1 | Ipsi*, Con | Pre-SMA*, SMA | 7533 | 12 | 12 | 51 | −6.23 |
| Con | PMd | ||||||
| Cluster 2 | Con | S1* | 324 | −48 | −27 | 48 | −5.33 |
| Cluster 3 | Con | M1*, PMd | 1107 | −33 | −12 | 54 | −4.88 |
| Cluster 4 | Con | S1*, M1 | 1485 | −30 | −30 | 51 | −4.83 |
| Cluster 5 | Con | S1* | 324 | −54 | −27 | 42 | −4.35 |
| Control versus PD | |||||||
| Cluster 1 | Con | M1* | 405 | −51 | −12 | 54 | −3.88 |
| ET versus PD | |||||||
| Cluster 1 | Con | SMA* | 351 | −6 | −12 | 72 | 4.49 |
| Cluster 2 | Ipsi*, Con | Pre-SMA | 540 | 3 | 12 | 51 | 4.34 |
| SMA seed | |||||||
| Control versus ET | |||||||
| Cluster 1 | Ipsi | PMv* | 351 | 51 | 3 | 24 | 5.00 |
| Cluster 2 | Con | PMd*, pre-SMA, SMA | 1890 | −18 | 6 | 51 | −5.49 |
| Cluster 3 | Con | M1* | 459 | −48 | −6 | 63 | −4.98 |
| Cluster 4 | Ipsi | M1*, PMd | 540 | 33 | −12 | 45 | −4.62 |
| Cluster 5 | Con | SMA* | 837 | −9 | −15 | 60 | −4.54 |
| ET versus PD | |||||||
| Cluster 1 | Con | M1*, S1 | 594 | −30 | −30 | 57 | 4.32 |
Note : Con, contralateral; ET, essential tremor; Ipsi, ipsilateral; M1, primary motor cortex; PMd, dorsal premotor area; PMv, ventral premotor area; S1, primary somatosensory cortex; SMA, supplementary motor area. All clusters significant at P < 0.05, corrected. Region at peak coordinate is noted with an asterisk. Only significant effects are reported in the table.
Discussion
The current study provides 4 novel findings about brain activity and force oscillations in patients with essential tremor. First, BOLD activity was increased in essential tremor patients compared with healthy controls in multiple regions of the cortex including contralateral upper limb/hand M1 and SMA, and BOLD activity in the cortex was correlated positively with oscillations in the 3–8 Hz force tremor. Second, BOLD activity was reduced in essential tremor patients compared with healthy controls in ipsilateral cerebellum (lobule I-V), and the BOLD activity in ipsilateral cerebellar lobules I–V was correlated negatively with 0–3 Hz force oscillations. Third, when compared with patients with Parkinson's disease, patients with essential tremor had greater BOLD activity in M1, SMA, and the basal ganglia. Fourth, during the force task patients with essential tremor had reduced functional connectivity between the cerebellum and M1 compared with healthy controls and patients with Parkinson's disease. In contrast, patients with essential tremor had increased functional connectivity between SMA and M1 when compared with healthy controls and patients with Parkinson's disease. These findings demonstrate that specific cerebellar and cortical regions relate to 0–3 and 3–8 Hz force oscillations in essential tremor. Further, during the force control task, cortico-cortical functional connectivity is increased in essential tremor, whereas cerebellar-cortical functional connectivity is reduced.
Increased BOLD Activity in the Cortex in Essential Tremor Compared with Healthy Controls
We identified increased BOLD activity in patients with essential tremor relative to healthy controls in the upper limb and hand regions of M1. Further, the BOLD signal in upper limb and hand region of M1 was correlated positively with 3–8 Hz force oscillations. We found reduced activity in M1 and S1 for essential tremor relative to controls located more laterally in the cortex, but this region of hypoactivity was not related to 3–8 Hz force oscillations. The findings in the upper limb and hand region of M1 are interesting because previous studies report that the coherence (using EEG and MEG) between M1 and EMG occurs at tremor frequencies, which suggests that M1 is important in transmitting neural signals ultimately responsible for tremor (Hellwig et al. 2001, 2003; Raethjen et al. 2007; Schnitzler et al. 2009). This is the first study to show a relation between the amplitude of the BOLD signal and 3–8 Hz oscillations in tremor in patients with essential tremor.
Increased BOLD activity in patients with essential tremor was not confined to M1, but was also found in SMA and other cortical regions including V1, DLPFC, and IPL. Further, the amplitude of the BOLD signal was positively correlated with 3–8 Hz force tremor oscillations. Prior anatomical studies in nonhuman primates indicate that many of these regions are anatomically connected. For instance, SMA is connected with M1 (Dum and Strick, 1991, 1996), and SMA and M1 both project directly to the spinal cord and thus have the potential to generate and participate in the control of movement (Dum and Strick, 1991, 1996, 2002; He et al. 1995). The IPL region is consistent with prior studies of grasping (Prodoehl et al. 2009), which suggests that the tremor occurring in essential tremor could be related to grasp-related neurons in IPL. Also, since the task used visual feedback the hyperactivity identified for visual cortex could be related to increased visual motion on the monitor—a consequence of increased oscillations of the force output. Further, it is possible that visual cortex activity could affect M1 and IPL activity. Future work is needed to address this issue. Since the cortical structures for M1, V1, DLPFC, and IPL had a higher BOLD signal when the force tremor was increased, this may indicate that neural firing in the cortex is elevated when action tremor occurs. This could have clinical importance because it suggests that to alter tremor, cortical neurons may need to be inhibited. Problems with inhibition within the cortex are consistent with the GABA (γ-aminobutyric) hypothesis for essential tremor such that GABA related inhibition could be impaired in several areas of the cortex (Helmich et al. 2013).
Reduced BOLD Activity in the Cerebellum in Essential Tremor Compared with Healthy Controls
It was observed that ipsilateral cerebellar lobules I–V had reduced BOLD activity in essential tremor compared with controls. Cerebellar Lobules IV and V are involved in the production of overt goal-directed movements (Stoodley and Schmahmann 2010; Stoodley 2012) and are anatomically (Kelly and Strick 2003) and functionally (O'Reilly et al. 2010; Buckner et al. 2011) connected to M1. The finding that percent signal change in the ipsilateral lobules I–V of the cerebellum was correlated negatively with 0–3 Hz oscillations suggests that these regions of the brain relate to slow oscillations in force. Prior studies have suggested that these slow oscillations of force and movement output relate to online sensory guidance and motor corrections (Kunesch et al. 1989; Freund and Hefter 1993; Miall 1996; Slifkin et al. 2000). Our interpretation of this finding is that the inability to activate cerebellar neurons from the rest to the task condition (i.e., BOLD signal) limits the ability to modulate force and reduce force oscillations between 0 and 3 Hz. The cerebellum has been previously linked to closed-loop feedback based mechanisms in motor control for healthy individuals (Seidler et al. 2004; Diedrichsen et al. 2005; Vaillancourt et al. 2006) and these new findings for essential tremor extend this prior work. The slow 0–3 Hz oscillations are more closely linked to ataxic, irregular force output whereas the 3–8 Hz force oscillations are more consistent with the classic kinetic tremor of ET. These findings suggest that specific frequencies of force output are correlated with specific regions of the motor circuit that are impaired in essential tremor.
The finding that areas in the cerebellum have a reduced BOLD signal that correlates negatively with 0–3 Hz force oscillations is important because the cerebellum is the most consistent area of pathology in essential tremor. Post-mortem studies report degenerative changes in the cerebellum of essential tremor brains, including Purkinje cell axonal and dendritic swellings (Louis et al. 2006, 2011; Yu et al. 2012), Purkinje cell loss (Louis et al. 2006; Axelrad et al. 2008; Kuo et al. 2011), heterotopically displaced Purkinje cells (Kuo et al. 2011), and structural remodeling of basket cells (Erickson-Davis et al. 2010). It is important to note that not all studies have identified these same postmortem findings and there is controversy as to whether there is a loss of Purkinje cells in essential tremor (Rajput et al. 2012). Prior studies applying TMS to the cerebellar cortex of healthy adults report that stimulating the cerebellum prior to stimulating the M1 reduces the corticospinal excitability (Ugawa et al. 1995; Baarbe et al. 2014). When applying TMS over the cerebellum in patients with essential tremor, stimulation did not reset tremor and cerebellar inhibition of M1 was normal (Pinto et al. 2003). The authors concluded that any abnormal oscillatory brain activity in essential tremor does not originate in the cerebellar cortex. The current work is consistent with this interpretation, since we found that BOLD activity in the cerebellum of patients with essential tremor was only correlated with the 0–3 Hz oscillations in force and not the 3–8 Hz oscillations associated with essential tremor.
The current finding that essential tremor is characterized by a hyperactive cortex and a hypoactive cerebellum is consistent with predictions from the study by Jenkins et al. (1993), which found increased resting rCBF in the cerebellum of essential tremor patients. Increased rCBF at rest could partially explain the reduced BOLD signal during the force control task in essential tremor. It is also possible that the continued increase in rCBF at rest damages the Purkinje cells over time and causes an abnormal BOLD signal during motor-task-based fMRI. An additional interpretation suggests a compensatory mechanism in essential tremor, such that the cerebellum becomes less active during force production to compensate for an overactive M1. The opposite scenario is also possible, such that the cortex could have increased neural activity to compensate for the reduced activity in the cerebellum. In line with a compensatory hypothesis, we found that the functional connectivity between the cerebellum and M1 was reduced in patients with essential tremor, which suggests the cerebellum and M1 are not functioning together as they would in a healthy individual. These findings extend recent work showing that resting state functional connectivity between the cortex and cerebellum relate to behavioral changes in older adults (Bernard et al. 2012).
Diffuse Hyperactivity in Essential Tremor Compared with Parkinson's Disease
A novel finding in this study was that the essential tremor brain was hyperactive relative to the Parkinson's disease brain in the cortex, basal ganglia, thalamus, and cerebellum. It could be argued that the number of females and males could have influenced the pattern of findings since the Parkinson's disease group had 10 males compared with 6 in the essential tremor group. However, the literature demonstrates that males have either an increased BOLD signal or similar BOLD signal compared with females during memory, attention, and motor tasks (Bell et al. 2006; Christova et al. 2008), as such, this would counteract rather than facilitate the current findings.
An additional finding of importance was that SMA-M1 functional connectivity was increased in patients with essential tremor compared with healthy controls and patients with Parkinson's disease. Recent models of essential tremor suggest that an oscillating network within the cortex may be responsible for tremor (Schnitzler et al. 2009; Raethjen and Deuschl 2012). The current finding that cortico-cortical functional connectivity is increased between SMA and M1 in essential tremor supports these models. Our findings also provide new evidence that functional connectivity between the cerebellum and M1 is reduced in essential tremor during a motor task.
We did not find differences in brain activity between patients with essential tremor and healthy controls in the basal ganglia. This is important because the current study and previous studies using a similar force task consistently report reduced BOLD activity in Parkinson's disease compared with healthy controls in the caudate, putamen, and globus pallidus (Prodoehl et al. 2010; Spraker et al. 2010). Moreover, Prodoehl et al. (2010) demonstrated that BOLD activity in the internal globus pallidus was significantly correlated with the severity of Parkinson's tremor. In a different study comparing healthy controls, patients with tremor dominant Parkinson's disease, and patients with nontremor dominant Parkinson's disease, it was shown that patients with tremor dominant Parkinson's disease had different BOLD activity in the internal globus pallidus and prefrontal cortex compared with patients with nontremor dominant Parkinson's disease (Prodoehl et al. 2013). Further, Prodoehl et al. (2013) did not find differences in the cerebellum or motor cortex between patients with tremor dominant and patients with nontremor dominant Parkinson's disease.
Conclusions
The pathology of essential tremor is often attributed to a central neuronal oscillator (e.g., Raethjen and Deuschl 2012). The idea that a distributed network of regions is involved in the generation of essential tremor is consistent with the current findings, which show patterns of hyperactivity in the cortex and hypoactivity in the cerebellum specific to patients with essential tremor. We found that 3–8 Hz force tremor oscillations correlated positively with M1 activity, whereas 0–3 Hz force oscillations correlated negatively with cerebellar activity. Further, we found increased cortico-cortical functional connectivity and reduced cerebellar-cortical connectivity in essential tremor. These findings support the idea that essential tremor involves a distinct brain network from Parkinson's disease.
Funding
This work was supported by the National Institutes of Health [F32 NS075574 to K.A.N., R01 NS075012, R01 NS052318, and R01 NS058487 to D.E.V.].
Notes
We thank the participants for their time and commitment to this research. We thank Michael Flannery and Hagai Ganin for their assistance with MR data collection. Conflict of interest: Dr Kristina A. Neely received grant support from NIH. Mr Ajay Kurani has no conflicts of interest to report. Dr Priyank Shukla has no conflicts of interest to report. Dr Peggy J. Planetta has no conflicts of interest to report. Dr Aparna W. Shukla has no conflicts of interest to report. Dr Jennifer G. Goldman receives grant support from NIH, the Michael J. Fox Foundation, and the Parkinson's disease Foundation. Dr Goldman is the site-PI for a clinical research trial of Teva. Dr Goldman has received honoraria in the last 12 months from American Academy of Neurology, Movement Disorder Society, Merz, Pfizer, Teva, Johns Hopkins Dystonia and Spasticity. Dr Daniel M. Corcos receives grant support from NIH and Michael J. Fox, and receives lecture and reviewer fees from NIH. Dr Michael S. Okun serves as a consultant for the National Parkinson Foundation, and has received research grants from NIH, NPF, the Michael J. Fox Foundation, the Parkinson Alliance, Smallwood Foundation, the Bachmann-Strauss Foundation, and the UF Foundation. Dr Okun has previously received honoraria, but in the past >36 months has received no support from industry including travel. Dr Okun has received royalties for publications with Demos, Manson, Amazon, Smashwords, and Cambridge (movement disorders books). Dr Okun has participated in CME activities on movement disorders sponsored by the USF CME office, PeerView, Prime, and by Vanderbilt University. The institution and not Dr Okun receives grants from Medtronic and ANS/St. Jude, and the PI has no financial interest in these grants. Dr Okun has participated as a site PI and/or co-I for several NIH, foundation, and industry sponsored trials over the years but has not received honoraria. Dr David E. Vaillancourt receives grant support from NIH, Michael J. Fox, and consults for projects at UT Southwestern Medical Center, University of Illinois at Chicago, and Great Lakes NeuroTechnologies. He is co-founder of Neuroimaging Solutions, LLC.
References
- Axelrad JE, Louis ED, Honig LS, Flores I, Ross GW, Pahwa R, Lyons KE, Faust PL, Vonsattel JP. 2008. Reduced Purkinje cell number in essential tremor: a postmortem study. Arch Neurol. 65:101–107. [DOI] [PMC free article] [PubMed] [Google Scholar]
- Baarbe J, Yielder P, Daligadu J, Behbahani H, Haavik H, Murphy B. 2014. A novel protocol to investigate motor training-induced plasticity and sensorimotor integration in the cerebellum and motor cortex. J Neurophysiol. 111:715–721. [DOI] [PubMed] [Google Scholar]
- Bell EC, Willson MC, Wilman AH, Dave S, Silverstone PH. 2006. Males and females differ in brain activation during cognitive tasks. Neuroimage. 30:529–538. [DOI] [PubMed] [Google Scholar]
- Bernard JA, Peltier SJ, Benson BL, Wiggins JL, Jaeggi SM, Buschkuehl M, Jonides J, Monk CS, Seidler RD. 2014. Dissociable functional networks of the human dentate nucleus. Cereb Cortex. 24:2151–2159. [DOI] [PMC free article] [PubMed] [Google Scholar]
- Bernard JA, Seidler RD, Hassevoort KM, Benson BL, Welsh RC, Wiggins JL, Jaeggi SM, Buschkuehl M, Monk CS, Jonides J, et al. 2012. Resting state cortico-cerebellar functional connectivity networks: a comparison of anatomical and self-organizing map approaches. Front Neuroanat. 6:31. [DOI] [PMC free article] [PubMed] [Google Scholar]
- Buckner RL, Krienen FM, Castellanos A, Diaz JC, Yeo BT. 2011. The organization of the human cerebellum estimated by intrinsic functional connectivity. J Neurophysiol. 106:2322–2345. [DOI] [PMC free article] [PubMed] [Google Scholar]
- Cabeza R, Locantore JK, Anderson ND. 2003. Lateralization of prefrontal activity during episodic memory retrieval: evidence for the production-monitoring hypothesis. J Cogn Neurosci. 15:249–259. [DOI] [PubMed] [Google Scholar]
- Christova PS, Lewis SM, Tagaris GA, Ugurbil K, Georgopoulos AP. 2008. A voxel-by-voxel parametric fMRI study of motor mental rotation: hemispheric specialization and gender differences in neural processing efficiency. Exp Brain Res. 189:79–90. [DOI] [PubMed] [Google Scholar]
- Culham JC, Danckert SL, DeSouza JF, Gati JS, Menon RS, Goodale MA. 2003. Visually guided grasping produces fMRI activation in dorsal but not ventral stream brain areas. Exp Brain Res. 153:180–189. [DOI] [PubMed] [Google Scholar]
- Deuschl G, Bain P, Brin M. 1998. Consensus statement of the movement disorder society on tremor. Ad Hoc Scientific Committee Mov Disord. 13(Suppl 3):2–23. [DOI] [PubMed] [Google Scholar]
- Deuschl G, Elble RJ. 2000. The pathophysiology of essential tremor. Neurology. 54:S14–S20. [PubMed] [Google Scholar]
- Diedrichsen J. 2006. A spatially unbiased atlas template of the human cerebellum. Neuroimage. 33:127–138. [DOI] [PubMed] [Google Scholar]
- Diedrichsen J, Balsters JH, Flavell J, Cussans E, Ramnani N. 2009. A probabilistic MR atlas of the human cerebellum. Neuroimage. 46:39–46. [DOI] [PubMed] [Google Scholar]
- Diedrichsen J, Hashambhoy Y, Rane T, Shadmehr R. 2005. Neural correlates of reach errors. J Neurosci. 25:9919–9931. [DOI] [PMC free article] [PubMed] [Google Scholar]
- Dum RP, Strick PL. 1991. The origin of corticospinal projections from the premotor areas in the frontal lobe. J Neurosci. 11:667–689. [DOI] [PMC free article] [PubMed] [Google Scholar]
- Dum RP, Strick PL. 1996. Spinal cord terminations of the medial wall motor areas in macaque monkeys. J Neurosci. 16:6513–6525. [DOI] [PMC free article] [PubMed] [Google Scholar]
- Dum RP, Strick PL. 2002. Motor areas in the frontal lobe of the primate. Physiol Behav. 77:677–682. [DOI] [PubMed] [Google Scholar]
- Erickson-Davis CR, Faust PL, Vonsattel JP, Gupta S, Honig LS, Louis ED. 2010. “Hairy baskets” associated with degenerative Purkinje cell changes in essential tremor. J Neuropathol Exp Neurol. 69:262–271. [DOI] [PMC free article] [PubMed] [Google Scholar]
- Freund H, Hefter H. 1993. The role of Basal Ganglia in rhythmic movement. In: Narabayashi H, Nagatsu T, Yanagisawa N, Mizuno Y, editors. Advances in Neurology. New York: Raven Press Ltd; p. 88–92. [PubMed] [Google Scholar]
- Hellwig B, Haussler S, Schelter B, Lauk M, Guschlbauer B, Timmer J, Lucking CH. 2001. Tremor-correlated cortical activity in essential tremor. Lancet. 357:519–523. [DOI] [PubMed] [Google Scholar]
- Hellwig B, Schelter B, Guschlbauer B, Timmer J, Lucking CH. 2003. Dynamic synchronisation of central oscillators in essential tremor. Clin Neurophysiol. 114:1462–1467. [DOI] [PubMed] [Google Scholar]
- Helmich RC, Toni I, Deuschl G, Bloem BR. 2013. The pathophysiology of essential tremor and Parkinson’s tremor. Curr Neurol Neurosci Rep. 13:378. [DOI] [PubMed] [Google Scholar]
- He SQ, Dum RP, Strick PL. 1995. Topographic organization of corticospinal projections from the frontal lobe: motor areas on the medial surface of the hemisphere. J Neurosci. 15:3284–3306. [DOI] [PMC free article] [PubMed] [Google Scholar]
- Hughes AJ, Daniel SE, Lees AJ. 2001. Improved accuracy of clinical diagnosis of Lewy body Parkinson's disease. Neurology. 57:1497–1499. [DOI] [PubMed] [Google Scholar]
- Jenkins IH, Bain PG, Colebatch JG, Thompson PD, Findley LJ, Frackowiak RS, Marsden CD, Brooks DJ. 1993. A positron emission tomography study of essential tremor: evidence for overactivity of cerebellar connections. Ann Neurol. 34:82–90. [DOI] [PubMed] [Google Scholar]
- Kelly RM, Strick PL. 2003. Cerebellar loops with motor cortex and prefrontal cortex of a nonhuman primate. J Neurosci. 23:8432–8444. [DOI] [PMC free article] [PubMed] [Google Scholar]
- Kunesch E, Binkofski F, Freund HJ. 1989. Invariant temporal characteristics of manipulative hand movements. Exp Brain Res. 78:539–546. [DOI] [PubMed] [Google Scholar]
- Kuo SH, Erickson-Davis C, Gillman A, Faust PL, Vonsattel JP, Louis ED. 2011. Increased number of heterotopic Purkinje cells in essential tremor. J Neurol Neurosurg Psychiatry. 82:1038–1040. [DOI] [PMC free article] [PubMed] [Google Scholar]
- Louis ED. 2011. Essential tremor. Handb Clin Neurol. 100:433–448. [DOI] [PubMed] [Google Scholar]
- Louis ED. 2009. Essential tremors: a family of neurodegenerative disorders? Arch Neurol. 66:1202–1208. [DOI] [PMC free article] [PubMed] [Google Scholar]
- Louis ED, Barnes L, Albert SM, Cote L, Schneier FR, Pullman SL, Yu Q. 2001. Correlates of functional disability in essential tremor. Mov Disord. 16:914–920. [DOI] [PubMed] [Google Scholar]
- Louis ED, Faust PL, Vonsattel JP. 2011. Purkinje cell loss is a characteristic of essential tremor. Parkinsonism Relat Disord. 17:406–409. [DOI] [PMC free article] [PubMed] [Google Scholar]
- Louis ED, Faust PL, Vonsattel JP, Honig LS, Rajput A, Robinson CA, Pahwa R, Lyons KE, Ross GW, Borden S, et al. 2007. Neuropathological changes in essential tremor: 33 cases compared with 21 controls. Brain. 130:3297–3307. [DOI] [PubMed] [Google Scholar]
- Louis ED, Faust PL, Vonsattel JP, Honig LS, Rajput A, Robinson CA, Rajput A, Pahwa R, Lyons KE, Ross GW, et al. 2007. Neuropathological changes in essential tremor: 33 cases compared with 21 controls. Brain. 130:3297–3307. [DOI] [PubMed] [Google Scholar]
- Louis ED, Ottman R, Hauser WA. 1998. How common is the most common adult movement disorder? estimates of the prevalence of essential tremor throughout the world. Mov Disord. 13:5–10. [DOI] [PubMed] [Google Scholar]
- Louis ED, Vonsattel JP, Honig LS, Lawton A, Moskowitz C, Ford B, Frucht S. 2006. Essential tremor associated with pathologic changes in the cerebellum. Arch Neurol. 63:1189–1193. [DOI] [PubMed] [Google Scholar]
- Mayka MA, Corcos DM, Leurgans SE, Vaillancourt DE. 2006. Three-dimensional locations and boundaries of motor and premotor cortices as defined by functional brain imaging: a meta-analysis. Neuroimage. 31:1453–1474. [DOI] [PMC free article] [PubMed] [Google Scholar]
- Miall RC. 1996. Task-dependent changes in visual feedback control: a frequency analysis of human manual tracking. J Mot Behav. 28:125–135. [DOI] [PubMed] [Google Scholar]
- O'Reilly JX, Beckmann CF, Tomassini V, Ramnani N, Johansen-Berg H. 2010. Distinct and overlapping functional zones in the cerebellum defined by resting state functional connectivity. Cereb Cortex. 20:953–965. [DOI] [PMC free article] [PubMed] [Google Scholar]
- Pinto AD, Lang AE, Chen R. 2003. The cerebellothalamocortical pathway in essential tremor. Neurology. 60:1985–1987. [DOI] [PubMed] [Google Scholar]
- Poon C, Robichaud JA, Corcos DM, Goldman JG, Vaillancourt DE. 2011. Combined measures of movement and force variability distinguish Parkinson's disease from essential tremor. Clin Neurophysiol. 122:2268–2275. [DOI] [PMC free article] [PubMed] [Google Scholar]
- Posner MI, Petersen SE. 1990. The attention system of the human brain. Annu Rev Neurosci. 13:25–42. [DOI] [PubMed] [Google Scholar]
- Prodoehl J, Corcos DM, Vaillancourt DE. 2009. Basal ganglia mechanisms underlying precision grip force control. Neurosci Biobehav Rev. 33:900–908. [DOI] [PMC free article] [PubMed] [Google Scholar]
- Prodoehl J, Planetta PJ, Kurani AS, Comella CL, Corcos DM, Vaillancourt DE. 2013. Differences in brain activation between tremor- and nontremor-dominant Parkinson disease. JAMA Neurol. 70:100–106. [DOI] [PMC free article] [PubMed] [Google Scholar]
- Prodoehl J, Spraker M, Corcos D, Comella C, Vaillancourt D. 2010. Blood oxygenation level-dependent activation in basal ganglia nuclei relates to specific symptoms in de novo Parkinson's disease. Mov Disord. 25:2035–2043. [DOI] [PMC free article] [PubMed] [Google Scholar]
- Prodoehl J, Yu H, Little DM, Abraham I, Vaillancourt DE. 2008. Region of interest template for the human basal ganglia: comparing EPI and standardized space approaches. Neuroimage. 39:956–965. [DOI] [PMC free article] [PubMed] [Google Scholar]
- Raethjen J, Deuschl G. 2012. The oscillating central network of essential tremor. Clin Neurophysiol. 123:61–64. [DOI] [PubMed] [Google Scholar]
- Raethjen J, Govindan RB, Kopper F, Muthuraman M, Deuschl G. 2007. Cortical involvement in the generation of essential tremor. J Neurophysiol. 97:3219–3228. [DOI] [PubMed] [Google Scholar]
- Rajput AH, Robinson CA, Rajput ML, Robinson SL, Rajput A. 2012. Essential tremor is not dependent upon cerebellar Purkinje cell loss. Parkinsonism Relat Disord. 18:626–628. [DOI] [PubMed] [Google Scholar]
- Schnitzler A, Munks C, Butz M, Timmermann L, Gross J. 2009. Synchronized brain network associated with essential tremor as revealed by magnetoencephalography. Mov Disord. 24:1629–1635. [DOI] [PubMed] [Google Scholar]
- Seidler RD, Noll DC, Thiers G. 2004. Feedforward and feedback processes in motor control. Neuroimage. 22:1775–1783. [DOI] [PubMed] [Google Scholar]
- Shahed J, Jankovic J. 2007. Exploring the relationship between essential tremor and Parkinson’s disease. Parkinsonism Relat Disord. 13:67–76. [DOI] [PubMed] [Google Scholar]
- Slifkin AB, Vaillancourt DE, Newell KM. 2000. Intermittency in the control of continuous force production. J Neurophysiol. 84:1708–1718. [DOI] [PubMed] [Google Scholar]
- Spraker MB, Corcos DM, Vaillancourt DE. 2009. Cortical and subcortical mechanisms for precisely controlled force generation and force relaxation. Cereb Cortex. 19:2640–2650. [DOI] [PMC free article] [PubMed] [Google Scholar]
- Spraker MB, Prodoehl J, Corcos DM, Comella CL, Vaillancourt DE. 2010. Basal ganglia hypoactivity during grip force in drug naive Parkinson’s disease. Hum Brain Mapp. 31:1928–1941. [DOI] [PMC free article] [PubMed] [Google Scholar]
- Stoodley CJ. 2012. The cerebellum and cognition: evidence from functional imaging studies. Cerebellum. 11:352–365. [DOI] [PubMed] [Google Scholar]
- Stoodley CJ, Schmahmann JD. 2010. Evidence for topographic organization in the cerebellum of motor control versus cognitive and affective processing. Cortex. 46:831–844. [DOI] [PMC free article] [PubMed] [Google Scholar]
- Sturman MM, Vaillancourt DE, Corcos DM. 2005. Effects of aging on the regularity of physiological tremor. J Neurophysiol. 93:3064–3074. [DOI] [PubMed] [Google Scholar]
- Ugawa Y, Uesaka Y, Terao Y, Hanajima R, Kanazawa I. 1995. Magnetic stimulation over the cerebellum in humans. Ann Neurol. 37:703–713. [DOI] [PubMed] [Google Scholar]
- Vaillancourt DE, Mayka MA, Corcos DM. 2006. Intermittent visuomotor processing in the human cerebellum, parietal cortex, and premotor cortex. J Neurophysiol. 95:922–931. [DOI] [PMC free article] [PubMed] [Google Scholar]
- Yu M, Ma K, Faust PL, Honig LS, Cortes E, Vonsattel JP, Louis ED. 2012. Increased number of Purkinje cell dendritic swellings in essential tremor. Eur J Neurol. 19:625–630. [DOI] [PMC free article] [PubMed] [Google Scholar]