

Abstract
Gastric carcinoma MKN45 cells stably transfected with the full-length ST3GAL4 gene were characterised by glycomic and sialoproteomic analysis. Complementary strategies were applied to assess the glycomic alterations induced by ST3GAL4 overexpression. The N- and O-glycome data were generated in two parallel structural analyzes, based on PGC-ESI-MS/MS. Data on glycan structure identification and relative abundance in ST3GAL4 overexpressing cells and respective mock control are presented. The sialoproteomic analysis based on titanium-dioxide enrichment of sialopeptides with subsequent LC-MS/MS identification was performed. This analysis identified 47 proteins with significantly increased sialylation. The data in this article is associated with the research article published in Biochim Biophys Acta “Glycomic analysis of gastric carcinoma cells discloses glycans as modulators of RON receptor tyrosine kinase activation in cancer” [1].
Keywords: N-glycome, O-glycome, Gastric cancer, Sialyltransferase, Sialoproteome
Specifications Table
| Subject area | Biology |
| More specific subject area | Glycobiology in cancer |
| Type of data | Tables |
| How data was acquired | N-and O-glycome analysed by PGC-LC ESI MS/MS performed on an LTQ ion trap mass spectrometer and PGC-nanoLC ESI MS/MS performed on an amaZon ETD Speed ion trap. Sialoproteome performed using Easy-nLC II system and Orbitrap Fusion Tribrid system. |
| Data format | Analyzed |
| Experimental factors | MKN45 cells stably transfected with the full-length ST3GAL4 gene or empty vector (mock). |
| Experimental features | MKN45 cells grown in vitro in RPMI medium with 10% FBS. |
| Data source location | Not applicable |
| Data accessibility | Data is within this article. |
Value of the data
-
•
Data shows the N- and O-glycome of the MKN45 gastric carcinoma cells and ST3GAL4 sialyltransferase overexpressing cells.
-
•
Data provides a list of glycoproteins with altered sialylated N-glycans in ST3GAL4 overexpressing cells, including several cancer associated proteins.
-
•
These data are valuable as a source for novel biomarkers for gastric cancer.
1. Data
This data article includes the N- and O-glycome of MKN45 cells and assesses the glycosylation alterations induced by ST3GAL4 overexpression. In addition, we provide the data on the proteins with significant increased sialylated N-glycans upon ST3GAL4 overexpression.
2. Experimental design, materials and methods
Glycomic and sialoproteomic analyses were performed as described below comparing MKN45 cells stably transfected with the full-length ST3GAL4 gene or empty vector (mock). Glycome data and statistical evaluation are shown in Table 1, Table 2, Table 3, Table 4. Sialoproteome data and statistical evaluation are shown in Table 5, Table 6.
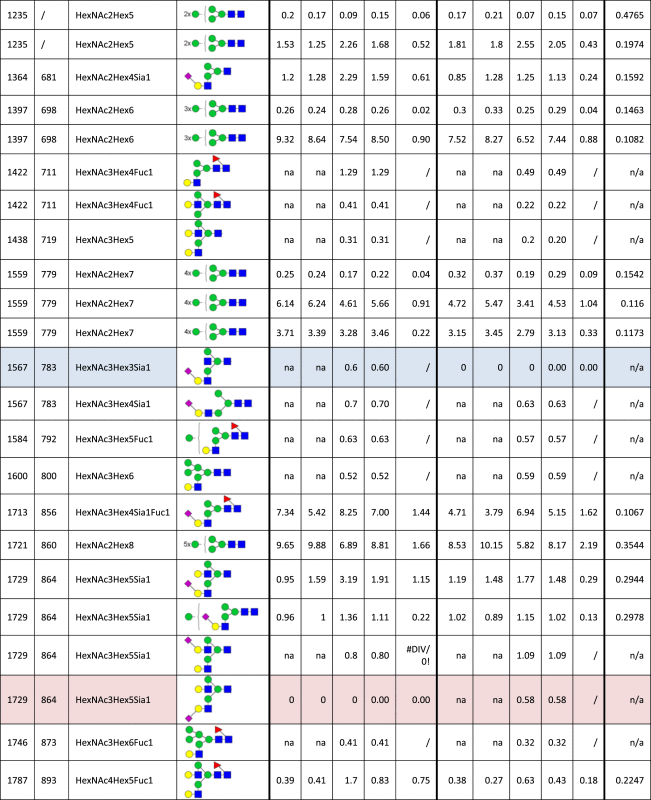
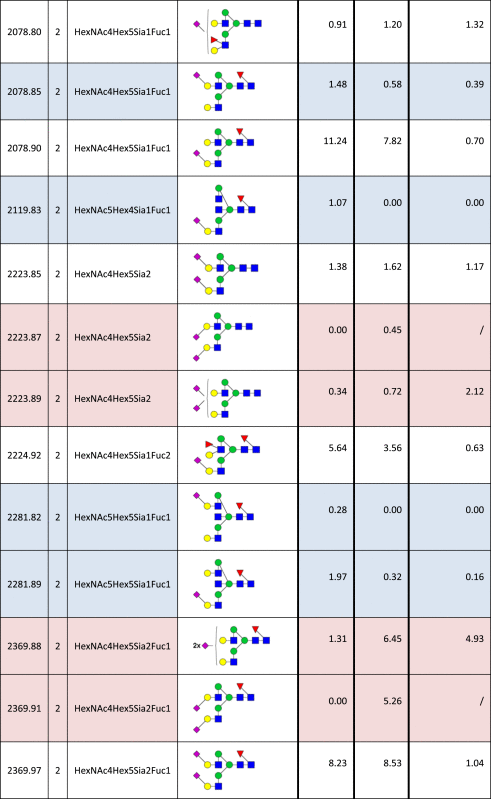
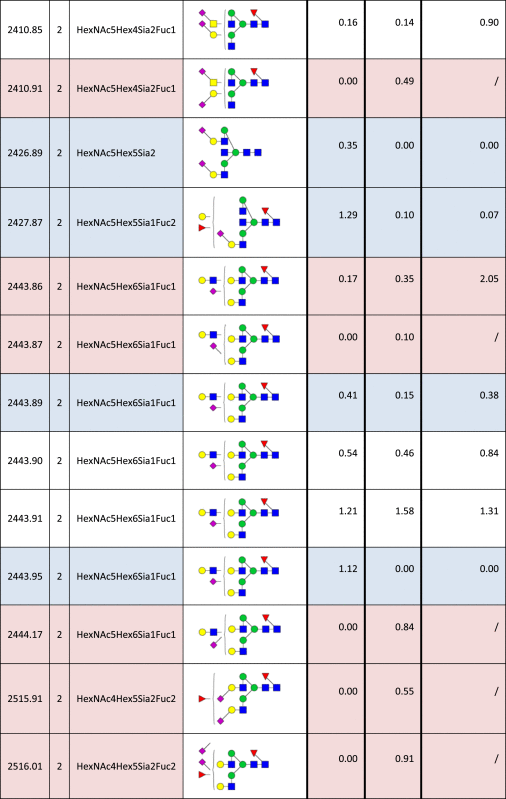
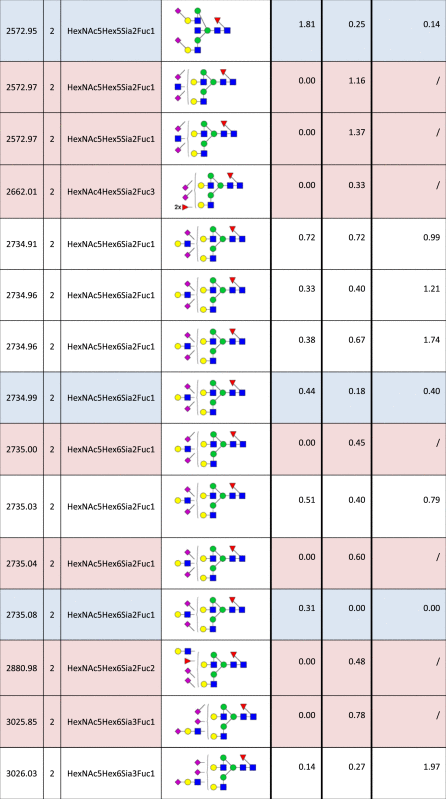
Table 1.
Identified N-glycan structures I.
 |
 |
 |
 |
Structures are represented by the mass to charge ratio (m/z) in which they were identified and quantified, by monosaccharide composition and proposed structure based on MS/MS analyses. The relative quantities were determined by base-peak intensity of extracted ion chromatograms. The average value (Avg) and standard deviation (SD) of triplicates are shown, as well as the p-value (t-test; *p<0.05; **p<0.01; ***p<0.001). Increased or decreased relative abundance are shown in red or blue, respectively. Structures marked as not analyzed (na) were either not detected or overlapped with other structures in given sample, precluding their quantification. Unknown linkage is represented by “?”.
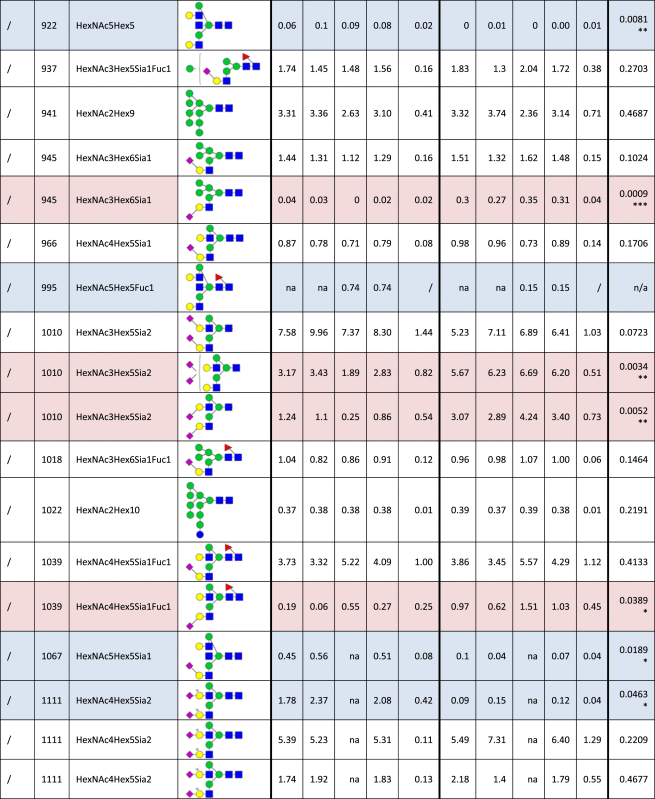
Table 2.
Identified N-glycan structures II.
 |
 |
 |
 |
 |
Structures are represented by their [M–H] value and charge state in which they were identified and quantified, by monosaccharide composition and proposed structure based on MS/MS analyzes. The relative quantities were determined by base-peak intensity of extracted ion chromatograms. The ratio of glycan abundance in ST3GAL4 transfected cells relative to mock transfected is shown on the right column. Increases or decreases larger than 2 fold in glycan abundance are highlighted red or blue, respectively.
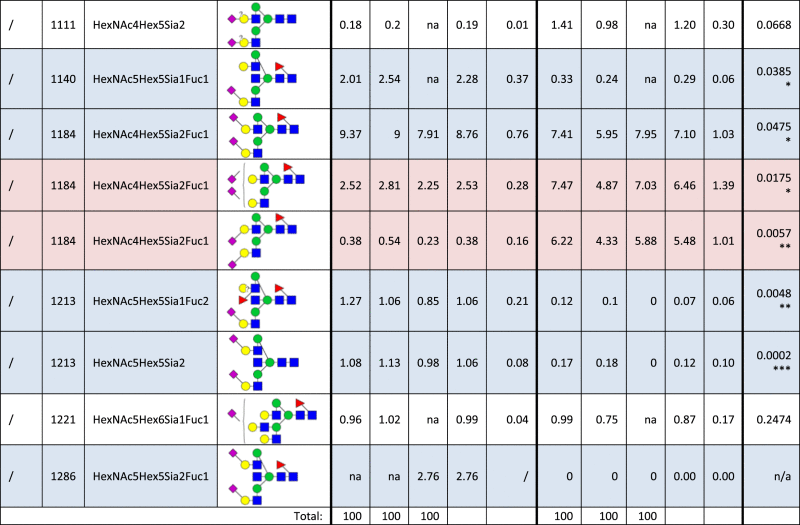
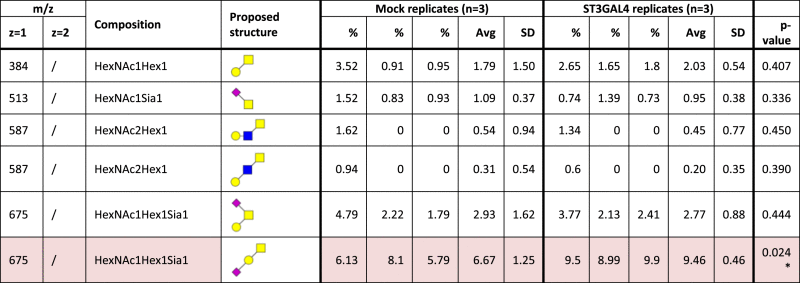
Table 3.
Identified O-glycan structures I.
 |
 |
Structures are represented by the mass to charge ratio (m/z) in which they were identified and quantified, by monosaccharide composition and proposed structure based on MS/MS analyzes. The relative quantities were determined by base-peak intensity of extracted ion chromatograms. The average value (Avg) and standard deviation (SD) of triplicates are shown, as well as the p-value (t-test; *p<0.05; **p<0.01). Increased or decreased relative abundance are shown in red or blue, respectively. Unknown linkage is represented by “?”.
Table 4.
Identified O-glycan structures II.
 |
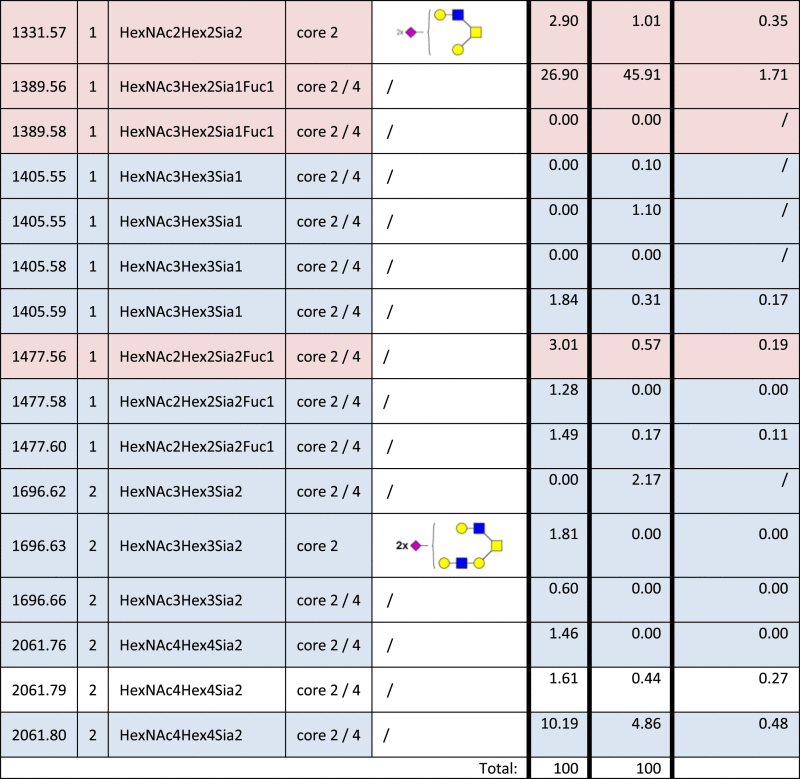 |
Structures are represented by their [M–H] value and charge state in which they were identified and quantified, by monosaccharide composition, type of core and proposed structure based on MS/MS analyzes. The relative quantities were determined by base-peak intensity of extracted ion chromatograms. The ratio of glycan abundance in ST3GAL4 transfected cells relative to mock transfected is shown on the right column. Increases or decreases greater than 1.5 fold in glycan abundance are highlighted red or blue, respectively.
Table 5.
Proteins with increased N-glycan sialylation.
| Accession number | Protein name | Sequence | N-glycan site | ST3GAL4 /Mock | Limma&Rank (p-value) | Func. Grp. |
|---|---|---|---|---|---|---|
| O15031 | Plexin-B2 | ISVAGRNdeCSFQPER | N844 | 2.89 | 0.0342 | RS |
| ALSNdeISLR | N127 | 2.08 | 0.0358 | |||
| O60637 | Tetraspanin-3 | TYNdeGTNdePDAASR | N127 | 2.96 | 0.0358 | RS |
| TYNdeGTNPDAASR | N127 | 2.98 | 0.0433 | |||
| O75882 | Attractin | GICNdeSSDVR | N300 | 2.35 | 0.0342 | IR |
| P02786 | Transferrin receptor protein 1 | KDFEDLYTPVNdeGSIVIVR | N251 | 1.72 | 0.0433 | TT |
| P05026 | Sodium/potassium-transporting ATPase subunit beta-1 | FKLEWLGNdeCSGLNDETYGYK | N158 | 2.79 | 0.0479 | TT |
| P06213 | Insulin receptor | HNdeLTITQGK | N445 | 2.45 | 0.0479 | RS |
| P06731 | Carcinoembryonic antigen-related cell adhesion molecule 5 | TLTLFNdeVTR | N204 | 2.67 | 0.0342 | AM |
| TLTLFNVTRNdeDTASYK | N208 | 3.11 | 0.0342 | |||
| P06756 | Integrin alpha-V | ISSLQTTEKNdeDTVAGQGER | N874 | 4.02 | 0.0342 | AM |
| NdeMTISR | N554 | 4.02 | 0.0342 | |||
| P07602 | Prosaposin | TNdeSTFVQALVEHVKEECDR | N215 | 2.59 | 0.0479 | O |
| P08962 | CD63 antigen | CCGAANdeYTDWEK | N150 | 1.94 | 0.0394 | RS |
| P10909 | Clusterin | EIRHNdeSTGCLR | N291 | 2.12 | 0.0342 | O |
| P11117 | Lysosomal acid phosphatase | QTPEYQNdeESSR | N177 | 3.05 | 0.0383 | E |
| P12821 | Angiotensin-converting enzyme | IGLLDRVTNdeDTESDINYLLK | N445 | 2.62 | 0.0456 | P |
| P13473 | Lysosome-associated membrane glycoprotein 2 | LNdeSSTIK | N275 | 3.09 | 0.0342 | AM |
| VASVINdeINPNdeTTHSTGSCR | N253 | 1.96 | 0.0358 | |||
| VASVININPNdeTTHSTGSCR | N257 | 2.06 | 0.0456 | |||
| P13688 | Carcinoembryonic antigen-related cell adhesion molecule 1 | NdeQSLPSSER | N363 | 2.76 | 0.0479 | AM |
| P13726 | Tissue factor | RNdeNTFLSLR | N169 | 5.52 | 0.0342 | P |
| NdeNTFLSLR | N169 | 5.76 | 0.0358 | |||
| P18564 | Integrin beta-6 | EVEVNdeSSK | N463 | 3.71 | 0.0479 | AM |
| P21589 | 5׳-nucleotidase | LDNdeYSTQELGK | N333 | 1.67 | 0.0479 | E |
| P26006 | Integrin alpha-3 | ELAVPDGYTNdeRTGAVYLCPLTAHK | N86 | 2.68 | 0.0433 | AM |
| P30825 | High affinity cationic amino acid transporter 1 | LCLNNdeDTK | N235 | 3.48 | 0.0297 | TT |
| LCLNdeNdeDTK | N234 | 3.01 | 0.0342 | |||
| P35613 | Basigin | ALMNdeGSESR | N268 | 2.91 | 0.0342 | P |
| P42892 | Endothelin-converting enzyme 1 | NdeSSVEAFK | N632 | 1.89 | 0.0394 | P |
| DYYLNdeKTENEK | N270 | 5.64 | 0.0479 | |||
| P43007 | Neutral amino acid transporter A | VVTQNdeSSSGNdeVTHEK | N201 | 2.58 | 0.0477 | TT |
| P46059 | Solute carrier family 15 member 1 | NdeDSCPEVK | N562 | 4.66 | 0.0358 | TT |
| P48960 | CD97 antigen | WCPQNSSCVNdeATACR | N38 | 1.87 | 0.0479 | AM |
| P54760 | Ephrin type-B receptor 4 | CAQLTVNdeLTRFPETVPR | N203 | 2.34 | 0.0342 | RS |
| Q04912 | Macrophage-stimulating protein receptor | LPEYVVRDPQGWVAGNdeLSAR | N841 | 3.26 | 0.0358 | RS |
| Q08380 | Galectin-3-binding protein | DAGVVCTNdeETR | N125 | 2.43 | 0.0358 | AM |
| Q08722 | Leukocyte surface antigen CD47 | SDAVSHTGNdeYTCEVTELTREGETIIELK | N111 | 6.51 | 0.0056 | AM |
| Q11206 | ST3GAL4 | LFGNdeYSR | N61 | 5.77 | 0.0088 | O |
| Q12913 | Receptor-type tyrosine-protein phosphatase eta | HGSNdeHTSTYDK | N582 | 3.15 | 0.0342 | RS |
| VSDNdeESSSNdeYTYK | N391 | 2.94 | 0.0342 | |||
| VSDNESSSNdeYTYK | N396 | 2.74 | 0.0383 | |||
| GPNdeGTEGASR | N525 | 2.76 | 0.0427 | |||
| IHVAGETDSSNdeLNdeVSEPR | N411 | 1.69 | 0.0479 | |||
| SNdeDTAASEYK | N142 | 2.77 | 0.0479 | |||
| Q13641 | Trophoblast glycoprotein | CVNRNdeLTEVPTDLPAYVR | N81 | 1.85 | 0.0429 | RS |
| Q14108 | Lysosome membrane protein 2 | ANIQFGDNdeGTTISAVSNdeK | N105 | 2.03 | 0.0394 | T |
| ANdeIQFGDNdeGTTISAVSNK | N99 | 1.78 | 0.0479 | |||
| Q15043 | Zinc transporter ZIP14 | ALLNHLDVGVGRGNdeVTQHVQGHR | N77 | 2.42 | 0.0479 | TT |
| Q15758 | Neutral amino acid transporter B(0) | NdeITGTR | N212 | 2.93 | 0.0479 | TT |
| Q7Z7H5 | Transmembrane emp24 domain-containing protein 4 | QYGSEGRFTFTSHTPGDHQICLHSNdeSTR | N117 | 2.50 | 0.0479 | T |
| Q8N271 | Prominin-2 | ILRNdeVSECFLAR | N725 | 3.11 | 0.0433 | O |
| Q92542 | Nicastrin | RPNdeQSQPLPPSSLQR | N417 | 1.66 | 0.0483 | P |
| Q92673 | Sortilin-related receptor | LTIVNdeSSVLDRPR | N871 | 1.92 | 0.0479 | T |
| SRNdeSTVEYTLNK | N1986 | 1.67 | 0.0479 | |||
| Q9BXB1 | Leucine-rich repeat-containing G-protein coupled receptor 4 | TLDLSYNNIRDLPSFNdeGCHALEEISLQR | N362 | 4.00 | 0.0358 | RS |
| Q9BXS4 | Transmembrane protein 59 | LFSICQFVDDGIDLNdeRTK | N90 | 4.09 | 0.0342 | T |
| Q9H330 | Transmembrane protein 245 | ILGDKVNdeNTAVIEK | N551 | 3.47 | 0.0433 | O |
| Q9H5V8 | CUB domain-containing protein 1 | ASVSFLNFNdeLSNCERK | N270 | 3.33 | 0.0342 | AM |
| IGTFCSNdeGTVSR | N180 | 2.93 | 0.0358 | |||
| NdeVSGFSIANR | N205 | 2.33 | 0.0358 | |||
| Q9HD43 | Receptor-type tyrosine-protein phosphatase H | NdeATTAHNPVR | N203 | 6.86 | 0.0342 | RS |
| ETRNdeATTAPNPVR | N381 | 2.93 | 0.0479 | |||
| NdeTTNTSVTAER | N434 | 2.72 | 0.0479 | |||
| Q9P2B2 | Prostaglandin F2 receptor negative regulator | QRNdeNSWVK | N525 | 3.60 | 0.0429 | RS |
| Q9UN76 | Sodium- and chloride-dependent neutral and basic amino acid transporter B(0+) | SPIVTHCNdeVSTVNdeK | N174 | 2.44 | 0.0420 | TT |
| Q9Y639 | Neuroplastin | ANdeATIEVK | N229 | 2.59 | 0.0429 | AM |
List of significantly increased sialylated N-glycan modified peptides in the ST3GAL4 overexpressing cells compared to mock control shown with accession number, protein name, peptide sequence and the identified N-glycan site. The fold in increase, p-value and the protein׳s functional group are also presented. AM: Adhesion and migration; E: Metabolic enzyme; RS: Receptor and signaling; T: Trafficking; TT: Transmembrane transporter; P: Protease; O: Others.
Table 6.
Proteins with decreased N-glycan sialylation.
| Accession number | Protein name | Sequence | N-glycan site | ST3GalIV/Mock | Limma & rank |
|---|---|---|---|---|---|
| (p-value) | |||||
| O14672 | Disintegrin and metalloproteinase domain-containing protein 10 | NdeISQVLEK | N439 | 0.57 | 0.0149 |
| P07602 | Proactivator polypeptide | NdeSTKQEILAALEK | N426 | 0.57 | 0.0474 |
List of significantly decreased sialylated N-glycan modified peptides in the ST3GAL4 overexpressing cells compared to mock control shown with accession number, protein name, peptide sequence and the identified N-glycan site, fold in increase and the p-value.
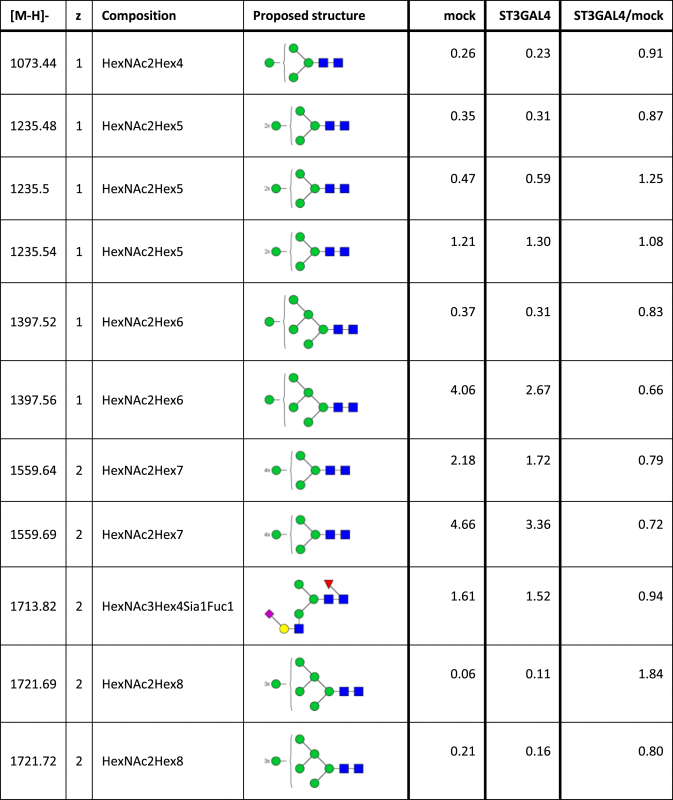
3. N-glycomic strategy I: sample preparation and PGC LC-ESI-MS/MS
Frozen cell pellets (107 cells) of mock or ST3GAL4 transfected MKN45 cells [2] were directly resuspended in 7 M urea, 2 M thiourea, 40 mM Tris, 2% CHAPS, 10 mM DTT and 1% protease inhibitor (Sigma-Aldrich, St. Louis, MO). The cell membranes were disrupted by 10 times 10 s sonication with 16 amplitudes and 1 min on ice in between, and subsequent shaking at 4 °C overnight. To reduce the viscosity of the lysates, the DNA was degraded by adding 1 µl benzonase® nuclease (250 units, Sigma-Aldrich) and 30 min incubation at 37 °C. In order to impair refolding of proteins, 25 mM iodoacetamide were added for alkylation during 1 h in the dark. The lysates were centrifuged for 30 min at 14,000 rpm and the supernatants were transferred to a fresh tube.
Then, solubilized proteins were concentrated by adding 150 µl of supernatant on a 10 kDa cut-off spinfilter (PALL, Port Washington, NY), spinning down for 5 min with 12,000xg and washing 3 times with 100 µl 50 mM NH4HCO3, pH 8.4. N-linked oligosaccharides were released in the spinfilter using 20 µl 50 mM NH4HCO3 and PNGase F (5 mU, Prozyme, Hayward, CA) with incubation at 37 °C overnight. Subsequently, the N-glycans were collected by washing 3 times with 20 µl H2O and dried in Speedvac. Reactions were quenched with 1 µl of glacial acetic acid and N-glycan samples were desalted and dried as previously described [3]. N-glycan samples were subjected to LC-ESI-MS/MS analysis using a 10 cmx250 µm I.D. column, prepared in-house, containing 5 µm porous graphitized carbon (PGC) particles (Thermo Scientific, Waltham, MA). Glycans were eluted using a linear gradient from 0% to 40% acetonitrile in 10 mM NH4HCO3 over 40 min at a flow rate of 10 μl/min. The eluted N-glycans were detected using a LTQ ion trap mass spectrometer (Thermo Scientific) in negative-ion mode with an electrospray voltage of 3.5 kV, capillary voltage of −33.0 V and capillary temperature of 300 °C. Air was used as a sheath gas and mass ranges were defined dependent on the specific structure to be analyzed. The data were processed using the Xcalibur software (version 2.0.7, Thermo Scientific) and manually interpreted from their MS/MS spectra.
Optionally prior to analysis N-glycan were digested in 50 mM sodium phosphate, pH 6.0 at 37 °C overnight using sialidase S (4 mU, ProZyme) that releases α2-3 linked non-reducing terminal sialic acids (recombinant sialidase from Streptococcus pneumoniae, expressed in Escherichia coli) and sialidase A (5 mU, ProZyme) that releases α2-3/6/8 linked non-reducing terminal sialic acid (recombinant gene from Arthrobacter ureafaciens, expressed in Escherichia coli) to confirm sialic acid linkage.
All analyzes were performed in three independent replicates and results were subjected to statistical analyses (Average, standard deviation and unpaired t-test) Table 1.
4. N-glycomic strategy II: sample preparation and PGC nanoLC-ESI MS/MS
Frozen cell pellets (107 cells) of mock or ST3GAL4 transfected MKN45 cells were directly resuspended in 2 mL of lysis buffer (50 mM Tris–HCl, 100 mM NaCl, 1 mM EDTA and protease inhibitor at pH 7.4) and stored on ice for 20 min. The cells were lysed using a Polytron homogenizer for at least three times for 10 s in a cold room. Cellular debris and unlysed cells were sedimented by centrifugation at 2000g for 20 min at 4 °C. The supernatant was collected and the pellets resuspended in 1 mL of lysis buffer and centrifuged again at 2000g for 20 min at 4 °C. All the supernatants were combined, diluted in 20 mM Tris–HCl (pH 7.4) and ultracentrifuged at 120,000g for 90 min at 4 °C. The supernatant was separated from the pellet containing the cell membrane proteins. The membrane proteins were resuspended with 150 μL of 100 mM ammonium bicarbonate buffer and lyophilized overnight. The dried samples were solubilized in 50 μL of 8 M urea and 10 µL aliquots were dot-blotted onto PVDF membranes as described previously [4]. N- and O-glycan release as well as PGC-nanoLC ESI MS/MS analysis on an amaZon ETD Speed ion trap (Bruker, Bremen, Germany) were performed as described in detail previously [4], [5] (Table 2).
5. O-glycomic strategy I: sample preparation and LC-ESI-MS/MS
After the removal of N-glycan, as previously described in “1. N-glycomic strategy I: Sample preparation and LC-ESI-MS/MS”, the O-linked glycans were released from retained glycoproteins in spinfilter using reductive β-elimination (0.5 M NaBH4, 50 mM NaOH at 50 °C, 16 h). Reactions were quenched with 1 µl of glacial acetic acid and glycan samples were desalted and dried as previously described [3]. Glycans were subjected to LC-ESI-MS/MS analysis using a 10 cmx250 µm I.D. column, prepared in-house, containing 5 µm porous graphitized carbon (PGC) particles (Thermo Scientific. Waltham. MA). Glycans were eluted using a linear gradient from 0% to 40% acetonitrile in 10 mM NH4HCO3 over 40 min at a flow rate of 10 μl/min. The eluted O-glycans were detected using a LTQ ion trap mass spectrometer (Thermo Scientific) in negative-ion mode with an electrospray voltage of 3.5 kV, capillary voltage of −33.0 V and capillary temperature of 300 °C. Air was used as a sheath gas and mass ranges were defined dependent on the specific structure to be analyzed. The data were processed using the Xcalibur software (version 2.0.7. Thermo Scientific) and manually interpreted from their MS/MS spectra (Table 3).
6. O-glycomic strategy II: sample preparation and PGC nanoLC-ESI MS/MS
Sample preparation and analysis were performed as previously described in Section 2. “N-glycomic strategy II: Sample preparation and PGC nanoLC-ESI MS/MS” (Table 4).
7. Sialoproteomic analysis
7.1. Cell lysis, protein digestion and iTRAQ labeling
Cell pellets were redissolved in ice-cold Na2CO3 buffer (0.1 M, pH 11) supplemented with protease inhibitor (Roche complete EDTA free), PhosSTOP phosphatase inhibitor cocktail (Roche) and 10 mM sodium pervanadate on ice. The suspensions were tip probe sonicated for 20 s (amplitude=50%) twice and incubated at 4 °C for 1 h. The lysates were then centrifuged at 100,000×g for 90 min at 4 °C to enrich membrane proteins (pellet). The pellets were washed with 50 mM triethylammonium bicarbonate (TEAB) to remove any remaining soluble protein. Membrane fraction was resuspended directly in 6 M urea and 2 M thiourea, reduced in 10 mM DTT for 30 min and then alkylated in 20 mM IAA for 30 min at room temperature in the dark.
Samples were incubated with endoproteinase Lys-C (Wako, Osaka, Japan) for 2 h (1:100 w/w). Following the incubation, the samples were diluted 8 times with 50 mM TEAB (pH 8) and trypsin was added at a ratio of 1:50 (w/w) and left overnight at room temperature. Trypsin digestion was stopped by the addition of 2% formic acid and then the samples were centrifuged at 14,000×g for 10 min to precipitate any lipids present in the sample. The supernatant was purified using in-house packed staged tips with a mixture of Poros R2 and Oligo R3 reversed phase resins (Applied Biosystem, Foster City, CA, USA). Briefly, a small plug of C18 material (3 M Empore) was inserted in the end of a P200 tips, followed by packing of the stage tip with the resins (resuspended in 100% ACN) by applying gentle air pressure. The acidified samples were loaded onto the micro-column after equilibration of the column with 0.1% trifluoroacetic acid (TFA), washed twice with 0.1% TFA and peptides were eluted with 60% ACN/0.1% TFA. A small amount of purified peptides (1 μl) from each sample was subjected to Qubit assay to determine the concentration, while the remaining samples were dried by vacuum centrifugation. Afterwards, peptides were redissolved in dissolution buffer and a total of 150 μg for each condition was labeled with 4-plex iTRAQTM (Applied Biosystems, Foster City, CA) as described by the manufacturer. After labeling, the samples were mixed 1:1:1:1 and lyophilized by vacuum centrifugation.
7.2. Sialic acid containing glycopeptide enrichment by TiSH protocol
The method used for sialylated glycopeptides enrichment is a modification of the TiSH protocol [6] described in [7], [8]. Briefly, samples were resuspended in loading buffer (1 M glycolic acid, 80% ACN, 5% TFA) and incubated with TiO2 beads (GL Sciences, Japan, 10 μm; using a total of 0.6 mg TiO2 beads per 100 μg of peptides). The supernatant containing the un-modified peptides was carefully separated. The TiO2 beads were sequentially washed with loading buffer, washing buffer 1 (80% ACN, 1% TFA) and washing buffer 2 (20% ACN, 0.1% TFA), saving the washings with the previous supernatant. The bound peptides were eluted with 1.5% ammonium hydroxide by shaking for 15 min. The eluted fraction containing the phosphopeptides and sialylated glycopeptides was dried by vacuum centrifugation and subjected to an enzymatic deglycosylation in 20 mM TEAB buffer using 500 U of PNGase F (New England Biolabs, Ipswich, MA) and 0.1 U of Sialidase A (Prozyme, Hayward, CA) overnight at 37 °C.
To separate phosphorylated peptides and formerly glycosylated peptides, the samples were subjected to a second TiO2 enrichment procedure to separate phosphorylated from deglycosylated peptides. The supernatant containing the deglycosylated peptides was saved and the beads were washed with 50% ACN, 0.1% TFA. The washing was added to the supernatant. The deglycosylated fraction was desalted on Oligo R3 staged tip column and dried prior to the HILIC fractionation [7]. All fractions were dried by vacuum centrifugation prior nLC-MS/MS analysis.
7.3. Sialic acid containing glycopeptide analysis by nLC-MS/MS
Samples were resuspended in 6 µL of 0.1% TFA for analysis. Peptides were loaded on an in-house packed Reprosil-Pur C18-AQ (2 cmx100 µm, 5 µm; Dr. Maisch GmbH, Germany) pre-column and separated on an in-house packed Reprosil-Pur C18-AQ (17 cmx75 µm, 3 µm; Dr. Maisch GmbH, Germany) column using an Easy-nLC II system (Thermo Scientific, Bremen, Germany) and eluted at a flow of 250 nL/min. Mobile phase was 95% acetonitrile (B) and water (A) both containing 0.1% formic acid. Depending on the samples, gradient was from 1% to 30% solvent B in 80 or 110 min, 30–50% B in 10 min, 50–100% B in 5 min and 8 min at 100% B. Mass spectrometric analyses were performed in an Orbitrap Fusion Tribrid system (Thermo Scientific, Bremen, Germany). MS scans (400–1200 m/z) were acquired in the orbitrap at a resolution of 120000 at 200 m/z for a AGC target of 5×10⁵ ions and a maximum injection time of 60 ms. Data-dependent HCD MS/MS analysis at top speed of the most intense ions were performed at a resolution of 30000 at 200 m/z for a AGC target of 5×10⁴ and a maximum injection time of 150 ms using the quadrupole to isolate the ions and an isolation window of 1.2 m/z, a NCE of 38% and a dynamic exclusion of 20 s.
The raw data were processed and quantified by Proteome Discoverer (version 1.4.1.14, Thermo Scientific) against SwissProt and Uniprot human reference databases by using Mascot (v2.3.02, Matrix Science Ltd, London, UK) and Sequest HT, respectively. Database searches were performed using the following parameters: precursor mass tolerance of 10 ppm, product ion mass tolerance of 0.02 Da, 1 missed cleavages for trypsin, carbamidomethylation of Cys and iTRAQ labeling on protein N-terminal and Lys as fixed modifications, and phosphorylation on S/T/Y and deamidation of Asn as dynamic modifications. The iTRAQ datasets were quantified using the centroid peak intensity with the “reporter ions quantifier” node. Only peptides with up to a q-value of 0.01 (Percolator), Mascot and Sequest HT rank 1, Sequest HT ΔCn of 0.1, cut-off value of Mascot score ≥ 18 and a cut-off value of XCorr score for charge states of +1, +2, +3, and +4 higher than 1.5, 2, 2.25 and 2.5, respectively, were considered for further analysis.
7.4. Data normalization and significance analysis
Three biological replicates were analyzed and submitted to the statistical analysis. The log2 values of the measured intensities were normalized by the median. Modified peptides were merged with the R Rollup function (http://www.omics.pnl.gov) allowing for one-hit-wonders and using the mean of the normalized intensities for each peptide. Quantification of proteins was obtained by merging the un-modified peptides with the R Rollup function considering at least 2 unique peptides not allowing for one-hit-wonders and using the mean of the intensities. Then the mean over the experimental conditions for each peptide in each replicate was subtracted in order to merge data from different iTRAQ runs. Formerly sialylated glycopeptides containing the consensus motif for N-linked glycosylation (NXS/T/C; where X # P) were normalized based on the protein expression in each of the replicates. Significant up/down-regulations between experimental conditions were calculated allowing a false discovery rate of 0.05. Therefore, we applied combined limma and rank product tests [9], subsequently corrected for multiple testing according to Storey.
Since spontaneous deamidation is frequently observed for asparagine residues, especially when the C-terminal amino acid is glycine (NG), the sites with NGS/T/C are considered as only potential glycosylation. However, in order to reduce the contribution from spontaneous deamidation in the final list, we sort first for the N-linked consensus site (NXS/T/C) and then we filter for proteins that are membrane-associated in order to exclude intracellular proteins that are not N-linked glycosylated (Table 5, Table 6).
Acknowledgments
We acknowledge the support from the European Union, Seventh Framework Programme, Gastric Glyco Explorer Initial Training Network: Grant number 316929. IPATIMUP integrates the i3S Research Unit, which is partially supported by FCT, the Portuguese Foundation for Science and Technology. This work is funded by FEDER funds through the Operational Programme for Competitiveness Factors-COMPETE (FCOMP-01-0124-FEDER028188) and National Funds through the FCT-Foundation for Science and Technology, under the projects: PEst-C/SAU/LA0003/2013, PTDC/BBB-EBI/0786/2012, PTDC/BBB-EBI/0567/2014 (CR). This work was also supported by "Glycoproteomics" project Grant number PCIG09-GA-2011-293847 (to DK) and the Danish Natural Science Research Council and a generous Grant from the VILLUM Foundation to the VILLUM Center for Bioanalytical Sciences at the University of Southern Denmark (to MRL). AM acknowledges FCT, POPH (Programa Operacional Potencial Humano) and FSE (Fundo Social Europeu) (SFRH/BPD/75871/2011). The UPLC instrument was obtained with a grant from the Ingabritt and Arne Lundbergs Research Foundation. C.J. was supported by the Knut and Alice Wallenberg Foundation. The mass spectrometer (LTQ) was obtained by a grant from the Swedish Research Council (342-2004-4434).
Footnotes
Supplementary data associated with this article can be found in the online version at 10.1016/j.dib.2016.03.022.
Appendix A. Supplementary material
Supplementary material
References
- 1.S. Mereiter, A. Magalhães, B. Adamczyk, C. Jin, A. Almeida, L. Drici, M. Ibáñez-Vea, C. Gomes, J.A. Ferreira, L.P. Afonso, L.L. Santos, M.R. Larsen, D. Kolarich, N.G. Karlsson, C.A. Reis, Glycomic analysis of gastric carcinoma cells discloses glycans as modulators of RON receptor tyrosine kinase activation in cancer, Biochim Biophys Acta, (in press) [DOI] [PubMed]
- 2.Carvalho A.S., Harduin-Lepers A., Magalhaes A., Machado E., Mendes N., Costa L.T., Matthiesen R., Almeida R., Costa J., Reis C.A. Differential expression of alpha-2,3-sialyltransferases and alpha-1,3/4-fucosyltransferases regulates the levels of sialyl lewis a and sialyl lewis x in gastrointestinal carcinoma cells. Int. J. Biochem. Cell Biol. 2010;42:80–89. doi: 10.1016/j.biocel.2009.09.010. [DOI] [PubMed] [Google Scholar]
- 3.Schulz B.L., Packer N.H., Karlsson N.G. Small-scale analysis of O-linked oligosaccharides from glycoproteins and mucins separated by gel electrophoresis. Anal. Chem. 2002;74:6088–6097. doi: 10.1021/ac025890a. [DOI] [PubMed] [Google Scholar]
- 4.Jensen P.H., Karlsson N.G., Kolarich D., Packer N.H. Structural analysis of N-and O-glycans released from glycoproteins. Nat. Protoc. 2012;7:1299–1310. doi: 10.1038/nprot.2012.063. [DOI] [PubMed] [Google Scholar]
- 5.Kolarich D., Windwarder M., Alagesan K., Altmann F. Isomer-specific analysis of released N-glycans by LC-ESI MS/MS with porous graphitized carbon. Methods Mol. Biol. 2015;1321:427–435. doi: 10.1007/978-1-4939-2760-9_29. [DOI] [PubMed] [Google Scholar]
- 6.Engholm-Keller K., Birck P., Storling J., Pociot F., Mandrup-Poulsen T., Larsen M.R. TiSH – a robust and sensitive global phosphoproteomics strategy employing a combination of TiO2, SIMAC, and HILIC. J. Proteom. 2012;75:5749–5761. doi: 10.1016/j.jprot.2012.08.007. [DOI] [PubMed] [Google Scholar]
- 7.Melo-Braga M.N., Ibanez-Vea M., Larsen M.R., Kulej K. Comprehensive protocol to simultaneously study protein phosphorylation, acetylation, and N-linked sialylated glycosylation. Methods Mol. Biol. 2015;1295:275–292. doi: 10.1007/978-1-4939-2550-6_21. [DOI] [PubMed] [Google Scholar]
- 8.Larsen M.R., Jensen S.S., Jakobsen L.A., Heegaard N.H. Exploring the sialiome using titanium dioxide chromatography and mass spectrometry. Mol. Cell. Proteom.: MCP. 2007;6:1778–1787. doi: 10.1074/mcp.M700086-MCP200. [DOI] [PubMed] [Google Scholar]
- 9.Schwammle V., Leon I.R., Jensen O.N. Assessment and improvement of statistical tools for comparative proteomics analysis of sparse data sets with few experimental replicates. Journal. Proteom. Res. 2013;12:3874–3883. doi: 10.1021/pr400045u. [DOI] [PubMed] [Google Scholar]
Associated Data
This section collects any data citations, data availability statements, or supplementary materials included in this article.
Supplementary Materials
Supplementary material