Abstract
P5-ATPases are important for processes associated with the endosomal-lysosomal system of eukaryotic cells. In humans, the loss of function of P5-ATPases causes neurodegeneration. In the yeast Saccharomyces cerevisiae, deletion of P5-ATPase Spf1p gives rise to endoplasmic reticulum stress. The reaction cycle of P5-ATPases is poorly characterized. Here, we showed that the formation of the Spf1p catalytic phosphoenzyme was fast in a reaction medium containing ATP, Mg2+, and EGTA. Low concentrations of Ca2+ in the phosphorylation medium decreased the rate of phosphorylation and the maximal level of phosphoenzyme. Neither Mn2+ nor Mg2+ had an inhibitory effect on the formation of the phosphoenzyme similar to that of Ca2+. The Km for ATP in the phosphorylation reaction was ∼1 μm and did not significantly change in the presence of Ca2+. Half-maximal phosphorylation was attained at 8 μm Mg2+, but higher concentrations partially protected from Ca2+ inhibition. In conditions similar to those used for phosphorylation, Ca2+ had a small effect accelerating dephosphorylation and minimally affected ATPase activity, suggesting that the formation of the phosphoenzyme was not the limiting step of the ATP hydrolytic cycle.
Keywords: ATPase, phosphoryl transfer, phosphorylation, protein phosphorylation, transporter, P-ATPase, P5-ATPase, ion pump
Introduction
P5-ATPases comprise a group of proteins that are classified as P-ATPases based on the presence of the characteristic P-ATPase motifs in their primary sequence (1, 2). P5-ATPases have been found only in eukaryotes and have been recently proposed to play an essential role in the endosomal-lysosomal system (3, 4). The yeast Saccharomyces cerevisiae contains two genes coding for P5-ATPases: YEL031W, coding for Spf1p (also called Cod1p), and YOR291W, coding for Ypk9. Spf1p (sensitivity to Pichia farinosa killer toxin) was initially isolated from a mutation protecting Saccharomyces from the effect of a Pichia toxin (5). The protein was also independently identified as required for the controlled degradation of 3-hydroxy-3-methylglutaryl coenzyme A reductase in the endoplasmic reticulum (ER)3 (6). These and later studies have shown that Spf1p is located in the yeast ER and that deletion of Spf1p leads to phenotypes related to ER stress (7–9). In humans, five genes (ATP13A1–A5) code for P5-ATPases (10). Mutations in ATP13A2 have been linked to an early onset autosomal recessive form of Parkinson disease (Kufor-Rakeb syndrome) and neuronal ceroid lipofuscinosis, whereas mutations in ATP13A4 have been associated with autism spectrum disorder (11–13).
P-ATPases are a large group of enzymes that couple the hydrolysis of ATP with the active transport of ions (14, 15). During the transport cycle, they transiently form a phosphoenzyme (EP) that plays a key role in the active transport mechanism. P-ATPases comprise a membrane domain (M) and a soluble portion with nucleotide binding (N), phosphorylation (P), and actuator (A) domains. These domains are involved in a kinase-phosphatase reaction cycle through two major conformations, E1-E2, and the transient formation of a catalytic EP. The binding of the transported ion to the E1 form prompts the assembly of the phosphorylation site between the ATP-bound N domain and the P domain, whereas the A domain directs the occlusion of the bound ion. When the phosphorylation reaction occurs, it initially generates the high energy E1∼P intermediate and releases ADP. E1∼P then changes to E2P, and the A domain associates with the N-P complex and dephosphorylates the P domain. The binding of a counter transported ion is associated with the dephosphorylation of E2P. Finally, the cycle recommences with the transition of E2back to E1.
At present, the biochemical characterization of P5-ATPases is limited, and the putative transported ion has not yet been identified (16). The best characterized P5-ATPase is Spf1p. Spf1p is capable of hydrolyzing ATP and forming the catalytic EP in a relatively simple reaction medium containing no added metal ions except Mg2+, a cofactor of all P-ATPases (7, 17, 18). This result suggests either that the Spf1p transported ion is already present in the reaction medium, for example H+ ions, or that Spf1p is unique in that it can spontaneously adopt an E1 conformation ready for phosphorylation by ATP. Furthermore, a substantial amount of the EP formed by Spf1p is of the E1∼P type, as indicated by its fast decomposition in the presence of ADP (17, 18).
Earlier studies based on the phenotypes generated by Spf1p deletion led to the suggestion that Spf1p may be a Ca2+ transporter (7, 19, 20). However, direct biochemical measurements to confirm this assumption are still lacking (21). It has been recently reported that Ca2+ ions stimulate the decay of the EP of HvP5A1, a homolog of Spf1p from barley (17). The aim of the present study was to examine in more detail the kinetics of the formation and decomposition of the Spf1p EP and the influence of Ca2+.
Experimental Procedures
Chemicals
Polyoxyethylene-10-laurylether (C12E10), l-α-phosphatidylcholine type XVI-E Sigma from fresh egg yolk, ATP (disodium salt, vanadium-free), SDS, yeast synthetic drop-out medium supplement without leucine, yeast nitrogen base without amino acids, dextrose, enzymes and cofactors were obtained from Sigma. Tryptone and yeast extract were from Difco. PerkinElmer Life Sciences provided the [γ-32P]ATP. Salts and reagents were of analytical reagent grade.
Yeast Strain and Growth Media
S. cerevisiae strain DBY 2062 (MATα his4-619 leu2-3,112) (18) was used for expression. Yeast cells were transformed with the pMP625 vector containing a Leu+ marker and the PMAI promoter and the cDNA coding for either Spf1p or the fusion protein GFP-Spf1p. The experiments reported here were done using GFP-Spf1p, which has the same ATPase activity and maximal phosphorylation level as Spf1p (18) and allows an easy quantitation of its expression by fluorescence microscopy. The growing medium contained 6.7% yeast-nitrogen base without amino acids, 0.67% complete supplemented medium minus Leu and 2.2% dextrose.
Purification of Spf1p
Purified preparations of recombinant Spf1p were obtained by a procedure essentially similar to that described previously (18). Briefly, total membranes from 4 liters of yeasts expressing the GFP-Spf1p or Spf1p were isolated, and the microsomal membranes were suspended in a purification buffer containing 20 mm MOPS-K (pH 7.4 at 4 °C), 20% glycerol, 130 mm KCl, 1 mm MgCl2, 2 mm dithiothreitol, 1 mm phenylmethylsulfonyl fluoride, homogenized in a glass homogenizer, and solubilized at 4 °C for 15 min by adding 2 g of C12E10/g of total membrane protein. 10 mm imidazole was added to the supernatant, and then it was loaded onto a 2-ml nickel-nitrilotriacetic acid-agarose column (Qiagen) and washed with 30 column volumes of purification buffer containing 0.05% C12E10 and 50 mm imidazole. Finally, the protein was eluted in purification buffer containing 0.005% C12E10 and 150 mm imidazole. The eluate fractions of higher protein content were pooled, aliquoted, and kept in liquid N2.
Protein Assay
During the purification procedure, the protein concentration was estimated by the method of Bradford (22), and finally it was corrected according to the intensity of the bands after SDS-PAGE on an 8% acrylamide gel according to Laemmli (23) using bovine serum albumin as a standard and staining with Coomassie Blue.
Phosphorylation
The phosphorylation reaction was performed with 1.5 μg of purified GFP-Spf1, which was phosphorylated at 4 °C in 0.25 ml of reaction buffer containing 50 mm Tris-HCl (pH 7.2), 0.5 mm EGTA, MgCl2 to give a concentration of 2 mm Mg2+ and the concentrations of ATP and Ca2+(as CaCl2) indicated in each experiment. GFP-Spf1p was supplemented with 0.85 μg of C12E10 and 4.3 μg of phosphatidylcholine. This suspension was mixed and preincubated for at least 5 min on ice before it was added to the reaction medium. The phosphorylation reaction started with the addition of [γ32P]ATP, and it was stopped after the time indicated in each experiment with 15% ice-cold trichloroacetic acid. The denatured proteins were collected by centrifugation at 20,000 × g for 10 min, washed once with 5% trichloroacetic acid and 150 mm NaH2PO4, and washed once more with distilled water. The precipitated protein was suspended in sample buffer and separated by acidic SDS-PAGE. Slices of the gel containing the Spf1p phosphoenzyme were cut, and the radioactivity was measured in a scintillation counter. For measuring the EP decay, GFP-Spf1p was phosphorylated for 60 s at 4 °C, and then the radioactive label was diluted by adding 500 μm of cold ATP.
ATPase Activity
The ATPase activity was estimated at 28 °C from the release of [32P] from [γ-32P]ATP (24) in a final volume of 0.25 ml of “ATPase medium” containing, 50 mm Tris-HCl (pH 7.2), 0.5 mm EGTA, 5 mm N3Na, 2 mm MgCl2, 30 μm ATP, and 1 μg of GFP-Spf1 in 50 μl of elution buffer. The GFP-Spf1 protein was supplemented with 0.85 μg of C12E10 and 4.3 μg of phosphatidylcholine, the suspension was mixed and preincubated for at least 5 min on ice before being added to the reaction medium. The reaction was initiated by the addition of ATP and terminated by acid denaturation.
Data Analysis
Except were indicated, the data points represent the average values of two or three independent determinations performed with different purified protein preparations. Best fitting values of the parameters and their S.E. were obtained by fitting the equations indicated in the legends of the figures to the experimental data using the SigmaPlot 10 scientific data analysis and graphing software (Systat Software Inc., CA) for Windows.
Results
Phosphorylation of Spf1p by ATP
Purified Spf1p was preincubated in a medium containing 0.5 mm EGTA and 2 mm Mg2+ and phosphorylated by the addition of 0.5 μm [γ-32P]ATP at 4 °C. The results in Fig. 1 show that, in this condition, the reaction was fast and reached a maximal amount of EP of ∼1 nmol/mg of protein at ∼30 s. The value of the apparent phosphorylation rate constant (kp), obtained by fitting a monoexponential rise to maximum function, was 0.14 s−1. When the phosphorylation was initiated by adding ATP and CaCl2 to give 100 μm Ca2+ in the phosphorylation medium, the levels of EP were significantly lower and increased slowly with time (kp = 0.02 s−1) up to a maximal level of 0.75 nmol/mg of protein. At short times of phosphorylation the level of EP was ∼8 times higher in the absence than in the presence of Ca2+. The initial rate of phosphorylation (v0) is a function of the amount of E1 and the apparent constant of the reaction (kp).
The effect of Ca2+ decreasing the level of EP was readily observed when Ca2+ was added together with ATP, suggesting that it did not involve a change in the amount of E1. As shown in Fig. 1C, preincubation of the enzyme with Ca2+ before the beginning of phosphorylation resulted in a minimal decrease of the phosphorylation rate compared with that attained when Ca2+ was only present during phosphorylation. These results suggest that Ca2+ directly decreased the apparent rate constant of phosphorylation, as indicated in Equation 1.
FIGURE 1.
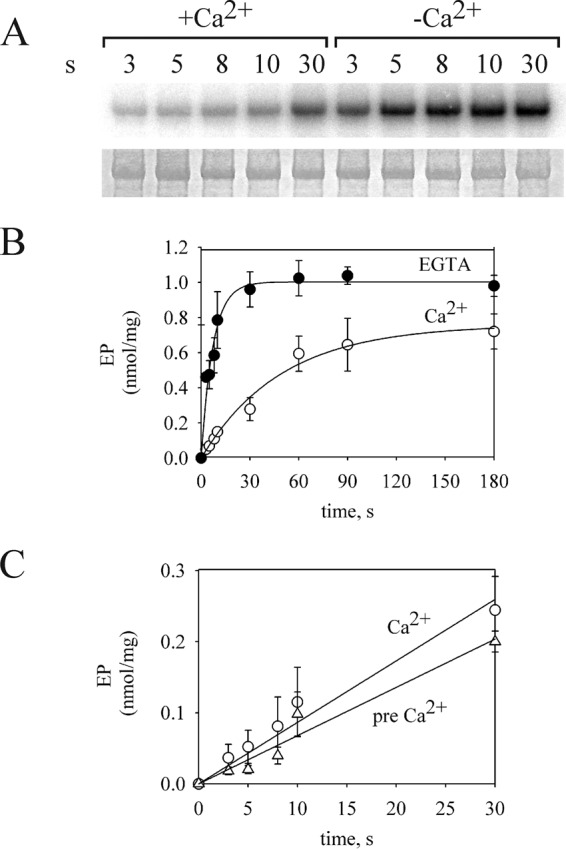
Time course of EP formation. A, acidic gel electrophoresis of phosphorylated GFP-Spf1p showing the radioactivity (top panel) or the Coomassie Blue staining (bottom panel). 1.5 μg of GFP-Spf1p was suspended at 4 °C in a medium containing 2 mm Mg2+ and 0.5 mm EGTA. The reaction was started by adding 0.5 μm ATP plus 0.5 mm EGTA or 0.5 μm ATP plus enough CaCl2 to give a final concentration of 100 μm Ca2+. B, EP levels quantified as described under “Experimental Procedures.” The data points are the averages from three experiments. Error bars show the standard deviation. ●, 0.5 mm EGTA; ○, 100 μm Ca2+. The data were fitted by an exponential equation with the following parameters, in the absence of Ca2+ EPmax = 1.00 + 0.03 nmol/mg, and kp = 0.14 + 0.01 s−1, and in the presence of Ca2+, EPmax = 0.75 + 0.04 nmol/mg, and kp = 0.020 + 0.002 s−1. C, the phosphorylation was done in conditions similar to B except that either the enzyme was suspended in a reaction medium with 0.5 mm EGTA, and Ca2+ was added together with ATP (circles), or the enzyme was preincubated in a reaction medium with Ca2+ for 5 min at 4 °C before starting the phosphorylation (triangles). The data points are the averages from two experiments. Error bars show the standard deviation.
Further information on the effect of Ca2+ was obtained by comparing its effects with those of vanadate (Fig. 2). Vanadate, a well known inhibitor of P-ATPases, binds to the nonphosphorylatable E2 conformation, displacing the equilibrium between E2 and E1 toward the former. In contrast with the effect of Ca2+, the formation of EP was significantly inhibited only when vanadate was in contact with the enzyme before phosphorylation. Moreover, when the enzyme was preincubated with vanadate, its apparent affinity as an inhibitor of phosphorylation was similar in the absence and in the presence of Ca2+. These results indicate that Ca2+ did not affect the E2-E1 equilibrium.
FIGURE 2.
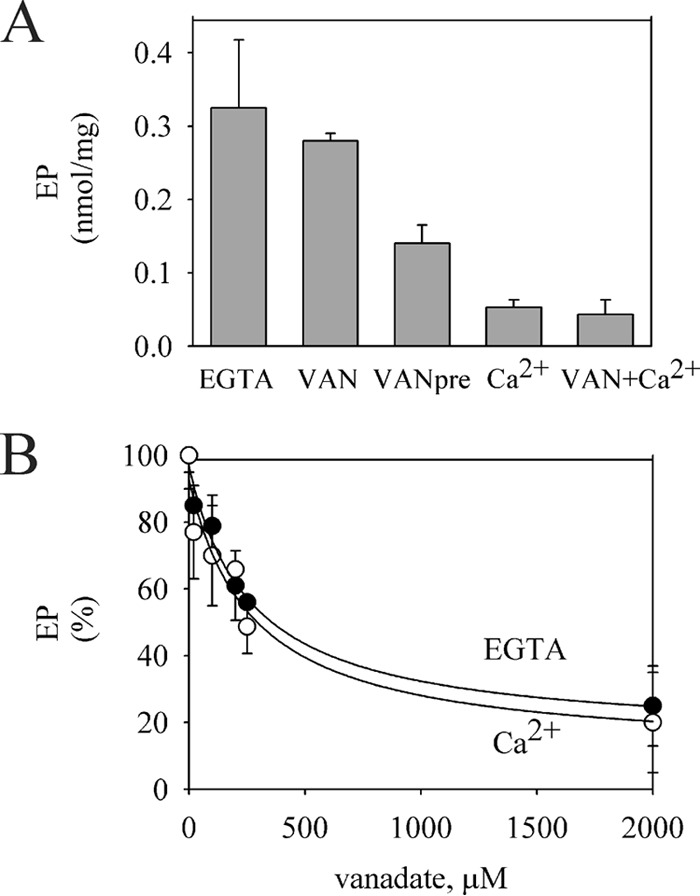
Comparison of the effects of Ca2+ and vanadate on the EP formation. A, 1.5 μg of GFP-Spf1p was suspended at 4 °C in a medium containing 2 mm Mg2+ and 0.5 mm EGTA, and the phosphorylation was started by adding 0.5 μm ATP (EGTA); 0.5 μm ATP plus 200 μm vanadate (VAN); 0.5 μm ATP plus 100 μm Ca2+ (Ca2+); or 0.5 μm ATP, 200 μm vanadate, and 100 μm Ca2+ (VAN+Ca2+). The bar (VANpre) shows the level of EP formed in conditions similar to (VAN) except that the enzyme was preincubated for 5 min at 4 °C with 200 μm vanadate before starting the phosphorylation. The reaction time was 5 s. The values are the average from two experiments. Error bars show the standard deviation. B, GFP-Spf1p was suspended at 4 °C in a medium containing 2 mm Mg2+ and 0.5 mm EGTA and the indicated concentration of vanadate. The phosphorylation was started by adding 0.5 μm ATP (filled circles) or 0.5 μm ATP plus 100 μm Ca2+ (empty circles). The value of EP in each condition in the absence of vanadate was taken as 100%. The data points are the averages from three experiments, and the error bars show the standard deviation. The lines represents the best fit to the data given by the hyperbolic equation EP = EP0 + EPm[vanadate]/(Ki + [vanadate]), with the following parameters, in the absence of Ca2+, EP0 = 15 ± 7%, Ki = 267 ± 75 μm and EPm = 81 ± 7% and in 100 μm Ca2+, EP0 = 10 ± 13%, Ki = 274 ± 144 μm, and EPm = 82 ± 14%.
Dependence of the Rate of Phosphorylation on the Concentration of Ca2+
The level of EP at 5s of phosphorylation was determined in medium containing increasing concentrations of Ca2+. As shown in Fig. 3A, the yield of EP decreased rapidly with a Ki of ∼0.2 μm Ca2+ and then seemed to remain constant at concentrations higher than 100 μm Ca2+.
FIGURE 3.
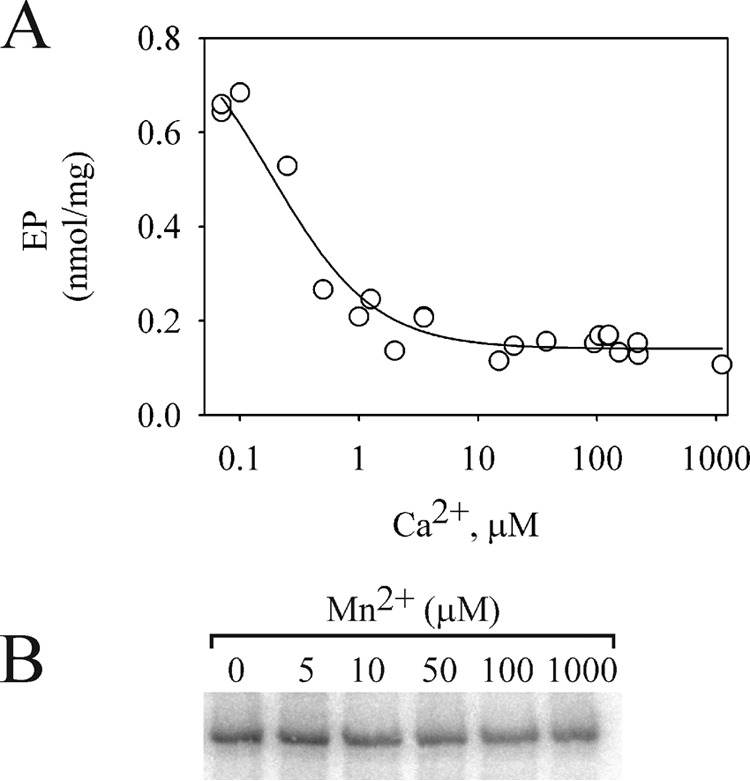
Dependence of the EP formation with the concentration of Ca2+ and Mn2+. A, 1.5 μg of GFP-Spf1p was suspended at 4 °C in a medium containing 2 mm Mg2+ 0.5 mm EGTA and increasing concentrations of CaCl2 to give the indicated concentrations of Ca2+ in the final reaction medium. The reaction was started by adding 30 μm ATP and terminated after 5 s. The data points shown are measurements from three independent experiments. The line represents the best fit to the data given by the hyperbolic equation EP = EP0 + EPCa [Ca]/(Ki + [Ca]), with the following parameters EP0 = 0.14 ± 0.01 nmol/mg, Ki = 0.18 ± 0.04 μm, and EPCa = 0.74 ± 0.06 nmol/mg. B, GFP-Spf1p was suspended at 4 °C in a medium containing 2 mm Mg2+ and the indicated concentrations of Mn2+ and phosphorylated by the addition of 30 μm ATP.
Fig. 3B shows the effect of increasing concentrations of Mn2+ on the level of EP. Somewhat lower levels of EP were observed as Mn2+ concentration increased from 0 to 1 mm. However, the effect of Mn2+ on EP was weaker than that of Ca2+.
Apparent Affinity for ATP
One possible explanation of the inhibitory effect of Ca2+ on the rate constant of phosphorylation could be a decrease in the affinity for ATP. To test this hypothesis, the level of EP was measured at increasing concentrations of ATP (Fig. 4). In the presence of 0.5 mm EGTA and 2 mm Mg2+, the level of EP at 5 s of phosphorylation increased rapidly with the concentration of ATP in the range of 0–30 μm, following a hyperbolic curve with Km = 1 μm. The addition of ATP plus CaCl2 to give a final Ca2+ concentration of 100 μm lowered the levels of EP obtained at all the concentrations of ATP tested. The estimated Km for ATP in the presence of Ca2+ was 0.9 μm. Thus, Ca2+ did not significantly change the apparent affinity for ATP at the high affinity site.
FIGURE 4.
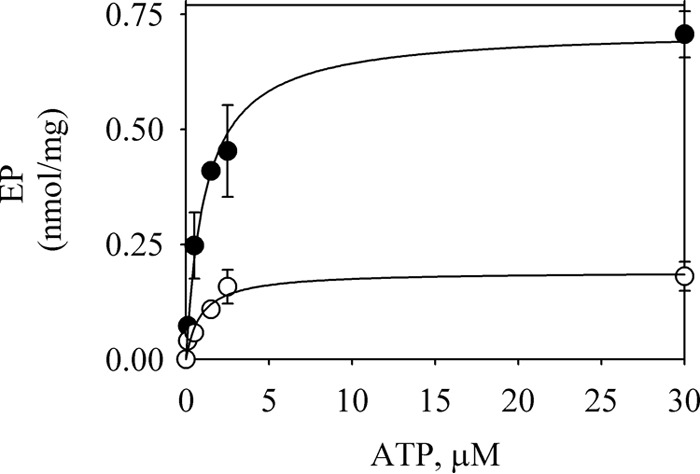
ATP dependence of EP formation. 1.5 μg of GFP-Spf1p was suspended at 4 °C in a medium containing 2 mm Mg2+, 0.5 mm EGTA, and the phosphorylation was started by adding ATP (filled circles) or ATP plus CaCl2 to give 100 μm Ca2+ (empty circles). The reaction time was 5 s. The concentrations of ATP indicated correspond to the final concentration in the reaction medium. The data points are the averages from two experiments, and the error bars show the standard deviation. The lines represent the best fit to the data given by a hyperbolic equation with EP = EPmax5 [ATP]/(Km + [Ca2+]) with the following parameters: without Ca2+, EPmax5 = 0.72 ± 0.03 nmol/mg, Km = 1.1 ± 0.1 μm, with Ca2+, EPmax5 = 0.19 ± 0.01 nmol/mg, and Km = 0.9 ± 0.3 μm.
Apparent Affinity for Mg2+
Mg2+ is a common cofactor of all P-ATPases. To test the effect of Mg2+ on the phosphorylation of Spf1p, we measured the level of EP at increasing concentrations of Mg2+. In the presence of 0.5 mm EGTA, the EP at 5 s of phosphorylation increased with the concentration of Mg2+, reaching a maximal level at ∼100 μm (Fig. 5). When Ca2+ was added to the phosphorylation medium, the EP levels were lower, increased with mm concentrations of Mg2+, and reached lower maximal levels than that obtained in the absence of Ca2+. The estimated Mg2+ concentration for half-maximal activation of the phosphorylation reaction was ∼0.28 mm at 0.2 μm Ca2+ and 1.25 mm at 100 μm Ca2+.
FIGURE 5.
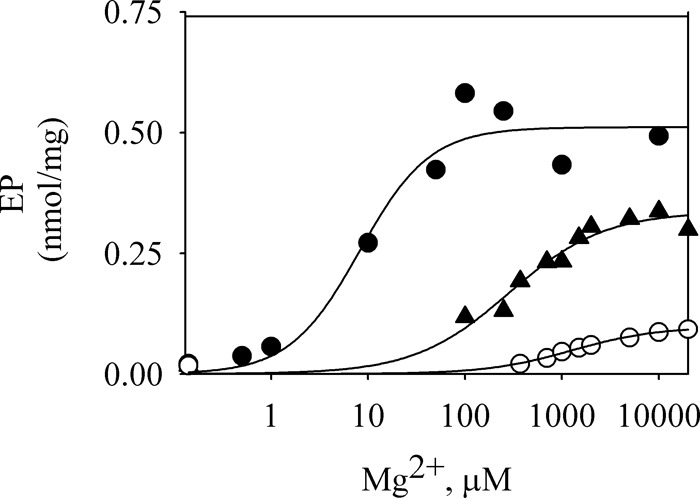
Mg2+ dependence of EP formation. 1.5 μg of GFP-Spf1p was suspended at 4 °C in a medium containing 0.5 mm EGTA and enough MgCl2 to give the indicated final Mg2+ concentrations in the phosphorylation medium. The phosphorylation was started by adding 30 μm ATP (filled circles), 30 μm ATP plus 0.2 μm Ca2+ (filled triangles), or 30 μm ATP plus 100 μm Ca2+ (empty circles). The reaction time was 5 s. The data points shown are measurements from five independent experiments. The lines represent the best fit to the data given by the Hill equation. The estimated values of KMg were 8, 280, and 1250 μm for no Ca2+, 0.2 μm Ca2+, and 100 μm Ca2+, respectively.
Effects of Ca2+ on Dephosphorylation
Ca2+ has been shown to promote the dephosphorylation of HvP5A1, a barley homolog of Spf1p (17). Here, we examined the effects of Ca2+ on the decay of EP in conditions similar to those used for the phosphorylation reaction. To this end, Spf1p was phosphorylated in medium with EGTA and no added CaCl2, and the decay of EP was followed both in the absence of Ca2+ and after the addition of CaCl2 to give 100 μm Ca2+. The time courses of dephosphorylation were biphasic (Fig. 6). The addition of Ca2+ at the start of dephosphorylation increased ∼2-fold the rate of the rapid component, whereas the slow component was minimally affected.
FIGURE 6.
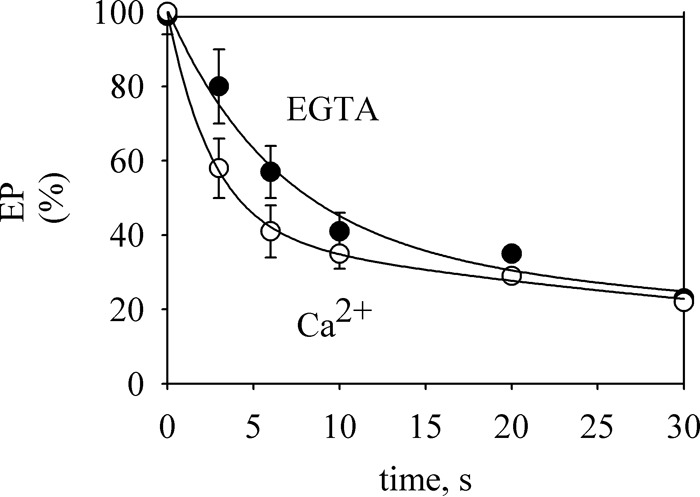
Time course of EP decay. GFP-Spf1p was phosphorylated for 60 s at 4 °C in a medium containing 2 mm Mg2+, 0.5 mm EGTA, and 0.5 μm ATP, and the dephosphorylation was measured after diluting the radioactive label with 500 μm of cold ATP or 500 μm of cold ATP plus enough CaCl2 to give 100 μm Ca2+. The lines represent the best fit to the data given by an equation of double exponential decay. The data points are the averages from two experiments. Error bars show the standard deviation.
ATPase Activity
In previous studies, we did not detect a significant effect of Ca2+ on the ATPase activity of Spf1p (18). However, because here we found that Ca2+ changed the level and kinetics of EP, we reexamined its effects on ATPase by using a low concentration of ATP (30 μm) and short reaction times similar to those of the phosphorylation experiments. In these conditions, ATPase activity in the presence of 0.5 mm EGTA was slightly higher than that in the presence of 100 μm Ca2+ (Fig. 7).
FIGURE 7.
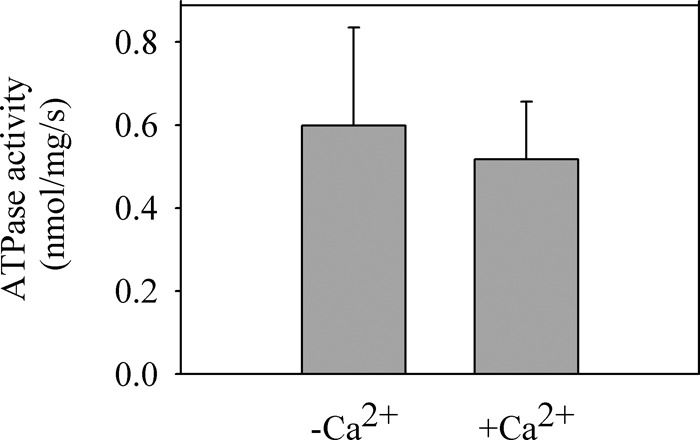
Effect of Ca2+ on the ATPase activity. The ATPase activity of GFP-Spf1p was measured as described under “Experimental Procedures” at 28 °C for 20 s in a reaction medium containing 30 μm ATP, 2 mm Mg2+, 0.5 mm EGTA with (+Ca), or without (−Ca) CaCl2 to give 100 μm Ca2+. The data points are the averages from three experiments. Error bars show the standard deviation.
Discussion
Here, we investigated the formation and decay of the catalytic phosphorylated intermediate of Spf1p in the presence and in the absence of Ca2+. In agreement with previous studies (7, 17, 18), we found that Spf1p readily accepted the γ-P from ATP, provided Mg2+ was present in the medium. The phosphorylation reaction attained maximal rate and maximal levels of EP in medium containing enough EGTA to reduce the concentration of Ca2+ to less than 0.1 μm. The estimated values of the rate constants for phosphorylation for Spf1p are in the range of those reported for other P-ATPases (25, 26). On the other hand, the maximal level of EP measured in different preparations of the purified protein allows estimating a stoichiometry of near 0.1 mol EP/mol of protein. Although this value is far from the theoretical stoichiometry of 1:1, it is close to the values reported for other P-ATPases like those of the P4 type (27). In addition, the amount of EP detected may be underestimated because of the inactivation of the protein during the purification process, the presence of a small amount of contaminant proteins in the purified preparation, and the decomposition of EP during the acidic gel electrophoresis. In any case, our results indicate that the absence of Ca2+ stabilizes Spf1p in its phosphorylated form.
Effects of Ca2+ on Phosphorylation
When the phosphorylation reaction took place in the presence of Ca2+, the apparent rate of phosphorylation and the maximum level of EP decreased. The effect of Ca2+ was fast and readily observed when Ca2+ was added together with ATP, suggesting that Ca2+ directly inhibited the phosphorylation reaction. Moreover, Ca2+ did not affect the E2-E1 equilibrium, as indicated by (i) the lack of effect of the preincubation of the enzyme with Ca2+ before starting phosphorylation and (ii) the lack of effect of Ca2+ on the apparent affinity for the E2 ligand vanadate. In contrast, the experiments with vanadate suggest that the enzyme can be forced to adopt the E2 conformation by preincubation with vanadate, as indicated by the lower yield of EP observed in this condition.
Half-maximal inhibition of phosphorylation by Ca2+ occurred at a physiological concentration range. Additionally, the observed inhibition seemed to be a specific effect of Ca2+ because other divalent metals such as Mg2+ did not inhibit the phosphorylation reaction at any of the concentrations tested. The levels of EP were slightly decreased by Mn2+, suggesting that Mn2+ may substitute Ca2+ with lower efficiency. However, we have previously found that Mn2+ decreases Spf1p ATPase activity (18), a result that does not support the proposed role of Spf1p as a Mn2+ transporter (28).
The ATP dependence of the phosphorylation reaction indicates that Spf1p reacts with ATP with high affinity, as expected for the catalytic ATP site of a P-ATPase, and that it was not significantly changed by Ca2+. As reported for other P-ATPases, we found that the rate of phosphorylation of Spf1p depends on the concentration of Mg2+ (26, 29). In the absence of Ca2+, the phosphorylation rate increased with the concentrations of Mg2+ in the micromolar range. Interestingly, the amount of Mg2+ needed to activate phosphorylation increased in the presence of Ca2+, and high Mg2+ partially protected from Ca2+ inhibition.
For the mechanism of Ca2+ inhibition of EP formation, at least two possibilities could be considered. First, Ca2+ may compete with Mg2+ at the catalytic site of Spf1p, replacing the activating effect of Mg2+ with less efficiency. Such a competition occurs in other P-ATPases, with varying degree of catalytic efficiency (30, 31). Furthermore, if the inhibitory species were Ca2+ in complex with ATP, the affinity of Spf1p for Ca2+-ATP should be extremely high, because it can be estimated that, in the conditions used for the phosphorylation reaction, more than 85% of ATP was bound to Mg2+. Alternatively, the inhibition of Spf1p phosphorylation by Ca2+ may involve a separate Ca2+ site on the protein. Modulatory Ca2+ sites have been identified in the nucleotide domain of other P-ATPases (32). Actually, the nucleotide domain of P5-ATPases exhibits some unique amino acid motifs that may be relevant for the formation and stability of the Spf1p EP (17, 33).
Effects of Ca2+ on Dephosphorylation
Dephosphorylation involved both a fast and a slow component. We found that Ca2+ had a small effect accelerating the fast phase of dephosphorylation by ∼2-fold. This type of biphasic dephosphorylation kinetics has already been described in other P-ATPases (34, 35) and may represent the fast decomposition of the preexistent E2P followed by a slower decomposition of the E2P formed from E1P. If this were the case, our results would indicate that Ca2+ accelerates E2P decay. On the other hand, because a substantial amount of the phosphorylated Spf1p is E1P, the possibility that Ca2+ promotes the reaction of E1P with the ADP produced cannot be discarded. Further studies are needed to discriminate between these possibilities. Moreover, by using yeast membrane preparations, Sørensen et al. (17) showed that Ca2+ induces a spontaneous decay of the recombinant plant P5A-ATPase HvP5A1 EP. These authors showed that Ca2+ exerted this effect with relatively low affinity (Ki = ∼250 μm) but was very effective in reducing EP, a fact that might have been helped by the ADP-producing hexokinase-glucose system used to deplete ATP and thus stop phosphorylation. In contrast, our present results showed that the most prominent effect of Ca2+ was directly inhibiting EP formation and that the effect of Ca2+ accelerating dephosphorylation was smaller. This is consistent with the lower level of EP detected at steady state in the presence of Ca2+. An interesting hypothesis that may explain the differences between our results and those reported previously is the modulation of the effect of Ca2+ by detergents and lipids. Indeed, the signaling lipids phosphatidic acid and phosphatidylinositol 3,5-biphosphate have been recently shown to increase the phosphorylation of the closely related P5B-ATPase ATP13A2 (36).
Effects of Ca2+ on the ATPase Activity of Spf1p
Spf1p ATPase activity, measured in conditions similar to those used for phosphorylation, was less affected by Ca2+ than expected on the basis on its effect on the formation of EP. This result suggests that the phosphorylation reaction is not limiting ATPase activity. This is in agreement with the fact that a substantial fraction of the Spf1p EP is E1P and does not transit to E2P (17, 18). In our hands, the slow phase of dephosphorylation did not seem to change with Ca2+, which might be related to the lack of stimulation of ATPase activity. We believe that the effect of Ca2+ on Spf1p may depend on the temperature of the assay, the presence of other modulators, different lipid environments, and potential interacting partners that are unknown at present. This requires further investigation.
Significance of the Effects of Ca2+ on the Function of Spf1p
Because earlier studies indicated a connection between Spf1p and Ca2+ homeostasis (6, 7), it is tempting to speculate on the potential relevance of a Ca2+ modulation of the Spf1p function. Moreover, Ca2+ plays an important role in membrane trafficking, a process also affected by the function of P5-ATPases (3). We have considered the possibility that the observed effects of Ca2+ are the consequence of its action as a transported counterion in the catalytic cycle of Spf1p. However, based on the results presented here and the comparison with the behavior of other P-ATPases, we believe that this option is unlikely. Because Ca2+ directly inhibited the ATP phosphorylation of Spf1p, it presumably acted from the cytosol. In contrast, a counterion is expected to act from the luminal side of the membrane. In addition, if Ca2+ increased the turnover of EP by acting as a counterion, it should be pumped out from the lumen of the ER. Although functional reconstitution of Spf1p into liposomes has not yet been reported, it should be soon available for a direct testing of Spf1p transporting activity. Nevertheless, Ca2+ may modulate the functions of Spf1p even if it is not transported. Indeed, the catalytic subunit of P4-ATPase Drs2p interacts with its Cdc50p subunit preferentially when it is phosphorylated (27). Our results indicate that at the low concentrations of Ca2+ present in the cytosol at resting conditions, Spf1p would be stabilized in the phosphorylated form, and this might influence its interaction with other protein partners. In this line, the effects of Ca2+ on the formation of the catalytic EP of Spf1p may be part of a signaling pathway from the cytosol to the ER.
Author Contributions
G. R. C. and N. A. C. designed, performed, and analyzed the experiments. L. R. M. and N. S. performed the experiments and contributed to the preparation of the figures. H. P. A. designed the study, analyzed the experiments, and wrote the paper. All authors analyzed the results and approved the final version of the manuscript.
Acknowledgment
We thank R. Y. Hampton for the generous gift of the cDNA sequence coding for the Spf1 protein.
This work was supported by Grant PICT 1240 from Agencia Nacional de Promoción Científica y Tecnológica, by Grant PIP 1042 from Consejo Nacional de Investigaciones Científicas y Tecnológicas, and by a research grant from Universidad de Buenos Aires. The authors declare that they have no conflicts of interest with the contents of this article.
- ER
- endoplasmic reticulum
- Spf1
- sensitivity to P. farinosa killer toxin
- C12E10
- polyoxyethylene 10-lauryl ether
- EP
- phosphorylated enzyme.
References
- 1. Palmgren M. G., Axelsen K. B. (1998) Evolution of P-type ATPases. Biochim. Biophys. Acta 1365, 37–45 [DOI] [PubMed] [Google Scholar]
- 2. Sørensen D. M., Buch-Pedersen M. J., and Palmgren M. G. (2010) Structural divergence between the two subgroups of P5 ATPases. Biochim. Biophys. Acta 1797, 846–855 [DOI] [PubMed] [Google Scholar]
- 3. van Veen S., Sørensen D. M., Holemans T., Holen H. W., Palmgren M. G., and Vangheluwe P. (2014) Cellular function and pathological role of ATP13A2 and related P-type transport ATPases in Parkinson's disease and other neurological disorders. Front. Mol. Neurosci. 7, 48. [DOI] [PMC free article] [PubMed] [Google Scholar]
- 4. Perrett R. M., Alexopoulou Z., and Tofaris G. K. (2015) The endosomal pathway in Parkinson's disease. Mol. Cell Neurosci. 66, 21–28 [DOI] [PubMed] [Google Scholar]
- 5. Suzuki C., and Shimma Y. I. (1999) P-type ATPase Spf1 mutants show a novel resistance mechanism for the killer toxin SMKT. Mol. Microbiol. 32, 813–823 [DOI] [PubMed] [Google Scholar]
- 6. Cronin S. R., Khoury A., Ferry D. K., and Hampton R. Y. (2000) Regulation of HMG-CoA reductase degradation requires the P-type ATPase Cod1p/Spf1p. J. Cell Biol. 148, 915–924 [DOI] [PMC free article] [PubMed] [Google Scholar]
- 7. Cronin S. R., Rao R., and Hampton R. Y. (2002) Cod1p/Spf1p is a P-type ATPase involved in ER function and Ca2+ homeostasis. J. Cell Biol. 157, 1017–1028 [DOI] [PMC free article] [PubMed] [Google Scholar]
- 8. Tipper D. J., and Harley C. A. (2002) Yeast genes controlling responses to topogenic signals in a model transmembrane protein. Mol. Biol. Cell 13, 1158–1174 [DOI] [PMC free article] [PubMed] [Google Scholar]
- 9. Vashist S., Frank C. G., Jakob C. A., and Ng D. T. (2002) Two distinctly localized P-type ATPases collaborate to maintain organelle homeostasis required for glycoprotein processing and quality control. Mol. Biol. Cell 13, 3955–3966 [DOI] [PMC free article] [PubMed] [Google Scholar]
- 10. Schultheis P. J., Hagen T. T., O'Toole K. K., Tachibana A., Burke C. R., McGill D. L., Okunade G. W., and Shull G. E. (2004) Characterization of the P5 subfamily of P-type transport ATPases in mice. Biochem. Biophys. Res. Commun. 323, 731–738 [DOI] [PubMed] [Google Scholar]
- 11. Ramirez A., Heimbach A., Gründemann J., Stiller B., Hampshire D., Cid L. P., Goebel I., Mubaidin A. F., Wriekat A. L., Roeper J., Al-Din A., Hillmer A. M., Karsak M., Liss B., Woods C. G., Behrens M. I., and Kubisch C. (2006) Hereditary parkinsonism with dementia is caused by mutations in ATP13A2, encoding a lysosomal type 5 P-type ATPase. Nat. Genet. 38, 1184–1191 [DOI] [PubMed] [Google Scholar]
- 12. Kwasnicka-Crawford D. A., Carson A. R., Roberts W., Summers A. M., Rehnström K., Järvelä I., and Scherer S. W. (2005) Characterization of a novel cation transporter ATPase gene (ATP13A4) interrupted by 3q25-q29 inversion in an individual with language delay. Genomics 86, 182–194 [DOI] [PubMed] [Google Scholar]
- 13. Bras J., Verloes A., Schneider S. A., Mole S. E., and Guerreiro R. J. (2012) Mutation of the parkinsonism gene ATP13A2 causes neuronal ceroid-lipofuscinosis. Hum. Mol. Genet. 21, 2646–26650 [DOI] [PMC free article] [PubMed] [Google Scholar]
- 14. Toyoshima C., and Inesi G. (2004) Structural basis of ion pumping by Ca2+-ATPase of the sarcoplasmic reticulum. Annu. Rev. Biochem. 73, 269–292 [DOI] [PubMed] [Google Scholar]
- 15. Palmgren M. G., and Nissen P. (2011) P-ATPases. Annu. Rev. Biophys. 40, 243–266 [DOI] [PubMed] [Google Scholar]
- 16. Sørensen D. M., Holen H. W., Holemans T., Vangheluwe P., and Palmgren M. G. (2015) Towards defining the substrate of orphan P5A-ATPases Biochim. Biophys. Acta 1850, 524–535 [DOI] [PubMed] [Google Scholar]
- 17. Sørensen D. M., Møller A. B., Jakobsen M. K., Jensen M. K., Vangheluwe P., Buch-Pedersen M. J., and Palmgren M. G. (2012) Ca2+ induces spontaneous dephosphorylation of a novel P5A-type ATPase. J. Biol. Chem. 287, 28336–28348 [DOI] [PMC free article] [PubMed] [Google Scholar]
- 18. Corradi G. R., de Tezanos Pinto F., Mazzitelli L. R., and Adamo H. P. (2012) Shadows of an absent partner: ATP hydrolysis and phosphoenzyme turnover of the Spf1 (sensitivity to Pichia farinosa killer toxin) P5-ATPase. J. Biol. Chem. 287, 30477–30484 [DOI] [PMC free article] [PubMed] [Google Scholar]
- 19. Vallipuram J., Grenville J., and Crawford D. A. (2010) The E646D-ATP13A4 mutation associated with autism reveals a defect in calcium regulation. Cell. Mol. Neurobiol. 30, 233–246 [DOI] [PMC free article] [PubMed] [Google Scholar]
- 20. Lustoza A. C., Palma L. M., Façanha A. R., Okorokov L. A., and Okorokova-Façanha A. L. (2011) P5A-type ATPase Cta4p is essential for Ca2+ transport in the endoplasmic reticulum of Schizosaccharomyces pombe. PLoS One 6, e27843. [DOI] [PMC free article] [PubMed] [Google Scholar]
- 21. de Tezanos Pinto F., Corradi G. R., and Adamo H. P. (2011) The human P5B-ATPase ATP13A2 is not a Ca2+ transporting pump. J. Life Sci. 5, 1–6 [Google Scholar]
- 22. Bradford M. M. (1976) A rapid and sensitive method for the quantitation of microgram quantities of protein utilizing the principle of protein-dye binding. Anal. Biochem. 72, 248–254 [DOI] [PubMed] [Google Scholar]
- 23. Laemmli U. K. (1970) Cleavage of structural proteins during the assembly of the head of bacteriophage T4. Nature 227, 680–685 [DOI] [PubMed] [Google Scholar]
- 24. Richards D. E., Rega A. F., and Garrahan P. J. (1978) Two classes of site for ATP in the Ca2+-ATPase from human red cell membranes. Biochim. Biophys. Acta 511, 194–201 [DOI] [PubMed] [Google Scholar]
- 25. Vestergaard A. L., Coleman J. A., Lemmin T., Mikkelsen S. A., Molday L. L., Vilsen B., Molday R. S., Dal Peraro M., and Andersen J. P. (2014) Critical roles of isoleucine-364 and adjacent residues in a hydrophobic gate control of phospholipid transport by the mammalian P4-ATPase ATP8A2. Proc. Natl. Acad. Sci. U.S.A. 111, E1334–E1343 [DOI] [PMC free article] [PubMed] [Google Scholar]
- 26. Garrahan P. J., and Rega A. F. (1978) Activation of partial reactions of the Ca2+ ATPase from human red cells by Mg2+ and ATP. Biochim. Biophys. Acta 513, 59–65 [DOI] [PubMed] [Google Scholar]
- 27. Lenoir G., Williamson P., Puts C. F., and Holthuis J. C. (2009) Cdc50p plays a vital role in the ATPase reaction cycle of the putative aminophospholidip transporter Drs2p. J. Biol. Chem. 284, 17956–17967 [DOI] [PMC free article] [PubMed] [Google Scholar]
- 28. Cohen Y., Megyeri M., Chen O. C., Condomitti G., Riezman I., Loizides-Mangold U., Abdul-Sada A., Rimon N., Riezman H., Platt F. M., Futerman A. H., and Schuldiner M. (2013) The yeast P5 type ATPase, Spf1, regulates manganese transport into the endoplasmic reticulum. PLoS One 8, e85519. [DOI] [PMC free article] [PubMed] [Google Scholar]
- 29. Adamo H. P., Rega A. F., and Garrahan P. J. (1988) Pre-steady-state phosphorylation of the human red cell Ca2+-ATPase. J. Biol. Chem. 263, 17548–17554 [PubMed] [Google Scholar]
- 30. Caride A. J., Rega A. F., and Garrahan (1986) The reaction of Mg2+ with the Ca2+-ATPase from human red cell membranes and its modification by Ca2+ Biochim. Biophys. Acta 863, 165–177 [DOI] [PubMed] [Google Scholar]
- 31. Mendlein J., and Sachs G. (1989) The substitution of calcium for magnesium in H+,K+-ATPase catalytic cycle: evidence for two actions of divalent cations. J. Biol. Chem. 264, 18512–18519 [PubMed] [Google Scholar]
- 32. Ekberg K., Pedersen B. P., Sørensen D. M., Nielsen A. K., Veierskov B., Nissen P., Palmgren M. G., and Buch-Pedersen M. J. (2010) Structural identification of cation binding pockets in the plasma membrane proton pump. Proc. Natl. Acad. Sci. U.S.A. 107, 21400–21405 [DOI] [PMC free article] [PubMed] [Google Scholar]
- 33. Møller A. B., Asp T., Holm P. B., and Palmgren M. G. (2008) Phylogenetic analysis of P5 P-type ATPases, a eukaryotic lineage of secretory pathway pumps. Mol. Phylogenet. Evol. 46, 619–634 [DOI] [PubMed] [Google Scholar]
- 34. Hobbs A. S., Albers R. W., Froehlich J. P., and Heller P. F. (1985) ADP stimulates hydrolysis of the ADP-insensitive phosphoenzyme in Na+, K+-ATPase and Ca2+-ATPase. J. Biol. Chem. 260, 2035–2037 [PubMed] [Google Scholar]
- 35. Nakamura Y., Kurzmack M., and Inesi G. (1986) Kinetic effects of calcium and ADP on the phosphorylated intermediate of sarcoplasmic reticulum ATPase. J. Biol. Chem. 261, 3090–3097 [PubMed] [Google Scholar]
- 36. Holemans T., Sørensen D. M., van Veen S., Martin S., Hermans D., Kemmer G. C., Van den Haute C., Baekelandt V., Günther Pomorski T., Agostinis P., Wuytack F., Palmgren M., Eggermont J., and Vangheluwe P. (2015) A lipid switch unlocks Parkinson's disease-associated ATP13A2. Proc. Natl. Acad. Sci. U.S.A. 112, 9040–9045 [DOI] [PMC free article] [PubMed] [Google Scholar]


