Abstract
Coherent Raman imaging requires high peak power laser pulses to maximize the nonlinear multiphoton signal generation, but accompanying photo-induced sample damage often poses a challenge to microscopic imaging studies. We demonstrate that beam-scanning by a 3.5-kHz resonant mirror in a broadband coherent anti-Stokes Raman scattering (BCARS) imaging system can reduce photo-induced damage without compromising the signal intensity. Additionally, beam-scanning enables slit-acquisition, in which spectra from a thin line of sample illumination are acquired in parallel during a single charge-coupled device (CCD) exposure. Reflective mirrors are employed in the beam-scanning assembly to minimize chromatic aberration and temporal dispersion. The combined approach of beam-scanning and slitacquisition is compared with the sample-scanning mode in terms of spatial resolution, photo-induced damage, and imaging speed at the maximum laser power below the sample damage threshold. We show that the beam-scanning BCARS imaging method can reduce photodamage probability in biological cells and tissues, enabling faster imaging speed by using higher excitation laser power than could be achieved without the beam-scanning.
Coherent Raman imaging (CRI) has been widely used to acquire chemical and morphological information of various material and biological systems without labeling [1,2]. In particular, single-frequency coherent anti-Stokes Raman scattering (CARS) and stimulated Raman scattering (SRS) microscopies have demonstrated video-rate imaging [3–5], with a myriad of uses, such as for intrasurgical diagnosis [6], and endoscopy [7–9]. However, the chemical information from single-frequency CRI is often not sufficiently specific to discriminate subtle differences in Raman spectra of various biological molecules. Alternatively, using supercontinuum sources, broadband coherent anti-Stokes Raman scattering (BCARS) microscopy acquires an entire Raman spectrum at each image pixel [10]. Since its first demonstration [11,12], BCARS microscopy technology has been advanced to achieve >100 times faster acquisition speed than spontaneous Raman confocal microscopy [13].
Like other coherent Raman modalities, BCARS signal generation is a nonlinear multiphoton process. In particular, BCARS utilizes tightly focused ultra-short (femtosecond) pulses to achieve broadband vibrational stimulation. The resulting high peak power, however, may result in photo-induced sample damage. For a given sample, the photodamage threshold sets an upper limit on laser power and signal intensity, which greatly affects data quality. Multiphoton photodamage can occur in various forms [14]. Chemical and physical damage is associated with irreversible molecular reactions and structural changes, such as photo-bleaching and destruction of cellular membranes and tissue structures [15]. Biological damage can occur as temporary or permanent disruption of cell physiology [16,17].
One method to reduce the probability of photodamage in optical microscopy is to increase scanning speed [18,19]. It is rather straightforward to increase the scanning speed in single-frequency CRI, where a single-element detector can be easily synchronized with the movement of the sample or of the beam [3,20,21]. However, broadband or hyperspectral CRI requires multielement detection, such as a CCD-equipped spectrometer, which is often significantly slower than single-element detectors. Lim et al. reported that a method to reduce data transfer time by synchronizing beam-scanning with vertical shifting speed on a CCD [22,23]. However, charge transfer time per spectrum still limit the overall imaging speed.
Another approach to circumvent the problem of a slow detector in hyperspectral imaging is the slit-acquisition method, which was demonstrated in spontaneous Raman microscopy [24–26]. For example, a cylindrical lens was used to create line-shaped illumination, and all spectra from the line of illumination were collected in the form of a two-dimensional CCD image without moving the beam or sample. In this approach, each CCD exposure is relatively long, but spectral data for the entire line of illumination is acquired simulatenously and without sample movement delays. This technique, however, is not practically suitable for multiphoton imaging as distributing the laser power over an extended line significantly decreases nonlinear signal strength.
In this study, we have combined the above two approaches, beam-scanning and slit-acquisition, in order to improve hyperspectral coherent Raman imaging speed. We find that beam-scanning by a 3.5 kHz resonant mirror lowers the photodamage probability and consequently improves the signal intensity by allowing for higher laser power. We compared the beam-scanning approach with the equivalent sample-scanning mode in terms of spatial resolution, photodamage probability, and the overall imaging speed at the maximum laser power below a photodamage threshold.
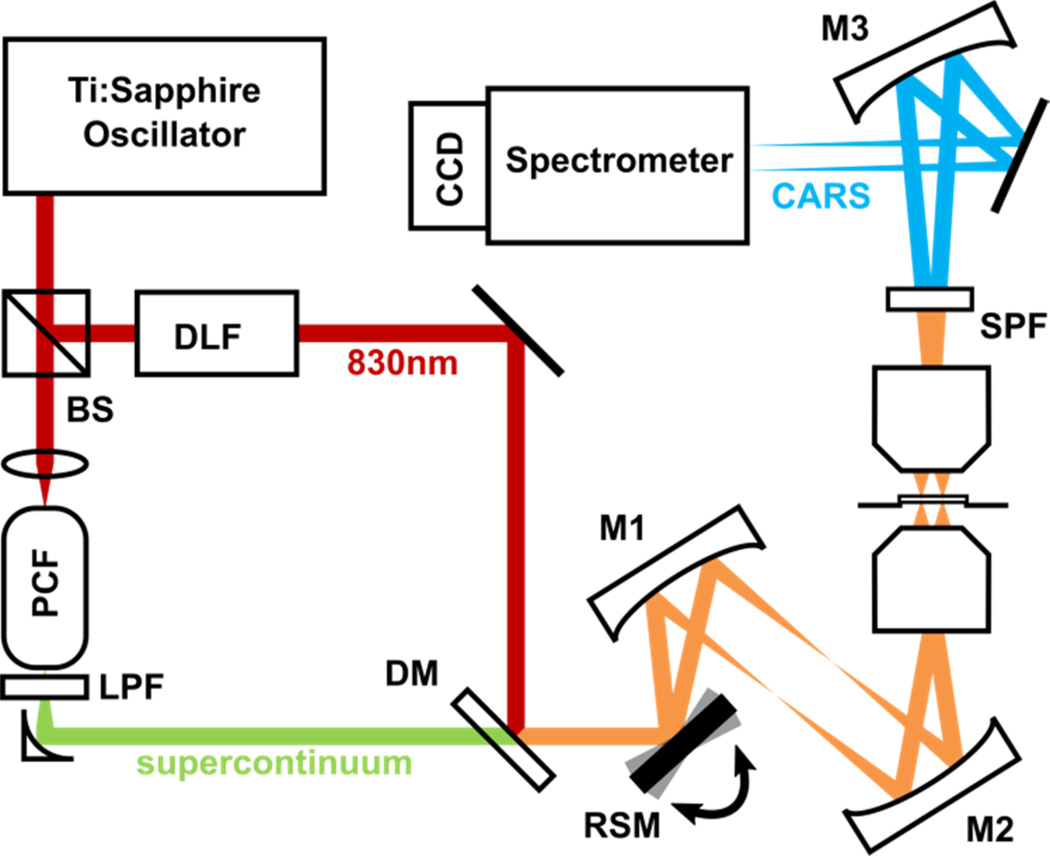
Figure 1 shows the schematic diagram of our beam-scanning BCARS imaging system, which was modified from the conventional sample-scanning BCARS system [27]. A femtosecond pulse from a Ti:Sapphire oscillator, centered at 830 nm (14 nm full-width-half-maximum [FWHM]), is split into two paths. In one path, the spectral bandwidth is reduced to 0.85 nm FWHM by a dispersion-less filter [11,28]. In the other beam path, a supercontinuum (850 ~ 1150 nm) is generated by a photonic crystal fiber (FemtoWHITE 800, NKT Photonics) and collimated by an off-axis parabolic mirror. The narrowband and continuum beams are combined at a dichroic mirror and introduced into the beam-scanning assembly, which consists of a resonant scanning mirror (operating at 3.5 kHz, SC-30, Electro-Optical Products Corp.) and two concave mirrors (focal lengths: 250 mm). A water immersion objective lens (60× 1.2 numerical aperture [NA], Olympus) focuses the laser beam onto a sample, which is located on a stepping-motor XY translational stage (MS-2000, Applied Scientific Instrumentation). The generated CARS signal is collected and collimated in the transmissive direction by another objective lens (60× 0.7 NA, Olympus) and short-pass filtered (800 nm) to remove residual excitation light. The anti-Stokes light is focused by a concave mirror (focal length: 250 mm) onto the slit of a spectrometer (IsoPlane SCT-320, Princeton Instruments). A cylindrical lens with long focal length (1000 mm) is located in front of the slit to correct residual astigmatism. A CCD camera with 1024×256 pixels (BRDD-920, Andor) is attached to the spectrograph and acquires the signal with a vertical field of view of 80 µm, which is determined by the effective magnification of the collection assembly (the collimating objective and the focusing concave lens) and the vertical height of the CCD.
Fig. 1.
Schematic of the beam-scanning BCARS imaging system. DLF, dispersion-less filter; PCF, photonic crystal fiber; LPF, long-pass filter; DM, dichroic mirror; RSM, one-axis resonant scanning mirror; SPF, short-pass-filter.
For maximum BCARS signal generation over the broadest frequency range, it is necessary to achieve the maximum spatial and temporal overlaps between the continuum and the narrowband beams at the focus. Chromatic aberration and temporal dispersion at the focus in the sample significantly deteriorate the obtainable spectral breadth and the BCARS signal intensity; thus, reflective optics were used throughout the optical beam path except the excitation and collection objectives.
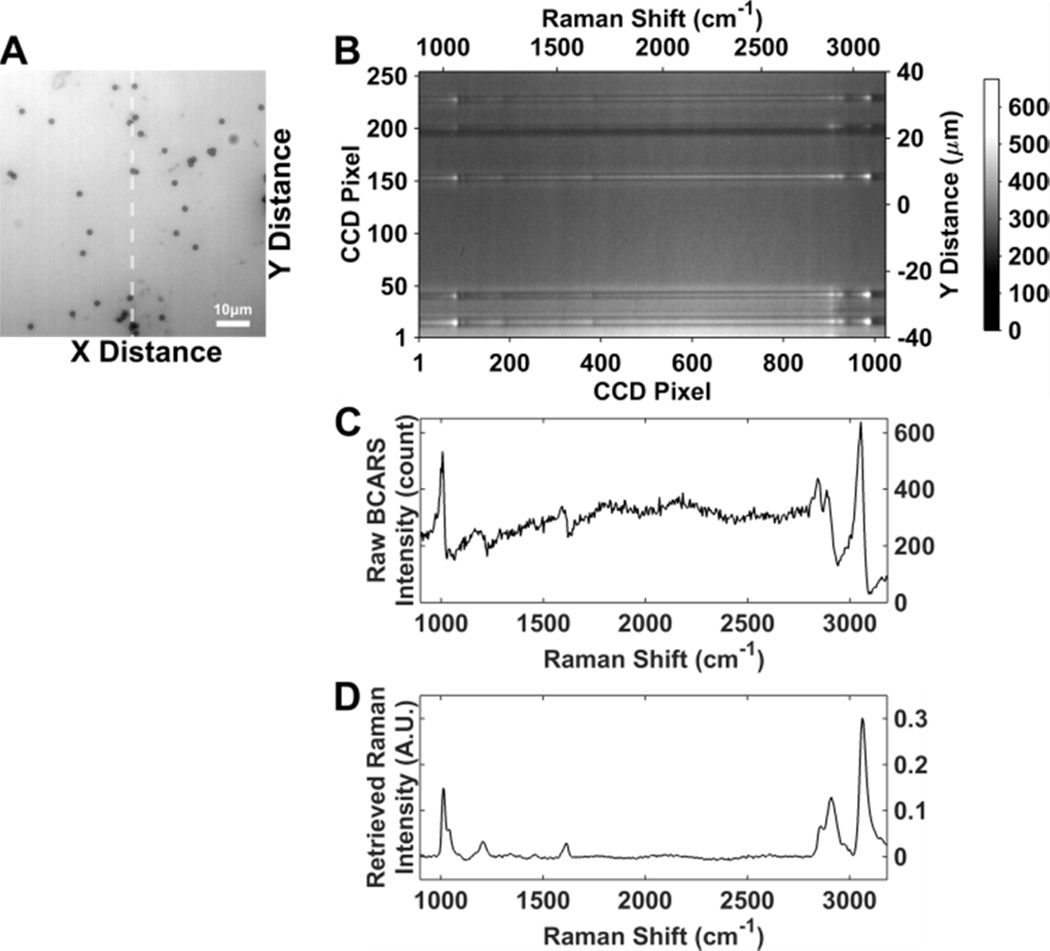
Figure 2(A) shows the bright-field image of 1 µm diameter polystyrene beads dried on a glass coverslip. In the beam-scanning mode, BCARS spectra from one line of excitation, the “fast-scanning axis”, are acquired as a two-dimensional CCD image, where the vertical axis represents the position in the scanned line, and the horizontal axis represents spectral frequency. Figure 2(B) shows an example CCD image acquired from a line of excitation in Fig. 2(A) (dashed white line). Figure 2(C) shows an unprocessed BCARS spectrum of a single polystyrene bead. The unprocessed BCARS spectrum, which consists of (vibrationally) resonant and non-resonant contributions, is converted into a Raman spectrum by the Kramers–Kronig method [27,29], as shown in Fig. 2(D).
Fig. 2.
(A) A bright-field image of polystyrene beads dried on a glass coverslip. (B) The raw CCD image corresponding to the beam-scanning line along the dashed line in (A). The horizontal axis of the CCD image represents wavelength or Raman shift, and the vertical axis corresponds to the fast-scanning axis (the Y-axis) on the image (A). (C) A raw unprocessed BCARS spectrum of a polystyrene bead. (D) A Raman spectrum is retrieved from the raw BCARS spectrum by processing the data using Kramers–Kronig relation followed by the detrending method (details are described elsewhere [27,29]).
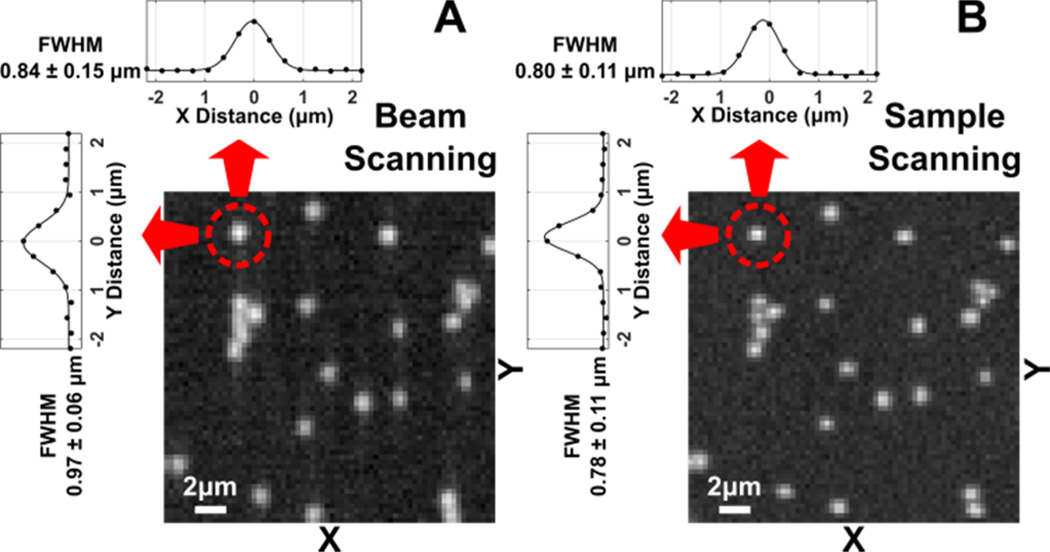
We use BCARS images of polystyrene beads with 1 µm diameter to compare the spatial characteristics of the beam-scanning mode with that of the sample-scanning mode. In Fig. 3, X- and Y-axis Raman intensity profiles of each isolated bead are fitted with a Gaussian function to calculated FWHM values. Figure 3(A, insets) shows the average FWHM values of 14 beads as acquired with beam-scanning. The Y-axis is the fast-scanning axis and the sample itself moved along the X-axis. The Y- and X-axis FWHM values are 0.97 µm (standard deviation [s. d.]: 0.06 µm) and 0.84 µm (s. d.: 0.15 µm), respectively. Figure 3(B) shows the same region imaged through traditional raster-movement of the sample with a fixed beam position. The average FWHM values are 0.78 µm (s. d.: 0.11 µm) for the Y-axis and 0.80 µm (s. d.:0.11 µm) for the X-axis. Along the stage-movement axis (X), beam-scanning shows similar performance to sample-scanning as expected. However, along the beam-scanning axis (Y), the diameter is overestimated by approximately 15–25%, which must be due to optical aberrations in the collection assembly or spectrometer. Conversely, the beam-scanning method demonstrates a significant reduction (≈60 %) in the standard deviation, indicating that the point-by-point repeatability of the sample-stage motion may be non-negligible. This indicates that the beam-scanning method would excel under sample conditions that necessitate high relative-position fidelity. Furthermore, future alterations in the optical train, such as lengthening reflective optic focal lengths or using NA-matched objective lenses, may ameliorate the spatial elongation.
Fig. 3.
Comparison of BCARS images of 1 µm polystyrene beads acquired in (A) the beam-scanning (exposure time: 3 s/line, narrowband powers of 25 mW, continuum power: 15 mW) and (B) the sample-scanning (exposure time: 30 ms/pixel, narrowband powers of 13 mW, continuum power: 7 mW) modes. The images are constructed from the retrieved Raman intensity at 3,068 cm−1. The horizontal and vertical line profiles of the identical bead marked in the red circle are shown at the top and the left of the images, respectively. The displayed FWHM values (mean ± standard deviation) are calculated from the FWHMs (determined by Gaussian-fitting) of 14 isolated beads in the imaged area.
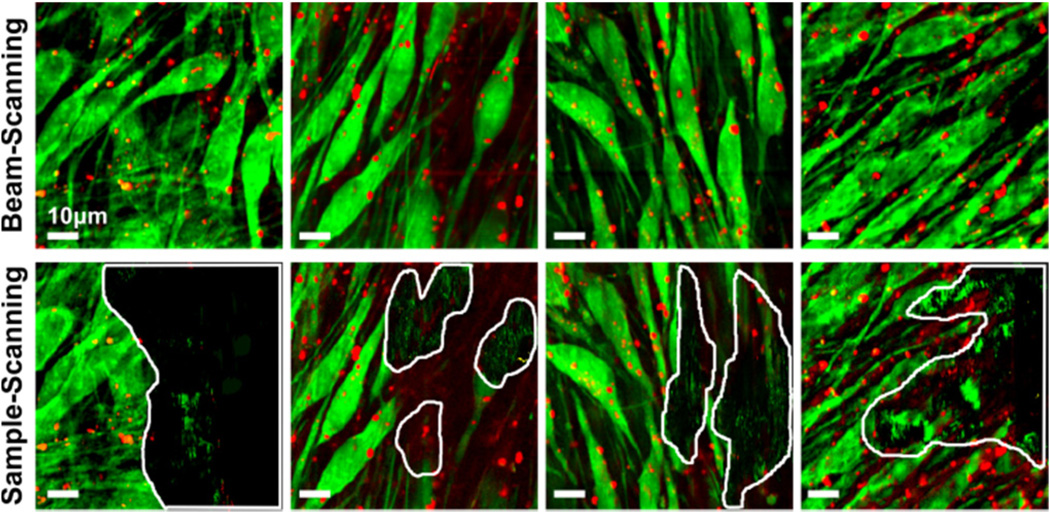
Figure 4 shows pseudo-colored BCARS images of MC3T3 cells (cultured for 14 days) acquired by the beam-scanning mode (top row) and the sample-scanning mode (bottom row). The exposure time of 10 s/line was used in the beam-scanning mode, which determined the equivalent exposure time in the sample-scanning mode (30 ms/pixel). The same laser power was used for both scanning modes, 20 mW for the narrowband source and 15 mW for the continuum at the sample position. While the BCARS images from the beam-scanning mode do not show any apparent physical damage, the images acquired by the equivalent sample-scanning mode contain significantly damaged area. We examined four separated regions of the MC3T3 sample and found that all images from the sample-scanning mode showed physical damages, on average, in 40 % of the imaged area.
Fig. 4.
Pseudo-colored BCARS images of MC3T3 cells (80×80 µm, 254×254 pixel). The image contrasts were constructed based on the intensity difference between two Raman shift frequencies (Red: I(2859 cm−1) – I(2953 cm−1), Green: I(2923 cm−1) – I(2854 cm−1)). No physical damage was observed in all areas of the sample in the beam-scanning mode (top row), while several damaged areas were found after the BCARS imaging in sample-scanning mode (bottom row). The damaged areas are highlighted with white boundary lines. The total acquisition time per image was 42 min for both methods.
The clear difference in photo-induced physical damage between the beam- and sample-scanning images suggests that the observed photodamage occurs mostly via an “interpulse” damage mechanism, rather than an “intrapulse” damage mechanism. We define an intrapulse damage mechanism when a photodamage process is completed by each pulse before the subsequent pulses arrive. In this case, the degree of photodamage is linearly proportional only to the total number of pulses at the specific location but is not affected by intermittency of the pulse sequence. In contrast, interpulse damage occurs when transient photo-products, including photo-excited states or heat, enhance photodamage by the subsequent pulses. It take a certain period for transient products to be sufficiently accumulated to cause measurable sample damages. Interpulse damage can occur when the irradiation time, which determines the number of pulses, is longer than the build-up time needed for photodamage by transient products. Beam-scanning speed determines the irradiation time at a focused sample area, and faster scanning speed means reduced irradiation time and reduced interpulse damage probability. The fact that photodamage is significantly reduced in the beam-scanning mode strongly suggests that an interpulse damage mechanism contributes dominantly to the observed physical photodamage. The scanning speed of the beam-scanning modes is 0.63 m/s. Then, the number of pulses (for a repetition rate of 80 MHz) irradiated over a spot size (≈500 nm) in a single sweep can be estimated as 63 pulses for 0.79 µs, which are repeatedly irradiated to the same location every 0.14 ms for 10 s as the beam moves back and forth. On the contrary, in the sample-scanning mode, one sample location is continuously irradiated for 39 ms (30 ms of CCD exposure time and 9 ms of data collection overhead), equivalent to 3.1×10⁶ pulses. The total number of pulses irradiated at a sample location is similar for the beam- and the sample-scanning modes, as suggested by the similar BCARS signal counts for the two modes. However, the continuity of irradiation greatly affects the probability of photodamage. From the above time scales, we can estimate that it takes longer than 0.79 µs for an interpulse photodamage to occur and that the transient photo-products disappear within 0.14 ms. Heat-associated mechanisms have been proposed for multiphoton-induced damaging by MHz femtosecond pulses used for coherent Raman imaging systems [15,30,31]. For example, the photodamage probability is reduced in the beam-scanning mode as the fast moving laser beam allows photo-induced heat to be dissipated preventing damage by hear accumualtion. While in the sample-scanning mode, a single spot is irradiated for 39 ms, which appears long enough to build up the heat and cause physical damage. However, it must be noted that the time scale estimates and the suggested mechanism can be a function of the sample properties and laser parameters.
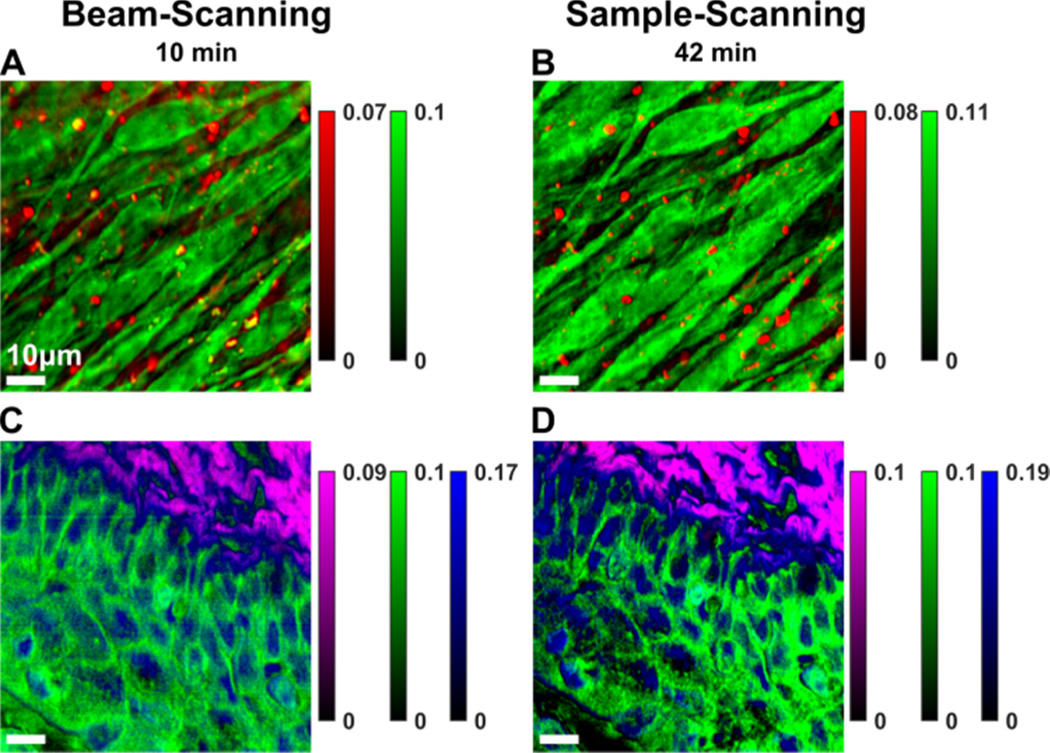
The lower photodamage probability in the beam-scanning mode suggests that higher laser powers can be applied, which generates a stronger signal per unit time. This enables shorter imaging time for the same signal intensity. Whereas Fig. 4 compared beam-scanning and sample-scanning with the same incident laser intensities, Fig. 5 compares these two methods with laser powers adjusted below the sample photodamage threshold for each scan method as heuristically determined. For the sample-scanning mode [Fig. 5 (B, D)], the exposure time was 30 ms with narrowband and conintuum powers of 13 mW and 7 mW, respectively. The total imaging time was 42 minutes (254×254 pixels). In the beam-scanning mode, the lasers powers were ≈50% more intense with average powers of 25 mW and 15 mW for the narrowband and continuum sources, respectively. The exposure time for each sample line was 3 s; thus, the imaging time was reduced to 10 min [see Fig. 5 (A, C)]. Comparing the image panels confirms that beam-scanning with higher power requires less time to generate similar imagery. Of note: the beam-scanning acquisition could potentially have been performed at an even faster rate if more laser power were available, i.e., the sources were at maximum power.
Fig. 5.
Pseudo-colored BCARS images of (A), (B) MC3T3 cells, (Red: I(2859 cm−1) – I(2953 cm−1), Green: I(2923 cm−1) – I(2854 cm−1)); and (C), (D) murine vaginal tissue, (Purple: I(2967 cm−1) – I(2921 cm−1), Green: I(2919 cm−1)– I(2967 cm−1), Blue: I(2975 cm−1)– I(2883 cm−1)). The beam-scanning mode was used for images (A) and (C), and the sample-scanning mode was used for (B) and (D). The total acquisition time was 10 min in the beam-scanning mode (A), (C) and 42 min in the sample-scanning mode (B), (D). The image size is 80×80 µm by 254×254 pixels.
Additionally, the slit-acquisition method is inherently efficient as data collection overhead (including CCD charge transfer, data transfer, and stage movement delays) are per imaging line rather than per pixel as is the case of sample-scanning. In the current system, sample-scanning needs data collection overhead of 2.9 s/line or 11 ms/pixel for an imaging line of 254 pixels, while beam scanning requires 0.34 s/line or 1.3 ms/pixel. The extra delays of sample-scanning further increase sample laser exposure time, increasing the probability of damage.
In summary, we have developed a beam-scanning technique combined with slit-acquisition for rapid hyperspectral coherent Raman imaging microscopy. By introducing a resonant scanning mirror, a laser beam quickly scans over a line on the sample focal plane and the photodamage probability of a sample is reduced. This reduction in photodamage probability was demonstrated using BCARS imaging of biological samples, and showed that the imaging condition and quality can be further optimized due to the extended experimental parameters space. In our BCARS imaging system, the beam-scanning mode enabled laser intensities twice as large as those with sample-scanning with no noticeable physical damage of the sample. The benefits of the beam-scanning mode can be extended to other nonlinear hyperspectral imaging techniques where high laser power is needed to generate sufficient levels of signal.
Footnotes
Disclaimers: Certain commercial equipment, instrument, or materials are identified in this paper in order to specify the experimental procedure adequately. Such identification is not intended to imply recommendation or endorsement by the National Institute of Standards and Technology, nor is it intended to imply that the materials or equipment identified are necessarily the best available for the purpose. Official contribution of the National Institute of Standards and Technology; not subject to copyright in the United States.
References
- 1.Evans CL, Xie XS. Annu. Rev. Anal. Chem. 2008;1:883. doi: 10.1146/annurev.anchem.1.031207.112754. [DOI] [PubMed] [Google Scholar]
- 2.Alfonso-García A, Mittal R, Lee ES, Potma EO. J. Biomed. Opt. 2014;19:71407. doi: 10.1117/1.JBO.19.7.071407. [DOI] [PMC free article] [PubMed] [Google Scholar]
- 3.Cheng J-X, Jia YK, Zheng G, Xie XS. Biophys. J. 2002;83:502. doi: 10.1016/S0006-3495(02)75186-2. [DOI] [PMC free article] [PubMed] [Google Scholar]
- 4.Evans CL, Potma EO, Puoris’haag M, Côté D, Lin CP, Xie XS. Proc. Natl. Acad. Sci. 2005;102:16807. doi: 10.1073/pnas.0508282102. [DOI] [PMC free article] [PubMed] [Google Scholar]
- 5.Saar BG, Freudiger CW, Reichman J, Stanley CM, Holtom GR, Xie XS. Science. 2010;330:1368. doi: 10.1126/science.1197236. [DOI] [PMC free article] [PubMed] [Google Scholar]
- 6.Ji M, Orringer DA, Freudiger CW, Ramkissoon S, Liu X, Lau D, Golby AJ, Norton I, Hayashi M, Agar NYR, Young GS, Spino C, Santagata S, Camelo-Piragua S, Ligon KL, Sagher O, Xie XS. Sci. Transl. Med. 2013;5:201ra119. doi: 10.1126/scitranslmed.3005954. [DOI] [PMC free article] [PubMed] [Google Scholar]
- 7.Veilleux I, Doucet M, Coté P, Verreault S, Fortin M, Paradis P, Leclair S, Da Costa RS, Wilson BC, Seibel E, Mermut O, Cormier J-F. Proc. SPIE. 2010;7558:75580D. [Google Scholar]
- 8.Légaré F, Evans CL, Ganikhanov F, Xie XS. Opt. Express. 2006;14:4427. doi: 10.1364/oe.14.004427. [DOI] [PubMed] [Google Scholar]
- 9.Balu M, Liu G, Chen Z, Tromberg BJ, Potma EO. Opt. Express. 2010;18:2380. doi: 10.1364/OE.18.002380. [DOI] [PMC free article] [PubMed] [Google Scholar]
- 10.Camp CH, Jr, Cicerone MT. Nat. Photonics. 2015;9:295. doi: 10.1038/nphoton.2014.145. [DOI] [PMC free article] [PubMed] [Google Scholar]
- 11.Kee TW, Cicerone MT. Opt. Lett. 2004;29:2701. doi: 10.1364/ol.29.002701. [DOI] [PMC free article] [PubMed] [Google Scholar]
- 12.Kano H, Hamaguchi H. Appl. Phys. Lett. 2005;86:121113. [Google Scholar]
- 13.Camp CH, Jr, Lee YJ, Heddleston JM, Hartshorn CM, Walker ARH, Rich JN, Lathia JD, Cicerone MT. Nat. Photonics. 2014;8:627. doi: 10.1038/nphoton.2014.145. [DOI] [PMC free article] [PubMed] [Google Scholar]
- 14.Denk W, Piston DW, Webb WW. Handbook of Biological Confocal Microscopy. Third. Springer; 2006. p. 535. [Google Scholar]
- 15.Fu Y, Wang H, Shi R, Cheng J-X. Opt. Express. 2006;14:3942. doi: 10.1364/oe.14.003942. [DOI] [PubMed] [Google Scholar]
- 16.Tirlapur UK, König K, Peuckert C, Krieg R, Halbhuber KJ. Exp. Cell Res. 2001;263:88. doi: 10.1006/excr.2000.5082. [DOI] [PubMed] [Google Scholar]
- 17.König K, Becker TW, Fischer P, Riemann I, Halbhuber KJ. Opt. Lett. 1999;24:113. doi: 10.1364/ol.24.000113. [DOI] [PubMed] [Google Scholar]
- 18.Borlinghaus RT. Microsc. Res. Tech. 2006;69:689. doi: 10.1002/jemt.20363. [DOI] [PubMed] [Google Scholar]
- 19.Claxton NS, Fellers TJ, Davidson MW. Laser Scanning Confocal Microscopy. Olympus; 2006. Available online at www.olympusconfocal.com/theory/LSCMIntro.pdf. [Google Scholar]
- 20.Duncan MD, Reintjes J, Manuccia TJ. Opt. Lett. 1982;7:350. doi: 10.1364/ol.7.000350. [DOI] [PubMed] [Google Scholar]
- 21.So PTC, Yew EYS, Rowlands C. Biophys. J. 2013;105:2641. doi: 10.1016/j.bpj.2013.08.051. [DOI] [PMC free article] [PubMed] [Google Scholar]
- 22.Chen B-C, Lim S-H. J. Phys. Chem. B. 2008;112:3653. doi: 10.1021/jp710743k. [DOI] [PubMed] [Google Scholar]
- 23.Sung J, Chen BC, Lim SH. J. Raman Spectrosc. 2011;42:130. [Google Scholar]
- 24.Veirs DK, Ager JW, III, Loucks ET, Rosenblatt GM. Appl. Opt. 1990;29:4969. doi: 10.1364/AO.29.004969. [DOI] [PubMed] [Google Scholar]
- 25.Okada M, Smith NI, Palonpon AF, Endo H, Kawata S, Sodeoka M, Fujita K. Proc. Natl. Acad. Sci. 2012;109:28. doi: 10.1073/pnas.1107524108. [DOI] [PMC free article] [PubMed] [Google Scholar]
- 26.Qi J, Shih W-C. Appl. Opt. 2014;53:2881. doi: 10.1364/AO.53.002881. [DOI] [PubMed] [Google Scholar]
- 27.Parekh SH, Lee YJ, Aamer KA, Cicerone MT. Biophys. J. 2010;99:2695. doi: 10.1016/j.bpj.2010.08.009. [DOI] [PMC free article] [PubMed] [Google Scholar]
- 28.Weiner AM, Heritage JP, Kirschner EM. J. Opt. Soc. Am. B. 1988;5:1563. [Google Scholar]
- 29.Liu Y, Lee YJ, Cicerone MT. J. Raman Spectrosc. 2009;40:726. doi: 10.1002/jrs.4824. [DOI] [PMC free article] [PubMed] [Google Scholar]
- 30.Vogel A, Noack J, Hüttman G, Paltauf G. Appl. Phys. B. 2005;81:1015. [Google Scholar]
- 31.Wang H, Fu Y, Cheng J-X. J. Opt. Soc. Am. B. 2007;24:544. [Google Scholar]


