

Abstract
Background
We explored whether, the Pathobiological Determinants of Atherosclerosis in Youth (PDAY) coronary and abdominal risk scores measured at ages 18–30 years and changes in these scores would more strongly predict coronary artery calcium (CAC) and abdominal aortic calcium (AAC) assessed 25 years later, than scores measured 25 years later.
Methods and Results
In the Coronary Artery Risk Development in Young Adults study, 3008 participants had measurements of risk score components at 5 year intervals beginning at ages 18–30 years. CAC and AAC were assessed at age 43–55 years. Odds ratios (OR) for presence and extent of CAC/AAC per/point higher score and c-statistics for predicting CAC/AAC were calculated. Prevalence of CAC was 28% and AAC was 53%. For each one point higher PDAY score, odds of CAC were higher using baseline scores than year 25 scores (OR 1.29 [95% CI 1.25–1.33] vs 1.12 [1.11–1.14]). For AAC, ORs at years 0 and 25 were similar (1.29 [1.24–1.34] vs 1.22 [1.19 –1.26]). C-statistic for CAC prediction was higher at year 0 than year 25 (0.731 vs 0.705) but similar at years 0 and 25 for AAC (0.665 vs 0.670). ORs for CAC were highest at baseline, and for AAC, year 10. Including change in PDAY scores with baseline scores improved prediction.
Conclusions
Atherosclerosis risk and change in risk assessed in young adulthood years prior to subclinical atherosclerosis imaging provide strong prediction of future subclinical atherosclerosis. CAC and AAC reflect chronic risk exposure in addition to risk measured at time of study.
Keywords: atherosclerosis, coronary artery calcium, prevention, risk score
Introduction
The Pathobiological Determinants of Atherosclerosis (PDAY) risk scores were developed to predict the likelihood of having advanced atherosclerosis in the coronary arteries or abdominal aorta by relating risk factors measured post mortem to measured atherosclerosis in these arteries.1, 2 In the Coronary Artery risk Development in Young Adulthood (CARDIA) study, the PDAY risk score measured at ages 18–30 years and 15-year change in the score predicted the likelihood of coronary artery calcium (CAC) assessed by CT scan 15 years later.3 In the Cardiovascular Risk in Young Finns study, the coronary PDAY score measured in adolescence and change in score predicted future carotid intima media thickness measured in young adulthood.4. These results support similar results from the Bogalusa Heart Study, the Muscatine study, and additional analyses from the CARDIA and Young Finns studies that have shown the importance of risk factor levels in early life in the development of atherosclerosis later in adulthood.5–8
During the CARDIA year 25 examination, chest and abdominal CT scans were performed. We sought to determine whether the coronary artery PDAY score predicted CAC 25 years in the future and compare this prediction to our prior work.3 We also explored whether the abdominal aortic PDAY score, not previously evaluated in living individuals, predicted the development of abdominal aortic calcification (AAC). We hypothesized that scores measured many years prior to CAC and AAC measurement would perform better than scores measured closer to obtaining the CT scan.
Methods
The PDAY scores were developed from modeling relationships among risk factors measured post-mortem and atherosclerosis in the coronary arteries found in 15–34 year old persons who died from external causes: accidents, suicide, or homicide.1 The PDAY risk scores were scaled so that a 1 point increase in score was associated with the odds ratio for an increase in advanced atherosclerotic lesions that would develop with 1 year of aging. The point value for each of the risk factors for the coronary artery and abdominal aortic scores are shown in Table 1. Note that the risk values for the abdominal and coronary scores are different.
Table 1.
Pathobiological Determinants of Atherosclerosis in Youth (PDAY) Risk Scores for Abdominal Aorta Calcium (AAC) and Coronary Artery Calcium (CAC).
| Risk Factor | Abdominal Aorta |
Coronary Arteries |
|
|---|---|---|---|
| Age | |||
| 15–19 | 0 | 0 | |
| 20–24 | 5 | 5 | |
| 25–29 | 10 | 10 | |
| 30–34 | 15 | 15 | |
| Sex | |||
| Male | 0 | 0 | |
| Female | 1 | −1 | |
| Non-HDL cholesterol, mg/dL | |||
| <130 | 0 | 0 | |
| 130–159 | 1 | 2 | |
| 160–189 | 2 | 4 | |
| 190–219 | 3 | 6 | |
| ≥220 | 4 | 8 | |
| HDL cholesterol, mg/dL | |||
| <40 | 0 | 1 | |
| 40–59 | 0 | 0 | |
| ≥60 | 0 | −1 | |
| Smoking | |||
| Nonsmoker | 0 | 0 | |
| Smoker | 4 | 1 | |
| Blood Pressure | |||
| Normotensive | 0 | 0 | |
| Hypertensive | 3 | 4 | |
| Obesity (BMI, kg/m2) | |||
| Men | |||
| ≤30 | 0 | 0 | |
| >30 | 0 | 6 | |
| Women | |||
| ≤30 | 0 | 0 | |
| >30 | 0 | 0 | |
| Hyperglycemia (glycohemoglobin, %) | |||
| <8 | 0 | 0 | |
| ≥8 | 3 | 5 | |
The CARDIA study recruited 5115 generally healthy black and white men and women aged 18–30 years in 1985–86 at 4 sites: Birmingham, AL; Chicago, IL: Minneapolis, MN; and Oakland, CA with a long term goal of studying cardiovascular risk evolution from young adulthood into middle age.3 Examinations every 2–5 years have been conducted over the subsequent 25 years. With regard to this analysis, data were utilized from the baseline, year 5, year 10, year 15, year 20, and year 25 examinations including chest CT scans performed in years 15, 20, and 25 and an abdominal CT scan performed in year 25. IRB approval was obtained from participants at each examination.
The sample for this study (n=3008) did not include those who had died or did not attend the year 25 exam (n=1617), were missing year 25 CAC or AAC (n=381) or were missing data necessary for the calculation of the coronary or abdominal aorta PDAY scores at year 0 or year 25 (n=109). Those included were less likely to be male and black, had lower blood pressure, smoked less, and were older.9 (data not shown)
Measurement of CAC and AAC using CT: ECG-gated scans of the heart used to determine CAC were performed using a standard protocol that has been described in detail10. At years 15 and 20, two sequential heart scans were obtained and their scores averaged whereas a single scan was obtained at year 25. Image analysis was performed at a central reading center (Wake Forest University Health Sciences, Winston-Salem, NC). Trained technicians measured CAC on a workstation with FDA approved calcium scoring software (Aquarius Workstation, TeraRecon, Foster City, CA). The Agatston score, corrected for slice thickness with a minimum lesion size of 4 adjacent pixels (minimum area of 1.87 mm2) and attenuation threshold of ≥130 Hounsfield units is reported11. For analyses comparing absence to presence of CAC or AAC, any CAC or AAC was considered a positive result. The previously reported year 15 CAC scores (read at a different site) were reanalyzed using the year 20 and 25 software and readers to ensure longitudinal standardization. A physician adjudicated the CAC scores, under the following conditions: discordant for CAC presence within paired scans at years 15 and 20, a score change of >200, a change in CAC status from positive to negative, or a potential surgical intervention (pacemaker, valve replacement, intracoronary stent, coronary bypass surgery). In those with confirmed intracoronary stents (n=36: 2 at year 15, 9 at year 20, and 25 at year 25), the stented area was excluded from the vessel score, 100 Agatston units were added to account for potential obscured calcifications, and the remaining vessels were scored. In participants with coronary artery bypass grafting (n=7: 3 at year 20 and 4 at year 25), only the native coronary arteries were scored for calcifications. The accuracy, comparability, reproducibility, and robustness of the calcium score using electron beam, helical, and multi-detector CT systems have previously been published12–14. At year 25 only, AAC was measured in the distal abdominal aorta in a 60-mm segment centered at the aortic bifurcation15, 16. At year 25, the interclass correlation coefficient for inter-reader comparisons was 0.999 for both CAC and AAC, and intra- and inter-reader error were 5.6% and 7.0% for CAC, and 6.4% and 8.6% for AAC, respectively, in 156 scans that were blinded and reevaluated.
For score calculation, height and weight were measured in light clothing and body mass index (BMI) calculated. Blood pressure (BP) was measured three times after a 5 minute rest with the last 2 values averaged. Hypertension was defined as blood pressure > 130/85 mm HG or taking anti-hypertensive medication. Tobacco use was assessed by questionnaire. Total cholesterol and HDL cholesterol were measured by enzymatic techniques and non-HDL cholesterol was calculated as the difference between total and HDL cholesterol. Diabetes mellitus status was determined using American Diabetes Association criteria; history of hypoglycemic medication use (all examinations), fasting blood sugar (Years 0, 10, 15, 20, and 25), glucose tolerance test (Years 10, 20 and 25), and hemoglobin A1c (Years 20 and 25) were used when available.17
Coronary and abdominal aorta PDAY scores were computed for the cohort at each of the CARDIA examinations of interest – years 0, 5, 10, 15, 20, and 25. Because CARDIA participants were outside of the 15 to 34 years age range at the years 5, 10, 15, 20, and 25 exams, age was not used in the computation of the coronary or abdominal PDAY risk scores. Rather, age at CAC assessment was adjusted for in analyses. Since race was not significant in the PDAY analysis, race was not considered as an independent variable in analyses. Descriptive statistics for PDAY risk scores were tabulated by examination year. Four analyses were conducted. First, for each PDAY score logistic regression adjusting for age at CAC measurement was used to assess associations with year 25 CAC by computing odds ratios and 95% confidence intervals. Discrimination was assessed with c-statistics, and calibration was tested with the Hosmer-Lemeshow test. C-statistics were compared using the test for correlated ROC curves by DeLong et al (1988). Second, to examine whether change in risk score from year 0 to year 25 improved model fit, we assessed two additional models, both containing the year 25 – year 0 PDAY score difference, but one then containing the year 0 PDAY score and the other containing the year 25 PDAY score.
Third, to determine the impact of early adulthood risk on midlife atherosclerosis, we assessed the association of year 0 PDAY score, when participants were ages 18–30 years, with the likelihood of having CAC at age 40–45. For this analysis, we used the CT scan (year 15, 20, or 25) that corresponded to when the participant was aged 40–45 years.
Fourth, to determine the impact of early life risk and change in risk on incident/change in CAC, we divided the cohort with CAC assessment at years 15 and 25 into approximate tertiles based on initial PDAY coronary artery score and then within each tertile created tertiles of risk change. This created 9 groups to assess likelihood of CAC progression. The group with low baseline risk and no increase in risk was used for comparisons. Out of 3008 participants, 2320 had CAC measured at both year 15 and year 25, and 650 of these had CAC progression defined as any new CAC at year 25 or, if any CAC was present at year 15, then at least 20 Agatston units greater was present at year 25.
Results
Gender specific risk factor distributions and PDAY scores by examination year are presented in Table 2. Mean age--independent PDAY scores increased from CARDIA year 0 to year 25 (coronary: 1.80 to 4.95: abdomen: 1.88 to 3.18). Median PDAY scores are also presented in Table 2; these increased at each exam. For men, the median coronary PDAY score increased from 2 at year 0 to 6 at year 25 and the median abdominal aorta PDAY score increased from 1 to 3 over the same interval. For women, the median coronary PDAY score increased from 0 at baseline to 2 at year 25 and the median abdominal aorta PDAY score increased from 2 to 4 over the same interval.
Table 2.
Characteristics of men and women by examination year for whom Coronary Artery Calcium Scores and Abdominal Aortic Artery Calcium Scores Were Available at Year 25.
| CARDIA Examination by Year | |||||||
|---|---|---|---|---|---|---|---|
| Men |
0 (n =1312) |
5 (n =1228) |
10 (n =1175) |
15 (n =1163) |
20 (n =1155) |
25 (n =1312) |
|
| White Race/ethnicity, % | 56.6 | 58.3 | 58.2 | 59.2 | 59.6 | 56.6 | |
| Age, mean ± SD, y | 25.0 (3.6) | 30.1 (3.6) | 35.0 (3.6) | 40.2 (3.6) | 45.3 (3.5) | 50.1 (3.6) | |
| Non-HDL cholesterol level, mean ± SD, mg/dL | 127 (35) | 132 (38) | 137 (37) | 145 (40) | 139 (38) | 139 (37) | |
| HDL cholesterol level, mean ± SD, mg/dL | 50 (12) | 49 (13) | 45 (13) | 45 (13) | 47 (14) | 51 (15) | |
| Smokers, % | 27.4 | 27.0 | 24.3 | 21.3 | 19.2 | 19.4 | |
| Diabetes mellitus, % | 0.3 | 0.4 | 2.8 | 4.7 | 10.4 | 14.5 | |
| Body Mass index, mean ± SD, kg/m2 | 24.4 (3.7) | 25.9 (4.3) | 27.1 (4.8) | 28.2 (5.2) | 29.0 (6.2) | 29.5 (5.7) | |
| Hypertensive, % | 11.4 | 10.2 | 15.6 | 25.7 | 29.3 | 41.5 | |
| Positive Family History, % | 14.6 | 20.5 | 25.8 | NA | NA | 36.9 | |
| Risk Score, median (25th, 75th percentile) | |||||||
| Coronary PDAY | 2 (0, 4) | 2 (0, 5) | 3 (1, 7) | 5 (2, 9) | 5 (2, 10) | 6 (2, 11) | |
| Abdominal aorta PDAY | 1 (0, 4) | 1 (0, 4) | 2 (0, 4) | 2 (1, 4) | 3 (1, 5) | 3 (1, 5) | |
| Women | 0 (n =1696) |
5 (n =1571) |
10 (n =1519) |
15 (n =1513) |
20 (n =1546) |
25 (n =1696) |
|
| White Race/ethnicity % | 49.7 | 51.2 | 50.4 | 51.3 | 50.9 | 49.7 | |
| Age, mean ± SD, y | 25.1 (3.6) | 30.2 (3.6) | 35.2 (3.6) | 40.2 (3.6) | 45.2 (3.6) | 50.1 (3.7) | |
| Non-HDL cholesterol level, mean ± SD, mg/dL | 122 (32) | 119 (32) | 121 (33) | 126 (33) | 127 (34) | 131 (37) | |
| HDL cholesterol level, mean ± SD, mg/dL | 56 (13) | 57 (13) | 54 (13) | 55 (14) | 59 (16) | 63 (18) | |
| Smokers, % | 25.9 | 23.3 | 20.8 | 17.9 | 16.5 | 15.4 | |
| Diabetes mellitus, % | 0.5 | 0.7 | 3.3 | 5.1 | 9.8 | 14.7 | |
| Body Mass index, mean ± SD, kg/m2 | 24.5 (5.5) | 26.2 (6.5) | 27.7 (7.1) | 29.1 (7.6) | 29.9 (7.7) | 30.8 (8.0) | |
| Hypertensive, % | 3.9 | 5.7 | 11.3 | 20.4 | 27.4 | 39.9 | |
| Positive Family History, % | 15.0 | 21.3 | 27.0 | NA | NA | 40.7 | |
| Risk Score, median (25th, 75th percentile) | |||||||
| Coronary PDAY | 0 (1, 1) | −1 (−1, 1) | 0 (−1, 12) | 0 (−1, 3) | 1 (−1, 14) | 2 (−1, 15) | |
| Abdominal aorta PDAY | 2 (1, 5) | 2 (1, 5) | 2 (1, 5) | 2 (1, 5) | 2 (1, 5) | 4 (1, 6) | |
Table 3 provides the prevalence of CAC at years 15, 20 and 25 by level of CAC categories. Prevalence of any CAC increased from 9.6% at year 15 to 28.1% at year 25. Baseline coronary PDAY score was higher with greater intensity of CAC. Prevalence of any AAC was 52.8% at year 25. AAC was only measured at year 25, and intensity is shown in tertiles. Baseline abdominal aorta PDAY score was also higher with greater intensity of AAC.
Table 3.
Distribution and prevalence of CAC and AAC by examination years.
| CAC categories | ||||||
| 0 | 1–100 | 101–300 | >300 | Total | P-value* | |
| Median coronary PDAY score at Y0 for CAC measured at Y25 | 0 | 1.5 | 2.0 | 4.0 | <0.0001 | |
| Examination Year | ||||||
| Y15 CAC† | 2097 (90.4) | 181 (7.8) | 30 (1.3) | 12 (0.5) | 2320 | |
| Y20 CAC† | 1991 (80.4) | 389 (15.7) | 57 (2.3) | 38 (1.5) | 2475 | |
| Y25 CAC† | 2162 (71.9) | 564 (18.8) | 149 (5.0) | 133 (4.4) | 3008 | |
| Tertiles of AAC | ||||||
| 0 | Tertile 1: 0.5 – 23.1 |
Tertile 2: 23.2 – 198.4 |
Tertile 3: > 198.4 |
|||
| Median abdominal aorta PDAY score at Y10 | 1.0 | 2.0 | 2.0 | 5.0 | <0.0001 | |
| Examination Year | ||||||
| Y25 AAC† | 1420 (47.2) | 529 (17.6) | 530 (17.6) | 529 (17.6) | 3008 | |
P-value for Jonckheere-Terpstra test
Values shown are N (%).
Odds ratios for the presence of CAC at Year 25 according to each 1 point higher coronary PDAY score calculated at each 5-year examination as well as the corresponding c-statistics are shown in Figure 1. The highest odds ratio, 1.29 (1.25–1.33), was noted at baseline, and the lowest, at year 25, 1.12 (1.11–1.14). The Hosmer-Lemeshow test was not significant at each exam (p > 0.09) except for year 20 (p=0.03), indicating acceptable goodness-of-fit for most exams. The c-statistics for exam years 0 to 25 varied from 0.705 at year 25 to 0.740 at year 5. The c-statistics computed for years 0 and 25 were significantly different (p=0.004).
Figure 1.
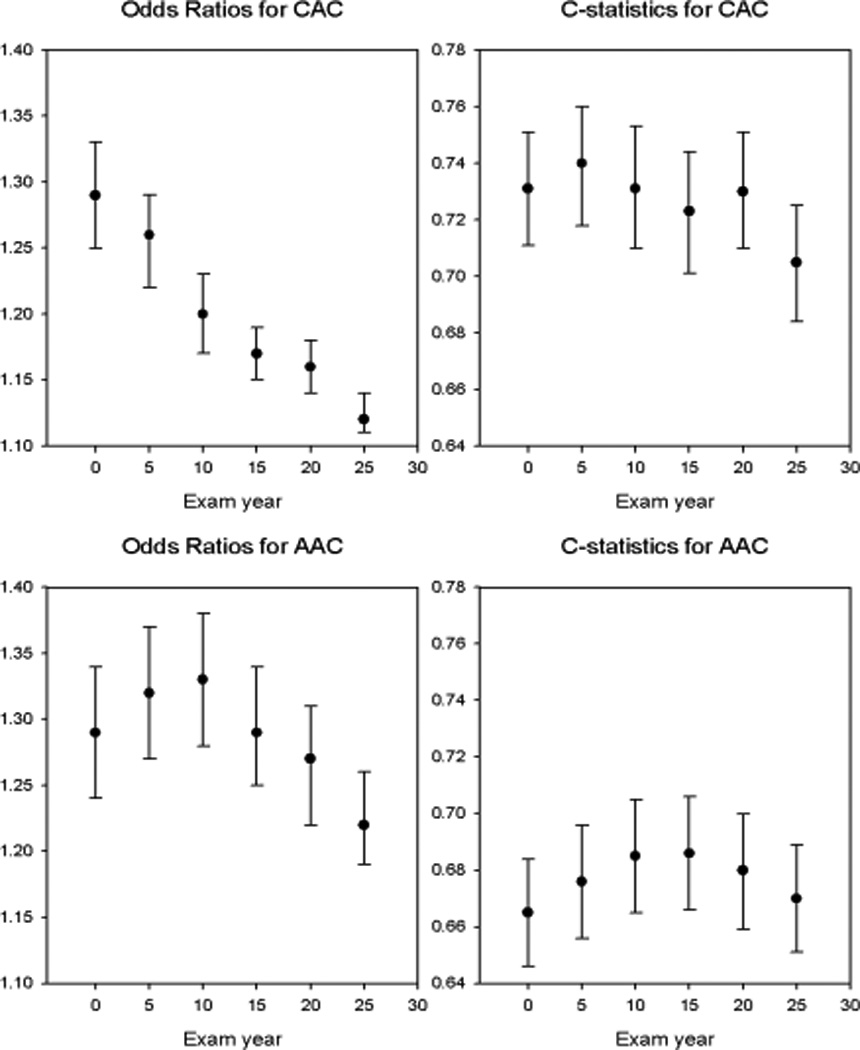
Odds ratios and C-statistics are shown by examination year for PDAY CAC and AAC scores. See text for statistical comparisons. Abbreviations: AAC abdominal aortic calcium, CAC coronary artery calcium, PDAY pathobiological determinants of atherosclerosis in youth.
Odds ratios for the presence of AAC at Year 25 according to each 1 point higher abdominal aortic PDAY score are also shown in Figure 1. PDAY scores calculated using data from years 5 and 10 (OR 1.32 and1.33) had higher odds ratios than those based on year 25 (1.22; CI: 1.19–1.26). The Hosmer-Lemeshow test indicated lack of goodness-of-fit at year 0 (p=0.002) and year 20 (p=0.02), but acceptable goodness-of-fit at all other exams (p ≥ 0.12).. C-statistics were generally equivalent across all examination years with somewhat lower values than for the coronary scores (Figure 1).
For both CAC and AAC prediction, we examined whether change in risk from year 0 to year 25 improved model fit (Table 4). Models were constructed that included baseline PDAY score and change in score over 25 years. The odds ratio for CAC at year 25 for each 1-point higher PDAY score at baseline was 1.31 (1.27–1.35) and for change in score was 1.07 (1.05–1.09) for each 1 point increase in score. The c-statistic increased from 0.731 (0.711 – 0.751) for baseline PDAY score only to 0.745 (0.725 – 0.764) when change in score was included. For AAC, change the 25-year change in score was statistically significant. The odds ratio for ACC at year 25 for each 1 point higher score was 1.40 (1.34–1.46) at baseline and 1.16 (1.13–1.20) for 25-year change, with the c-statistic increasing from 0.665 (0.646 – 0.684) to 0.693 (0.674– 0.712) with inclusion of change in risk. Analyses were repeated using the year 25 scores and change from baseline, the change in risk terms had a similar significance level as above (data not shown). Thus, change in risk, either favorably or unfavorably, was important in determining future atherosclerosis but the odds ratios were lower for change in score.
Table 4.
Odds rations for predicting CAC and AAC at Year 25 examination from Baseline (Year 0 examination) PDAY risk score and change in risk score between Year 0 and Year 25.
| Lesion | Odds ratio (95% CI) | |
|---|---|---|
| Baseline PDAY risk score | Change in PDAY risk score between Year 0 and Year 25 |
|
| CAC | 1.31 (1.27–1.35) | 1.07 (1.05–1.09) |
| AAC | 1.40 (1.34–1.46) | 1.16 (1.13–1.20) |
By using CAC data from the year 15, 20 and 25 examinations, we were able to examine the performance of the coronary PDAY risk score measured at 18–30 years of age for the prediction of CAC at ages 40–45 years. The odds ratio for presence of CAC at age 40–45 years with each 1 point higher score was 1.22 (1.18–1.27) when measured at age 18–30 years and 1.14 (1.11–1.16) when measured at age 40–45 years. The c-statistic calculated at baseline was 0.704 (0.674 – 0.734) and was 0.697 (0.668 – 0.725) when calculated at 40–45 years of age. These results are consistent with the results discussed above.
Baseline PDAY score determined change in CAC between examination years 15 and 25 (Table 5). For each tertile of baseline PDAY score, odds ratios for change in CAC increased as PDAY score increased. For those in the lowest tertile of PDAY score, increase in risk during the study predicted higher likelihood of change in CAC. Those with baseline PDAY risk score of 2 or higher were much more likely to progress.
Table 5.
Odds ratios for either development of incident CAC or 10-year progression (> 20 Agatston units) of coronary artery calcium, by tertiles of PDAY risk score at year 0 and tertiles of change in PDAY risk score from year 0 to year 25.
| PDAY risk score -Year 0 |
Change in PDAY risk score year 0 to year 25 |
N | Odds ratio (95% CI) for CAC progression |
|---|---|---|---|
| −2 to −1 | −1 to 0 | 231 | 1.00* |
| 1 to 4 | 284 | 2.18 (1.16, 4.09) | |
| 5 to 18 | 185 | 2.64 (1.37, 5.10) | |
| 0 or 1 | −3 to 0 | 250 | 3.33 (1.79, 6.18) |
| 1 to 4 | 293 | 5.29 (2.94, 9.51) | |
| 5 to 21 | 283 | 6.06 (3.37, 10.91) | |
| 2 to 18 | −9 to 0 | 281 | 10.71 (6.01, 19.09) |
| 1 to 4 | 255 | 11.59 (6.47, 20.76) | |
| 5 to 20 | 258 | 14.59 (8.16, 26.10) |
Reference
Discussion
The relationship of risk factors measured in adolescence or early adulthood to both atherosclerosis and subclinical atherosclerosis measured in adults aged 30–45 years has been established in several cohort studies from the United States, Finland, and Australia and in black and white men and women.3, 5–7, 18, 19 Showing a strong association of the PDAY risk score measured at age 18–30 years to presence and intensity of subclinical coronary atherosclerosis measured 25 years later extends the relationship of risk early in life to middle age, a time when clinical events are likely to occur. Further, for the first time, we have shown a significant relationship between the PDAY risk score for abdominal atherosclerosis measured in early adulthood to subclinical atherosclerosis measured in middle age. For the coronary arteries, PDAY risk measured at age 18–30 years strongly predicts CAC, a noninvasive measure of advance atheroma. Change in risk improves the estimate. Increase in CAC also appears to be driven by baseline risk and change in risk over time. For the abdominal aorta, risk measured at age 28–40 years predicts AAC best and again change in risk adds information to risk prediction. These data add strength to the observational evidence that early intervention to prevent atherosclerosis may have an important impact on atherosclerotic vascular disease prevention.
By showing that risk measured up to 25 years prior to CAC assessment, predicts CAC, our data suggest that CAC may be a measure of cumulative risk exposure. CAC reclassifies risk for atherosclerotic and other forms of heart disease in older individuals.20, 21. These estimates are based on combining, in prediction models, risk factors measured at the time of subclinical atherosclerosis imaging to measures of subclinical atherosclerosis. If CAC represents the integrated risk burden over the individual’s lifetime history of exposure, our data, suggests that risk reclassification provided by CAC score likely encodes the cumulative exposure to CVD risk over the lifetime. This cumulative risk encoded in the presence and amount of CAC is not captured by point estimates of CVD risk factors measured in middle adult life and is in fact better predicted by risk factors measured in early adulthood.
That change in risk adds information to CAC and AAC prediction models is important for prevention strategies. Lowering risk from age 18–30 years lowers likelihood of future atherosclerosis while increasing risk increases likelihood. These results are consistent with observations from the Cardiovascular Risk in Young Finns Study where carotid intima media thickness was similar in individuals who were obese in adolescence and normal weight as adults to that of individuals who were lean throughout the study.18
This study is consistent with prior reports from the CARDIA study and the Cardiovascular Risk in Young Finns study where risk measured at age 18–30 years strongly predicts coronary calcium and carotid intima media thickness measured 15 years later3, 4, 8. Analyses of risk factor trajectories for blood pressure and lipids from CARDIA have shown that both baseline risk and the burden or risk over time are important in predicting intermediate outcomes such as CAC and left ventricular dysfunction assessed by echocardiography.22–24 In these risk trajectory models, baseline blood pressure or obesity risk carries more weight than risk exposure over time.
The PDAY abdominal score did not predict AAC in the future as well as the coronary score. This may be because the risk factors for AAC have different weights in the prediction algorithm than for CAC, with tobacco use being the most important risk factor for AAC. Tobacco use, either because of addiction (and unvarying risk) or because tobacco use causes irreversible abdominal aortic injury early in life may be part of the reason. Our results are consistent with the high attributable risk of tobacco use for abdominal aortic aneurysms.25
There are two major limitations to this paper. First, CAC and AAC measure advanced atherosclerosis, and are an estimate but not a direct measure of total atherosclerosis burden. Thus, these assessments lack precision. Second, the PDAY risk score reflects post-mortem risk measurements. For some risk factors, such as blood pressure, only categorical classification of hypertension vs. normotension were provided. Socioeconomic status and family history cannot be included in the score. We have previously shown that risk estimated based on lipid measures underestimates risk associations because of concentration changes induced by resuscitation and other post mortem changes.26 For these reasons we believe that the risk estimates in this study underestimate the ability to predict future atherosclerotic burden.
We have previously suggested an alternative model for preventing atherosclerosis, resetting the vascular clock by intervening earlier in the course of atherosclerosis at a time when progression of vascular lesions may be impeded or more reversible.27 Controlling risk factors in youth would be most effective in preventing atherosclerotic heart disease by retarding the progression of lesions to advanced stages.28 Atherosclerosis begins to progress from the teen age years in association with risk scores, and progression proceeds dramatically in the third and fourth decades of life. Clinical trials suggest better event reduction in those with high lifetime rather than proximate risk.29 Animal models of atherosclerosis confirm the opportunity for atherosclerosis regression with treatment.30
Our findings may help with a two pronged approach to the atherosclerosis prevention effort: population-based risk assessment for primordial prevention in the population at large and identification of those at highest risk for early development of advanced lesions with treatment earlier in the course of atherosclerosis to achieve regression.31
Clinical Perspectives.
Clinically silent, atherosclerosis begins at a young age. Cardiovascular risk factors measured in youth and young adulthood predict future subclinical atherosclerosis. Risk scores derived from the PDAY study, where atherosclerosis was directly measured post mortem in the coronary artery and abdominal aorta and correlated with cardiovascular risk factors, was calculated for CARDIA study participants with risk factors measured at age 18–30 years and at intervals thereafter. This score predicted both coronary artery and abdominal aorta calcification 25 years later, at age 43–55 years, in fact risk measured early in the CARDIA study predicted future atherosclerosis as well as or better than risk measured at the time of the coronary artery or abdominal aorta calcium assessment. These data confirm the hypothesis that atherosclerosis evolves over decades and the presence of higher risk at a young age is ominous. We also analyzed the impact of change in risk over the 25 years and reassuringly, lowering risk lowered future likelihood of future subclinical atherosclerosis, conversely, increasing risk had adverse consequences. Further, these data suggest that the reason coronary artery calcium improves future risk prediction is that it functions as a measure of chronic risk exposure, adding information to risk measured at the time of the scan.
Acknowledgments
Funding Sources: The Coronary Artery Risk Development in Young Adults Study (CARDIA) is supported by contracts HHSN268201300025C, HHSN268201300026C, HHSN268201300027C, HHSN268201300028C, HHSN268201300029C, and HHSN268200900041C from the National Heart, Lung, and Blood Institute (NHLBI), the Intramural Research Program of the National Institute on Aging (NIA), and an intra-agency agreement between NIA and NHLBI (AG0005).
Footnotes
Disclosures: None.
References
- 1.McMahan CA, Gidding SS, Fayad ZA, Zieske AW, Malcom GT, Tracy RE, Strong JP, McGill HC., Jr Risk scores predict atherosclerotic lesions in young people. Arch Intern Med. 2005;165:883–890. doi: 10.1001/archinte.165.8.883. [DOI] [PubMed] [Google Scholar]
- 2.McMahan CA, Gidding SS, Malcom GT, Tracy RE, Strong JP, McGill HC., Jr Pathobiological determinants of atherosclerosis in youth risk scores are associated with early and advanced atherosclerosis. Pediatrics. 2006;118:1447–1455. doi: 10.1542/peds.2006-0970. [DOI] [PubMed] [Google Scholar]
- 3.Gidding SS, McMahan CA, McGill HC, Colangelo LA, Schreiner PJ, Williams OD, Liu K. Prediction of coronary artery calcium in young adults using the pathobiological determinants of atherosclerosis in youth (pday) risk score: The cardia study. Arch Intern Med. 2006;166:2341–2347. doi: 10.1001/archinte.166.21.2341. [DOI] [PubMed] [Google Scholar]
- 4.McMahan CA, Gidding SS, Viikari JS, Juonala M, Kahonen M, Hutri-Kahonen N, Jokinen E, Taittonen L, Pietikainen M, McGill HC, Jr, Raitakari OT. Association of pathobiologic determinants of atherosclerosis in youth risk score and 15-year change in risk score with carotid artery intima-media thickness in young adults (from the cardiovascular risk in young finns study) Am J Cardiol. 2007;100:1124–1129. doi: 10.1016/j.amjcard.2007.05.035. [DOI] [PMC free article] [PubMed] [Google Scholar]
- 5.Mahoney LT, Burns TL, Stanford W, Thompson BH, Witt JD, Rost CA, Lauer RM. Coronary risk factors measured in childhood and young adult life are associated with coronary artery calcification in young adults: The muscatine study. J Am Coll Cardiol. 1996;27:277–284. doi: 10.1016/0735-1097(95)00461-0. [DOI] [PubMed] [Google Scholar]
- 6.Raitakari OT, Juonala M, Kahonen M, Taittonen L, Laitinen T, Maki-Torkko N, Jarvisalo MJ, Uhari M, Jokinen E, Ronnemaa T, Akerblom HK, Viikari JS. Cardiovascular risk factors in childhood and carotid artery intima-media thickness in adulthood: The cardiovascular risk in young finns study. Jama. 2003;290:2277–2283. doi: 10.1001/jama.290.17.2277. [DOI] [PubMed] [Google Scholar]
- 7.Li S, Chen W, Srinivasan SR, Bond MG, Tang R, Urbina EM, Berenson GS. Childhood cardiovascular risk factors and carotid vascular changes in adulthood: The bogalusa heart study. Jama. 2003;290:2271–2276. doi: 10.1001/jama.290.17.2271. [DOI] [PubMed] [Google Scholar]
- 8.Loria CM, Liu K, Lewis CE, Hulley SB, Sidney S, Schreiner PJ, Williams OD, Bild DE, Detrano R. Early adult risk factor levels and subsequent coronary artery calcification: The cardia study. J Am Coll Cardiol. 2007;49:2013–2020. doi: 10.1016/j.jacc.2007.03.009. [DOI] [PubMed] [Google Scholar]
- 9.Gidding SS, Liu K, Colangelo LA, Cook NL, Goff DC, Glasser SP, Gardin JM, Lima JA. Longitudinal determinants of left ventricular mass and geometry: The coronary artery risk development in young adults (cardia) study. Circ Cardiovasc Imaging. 2013;6:769–775. doi: 10.1161/CIRCIMAGING.112.000450. [DOI] [PMC free article] [PubMed] [Google Scholar]
- 10.Carr JJ, Nelson JC, Wong ND, McNitt-Gray M, Arad Y, Jacobs DR, Jr, Sidney S, Bild DE, Williams OD, Detrano RC. Calcified coronary artery plaque measurement with cardiac ct in population-based studies: Standardized protocol of multi-ethnic study of atherosclerosis (mesa) and coronary artery risk development in young adults (cardia) study. Radiology. 2005;234:35–43. doi: 10.1148/radiol.2341040439. [DOI] [PubMed] [Google Scholar]
- 11.Agatston AS, Janowitz WR, Hildner FJ, Zusmer NR, Viamonte M, Jr, Detrano R. Quantification of coronary artery calcium using ultrafast computed tomography. J Am Coll Cardiol. 1990;15:827–832. doi: 10.1016/0735-1097(90)90282-t. [DOI] [PubMed] [Google Scholar]
- 12.Carr JJ, Crouse JR, 3rd, Goff DC, Jr, D'Agostino RB, Jr, Peterson NP, Burke GL. Evaluation of sub second gated helical ct for quantification of coronary artery calcium and comparison with electron beam ct. Ajr. 2000;174:915–921. doi: 10.2214/ajr.174.4.1740915. [DOI] [PubMed] [Google Scholar]
- 13.Detrano RC, Anderson M, Nelson J, Wong ND, Carr JJ, McNitt-Gray M, Bild DE. Coronary calcium measurements: Effect of ct scanner type and calcium measure on rescan reproducibility--mesa study. Radiology. 2005;236:477–484. doi: 10.1148/radiol.2362040513. [DOI] [PubMed] [Google Scholar]
- 14.Budoff MJ, McClelland RL, Chung H, Wong ND, Carr JJ, McNitt-Gray M, Blumenthal RS, Detrano RC. Reproducibility of coronary artery calcified plaque with cardiac 64-mdct: The multi-ethnic study of atherosclerosis. Ajr. 2009;192:613–617. doi: 10.2214/AJR.08.1242. [DOI] [PubMed] [Google Scholar]
- 15.Reis JP, Launer LJ, Terry JG, Loria CM, Zeki Al Hazzouri A, Sidney S, Yaffe K, Jacobs DR, Jr, Whitlow CT, Zhu N, Carr JJ. Subclinical atherosclerotic calcification and cognitive functioning in middle-aged adults: The cardia study. Atherosclerosis. 2013;231:72–77. doi: 10.1016/j.atherosclerosis.2013.08.038. [DOI] [PMC free article] [PubMed] [Google Scholar]
- 16.Van Wagner LB, Ning H, Lewis CE, Shay CM, Wilkins J, Carr JJ, Terry JG, Lloyd-Jones DM, Jacobs DR, Jr, Carnethon MR. Associations between nonalcoholic fatty liver disease and subclinical atherosclerosis in middle-aged adults: The coronary artery risk development in young adults study. Atherosclerosis. 2014;235:599–605. doi: 10.1016/j.atherosclerosis.2014.05.962. [DOI] [PMC free article] [PubMed] [Google Scholar]
- 17.Steffen LM, Van Horn L, Daviglus ML, Zhou X, Reis JP, Loria CM, Jacobs DR, Duffey KJ. A modified mediterranean diet score is associated with a lower risk of incident metabolic syndrome over 25 years among young adults: The cardia (coronary artery risk development in young adults) study. Br J Nutr. 2014;112:1654–1661. doi: 10.1017/S0007114514002633. [DOI] [PMC free article] [PubMed] [Google Scholar]
- 18.Juonala M, Magnussen CG, Berenson GS, Venn A, Burns TL, Sabin MA, Srinivasan SR, Daniels SR, Davis PH, Chen W, Sun C, Cheung M, Viikari JS, Dwyer T, Raitakari OT. Childhood adiposity, adult adiposity, and cardiovascular risk factors. N Engl J Med. 2011;365:1876–1885. doi: 10.1056/NEJMoa1010112. [DOI] [PubMed] [Google Scholar]
- 19.Hartiala O, Magnussen CG, Kajander S, Knuuti J, Ukkonen H, Saraste A, Rinta-Kiikka I, Kainulainen S, Kahonen M, Hutri-Kahonen N, Laitinen T, Lehtimaki T, Viikari JS, Hartiala J, Juonala M, Raitakari OT. Adolescence risk factors are predictive of coronary artery calcification at middle age: The cardiovascular risk in young finns study. J Am Coll Cardiol. 2012;60:1364–1370. doi: 10.1016/j.jacc.2012.05.045. [DOI] [PubMed] [Google Scholar]
- 20.Gepner AD, Young R, Delaney JA, Tattersall MC, Blaha MJ, Post WS, Gottesman RF, Kronmal R, Budoff MJ, Burke GL, Folsom AR, Liu K, Kaufman J, Stein JH. Comparison of coronary artery calcium presence, carotid plaque presence, and carotid intima-media thickness for cardiovascular disease prediction in the multi-ethnic study of atherosclerosis. Circ Cardiovas Imaging. 2015;8 doi: 10.1161/CIRCIMAGING.114.002262. [DOI] [PMC free article] [PubMed] [Google Scholar]
- 21.Yeboah J, McClelland RL, Polonsky TS, Burke GL, Sibley CT, O'Leary D, Carr JJ, Goff DC, Greenland P, Herrington DM. Comparison of novel risk markers for improvement in cardiovascular risk assessment in intermediate-risk individuals. JAMA. 2012;308:788–795. doi: 10.1001/jama.2012.9624. [DOI] [PMC free article] [PubMed] [Google Scholar]
- 22.Allen NB, Siddique J, Wilkins JT, Shay C, Lewis CE, Goff DC, Jacobs DR, Jr, Liu K, Lloyd-Jones D. Blood pressure trajectories in early adulthood and subclinical atherosclerosis in middle age. JAMA. 2014;311:490–497. doi: 10.1001/jama.2013.285122. [DOI] [PMC free article] [PubMed] [Google Scholar]
- 23.Reis JP, Allen N, Gibbs BB, Gidding SS, Lee JM, Lewis CE, Lima J, Lloyd-Jones D, Loria CM, Powell-Wiley TM, Sharma S, Wei G, Liu K. Association of the degree of adiposity and duration of obesity with measures of cardiac structure and function: The cardia study. Obesity (Silver Spring) 2014;22:2434–2440. doi: 10.1002/oby.20865. [DOI] [PMC free article] [PubMed] [Google Scholar]
- 24.Kishi S, Armstrong AC, Gidding SS, Colangelo LA, Venkatesh BA, Jacobs DR, Jr, Carr JJ, Terry JG, Liu K, Goff DC, Jr, Lima JA. Association of obesity in early adulthood and middle age with incipient left ventricular dysfunction and structural remodeling: The cardia study (coronary artery risk development in young adults) JACC Heart Fail. 2014;2:500–508. doi: 10.1016/j.jchf.2014.03.001. [DOI] [PMC free article] [PubMed] [Google Scholar]
- 25.Norman PE, Curci JA. Understanding the effects of tobacco smoke on the pathogenesis of aortic aneurysm. Arterioscler Thromb Vasc Biol. 2013;33:1473–1477. doi: 10.1161/ATVBAHA.112.300158. [DOI] [PMC free article] [PubMed] [Google Scholar]
- 26.McMahan CA, Gidding SS, Malcom GT, Schreiner PJ, Strong JP, Tracy RE, Williams OD, McGill HC. Comparison of coronary heart disease risk factors in autopsied young adults from the pday study with living young adults from the cardia study. Cardiovasc Pathol. 2007;16:151–158. doi: 10.1016/j.carpath.2006.12.003. [DOI] [PubMed] [Google Scholar]
- 27.Robinson JG, Gidding SS. Curing atherosclerosis should be the next major cardiovascular prevention goal. J Am Coll Cardiol. 2014;63:2779–2785. doi: 10.1016/j.jacc.2014.04.009. [DOI] [PubMed] [Google Scholar]
- 28.McGill HC, Jr, McMahan CA, Gidding SS. Preventing heart disease in the 21st century: Implications of the pathobiological determinants of atherosclerosis in youth (pday) study. Circulation. 2008;117:1216–1227. doi: 10.1161/CIRCULATIONAHA.107.717033. [DOI] [PubMed] [Google Scholar]
- 29.Mihaylova B, Emberson J, Blackwell L, Keech A, Simes J, Barnes EH, Voysey M, Gray A, Collins R, Baigent C. The effects of lowering ldl cholesterol with statin therapy in people at low risk of vascular disease: Meta-analysis of individual data from 27 randomised trials. Lancet. 2012;380:581–590. doi: 10.1016/S0140-6736(12)60367-5. [DOI] [PMC free article] [PubMed] [Google Scholar]
- 30.Williams KJ, Feig JE, Fisher EA. Rapid regression of atherosclerosis: Insights from the clinical and experimental literature. Nat Clin Pract Cardiovasc Med. 2008;5:91–102. doi: 10.1038/ncpcardio1086. [DOI] [PubMed] [Google Scholar]
- 31.Chomistek AK, Chiuve SE, Eliassen AH, Mukamal KJ, Willett WC, Rimm EB. Healthy lifestyle in the primordial prevention of cardiovascular disease among young women. J Am Coll Cardiol. 2015;65:43–51. doi: 10.1016/j.jacc.2014.10.024. [DOI] [PMC free article] [PubMed] [Google Scholar]