

Abstract
Objective
To assess the effect of an intensive lifestyle intervention (ILI) compared with standard diabetes support and education (DSE) on preference-based health-related quality of life (HRQOL) in persons with overweight or obesity and type 2 diabetes.
Methods
Look AHEAD was a multisite, randomized trial of 5145 participants assigned to ILI or DSE. Four instruments were administered during the trial: Feeling Thermometer (FT), Health Utilities Index Mark 2 (HUI2), Health Utilities Index Mark 3 (HUI3), and Short Form 6D (SF-6D). Linear mixed effect models were used to estimate the mean difference in preference scores by treatment group over 9 years.
Results
The ILI had higher mean FT (0.019, 95% CI, 0.015 to 0.024, p<0.001) and SF-6D (0.011, 95% CI, 0.006 to 0.014, p<0.001) scores than the DSE. No significant group-differences were observed for the HUI2 (0.004, 95% CI, -0.003 to 0.010, p=0.23) and HUI3 (0.004, -0.004 to 0.012, p=0.36). In year one, the ILI had higher mean preference scores for all instruments. Thereafter, the increases remained significant only for FT and SF-6D and the effects also become smaller.
Conclusions
ILI aimed at reducing bodyweight among persons with overweight or obesity and type 2 diabetes improves preference-based HRQOL in the short term, but its long-term effect is unclear.
Introduction
Obesity is associated with lower health-related quality of life (HRQOL) (1). Effects of lifestyle interventions aimed at bodyweight reduction on HRQOL are mixed. In a structured review of 34 weight loss trials, Maciejewski et al. reported that HRQOL outcomes “were not consistently improved”(2). Warkentin et al. reported a similar finding (3). In addition, nearly all weight loss trials were short-term (2, 3). Thus, it remains unclear whether lifestyle interventions to reduce bodyweight change HRQOL, in particular over time and among persons with diabetes.
The Action for Health in Diabetes (Look AHEAD) trial compared the long-term health impact of an intensive lifestyle intervention (ILI) with that for diabetes support and education (DSE) in 5145 adults with overweight or obesity and type 2 diabetes. The ILI was a goal-based diet and physical activity intervention designed to induce >7% weight loss in the first year of the trial and to maintain the weight loss in subsequent years (4). The primary outcome of the trial was cardiovascular disease (CVD) events. The trial planned for a mean of 12 follow-up years, but was stopped early on the basis of a futility analysis. During the intervention phase, participants were followed for a median of 9.6 years (5). The study showed that intensive lifestyle intervention did not reduce CVD morbidity and mortality in individuals with overweight or obesity and type 2 diabetes (5), but it produced improvements in sleep apnea (6), incontinence (7), and erectile dysfunction (8), reduced the incidence of high risk kidney disease (9), resulted in long-term better diabetes control and some remission of diabetes (10), and fewer hospitalizations (11).
Data on patient-oriented outcomes measured by HRQOL were collected as a secondary outcome in the study. Here, we report the effect of ILI compared to DSE on HRQOL in persons with overweight or obesity and type 2 diabetes using preference-based instruments.
Methods
Study design and participants
The objective, design, and population eligibility criteria of Look AHEAD have been reported elsewhere (12). To recap, study participants had to: be aged 45–76 years; have self-reported type 2 diabetes mellitus, verified by physician report; have a body mass index (BMI) >25 kg/m2 (>27 kg/m2 for those taking insulin); have hemoglobin A1c (HbA1c) level <11%; have systolic blood pressure <160 mm Hg; have diastolic blood pressure <110 mm Hg; and have triglyceride levels <600 mg/dl. Potential participants were excluded if they were currently diagnosed with psychosis or bipolar disorder, or had been hospitalized for depression in the prior six months. Prior to randomization, participants had to successfully complete a submaximal graded treadmill test to assess their ability to exercise safely.
Study intervention
Participants within each center were randomly assigned to the ILI or the DSE group. Details of the intensive lifestyle intervention and the DSE have been described elsewhere (4, 13). In brief, ILI participants were prescribed a calorie goal (1200–1800 kcal/day, based on initial weight), with <30% of total calories from fat (<10% from saturated fat), and >15% of total calories from protein. To increase dietary adherence, liquid meal replacements were also provided and utilized. ILI participants were encouraged to engage in >175 minutes per week of moderate-intensity exercise (similar to brisk walking) and were instructed to accumulate this exercise in bouts ≥10 minutes in duration. They also received a strong behavioral intervention which utilized strategies such as self-monitoring, problem solving, goal setting, and relapse prevention to modify dietary and exercise behaviors. Participants in the ILI were seen weekly for six months, and subsequently, three times per month for six months, in a combination of group and individual settings. Thereafter, they were offered group meetings, refreshers, and educational campaigns. DSE addressed general issues of diet, exercise, and social support using a standardized protocol. Participants in DSE were seen three times per year in group sessions for the first four years and one time per year in later years (5, 13).
Measures of preference-based quality of life
HRQOL can be measured using either preference- or non–preference-based instruments. The primary difference between these measures is that preference-based measures can facilitate the integration of mortality and morbidity outcomes into a single measure—quality-adjusted life years (QALYs), which are commonly used in the evaluation of the cost-effectiveness of health interventions (14). Preference scores typically range from 0.0 to 1.0, with 0.0 representing death, and 1.0 indicating full health (i.e., the absence of limitations in any assessed domain of health). Other health states, defined by sets of limitations, are represented by scores between 0.0 and 1.0. Health states perceived to be worse than death have scores below 0.0.
Different preference-based instruments are available, but scores derived from them are not interchangeable and there is little evidence that one instrument is superior to the others (15, 16). We used four preference-based instruments to assess HRQOL of the participants: the feeling thermometer (FT) (17), the Health Utilities Index Mark 2 (HUI2) (18), Health Utilities Index Mark 3 (HUI3) (19), and the SF-6D (20). The FT asks participants to report preference scores for current health (referred to as a direct preference-based assessment method); the HUI2, HUI3, and SF-6D ask participants to report on their current physical and mental functions and use published scoring rules to calculate preference scores (referred to as indirect preference-based assessment methods).
For FT scores, individual respondents were asked to rate their current health on a vertical thermometer-like scale with scores ranging from 0, representing worst possible health, to 100, representing best possible health. The FT's format and wording were similar to that used for the EuroQOL feeling thermometer (21). Participants' self-rated scores were divided by 100 so that the scale for the scores would be between 0.0 and 1.0, as for the other three instruments.
HUI2 and HUI3 are complementary preference weighting systems, each using a 40-item English language questionnaire to assess scores (22). HUI2 consists of six domains: sensation (vision, hearing, and speech), mobility, emotion, cognition, self-care, and pain and discomfort, each with three to five levels of function. It describes a total of 24,000 health states and its scores range from –0.03 to 1.00. Preference scores were calculated by use of a utility algorithm, developed from responses of 293 parents of school children drawn from the general population in Canada (18).
HUI3 consists of eight domains: hearing, vision, speech, ambulation, dexterity, emotion, cognition, and pain, each with five to six ability levels. It describes 972,000 health states and its scores range from –0.36 to 1.00. Preference scores were calculated by use of a utility algorithm, developed from responses from a random sample of 256 adults drawn from the general population in Hamilton, Canada (19).
In addition to differing in numbers of domains and numbers of levels within common domains, HUI2 and HUI3 differ in which 40 items are used to calculate its score and in the preference weights that are applied to the responses to these items (18, 19). While the two scores share substantial amounts of information, there is little evidence that one or the other of the measures is superior, and thus we used both.
For both HUI2 and HUI3, in addition to overall scores, single domain scores – which range between 0.0 and 1.0 – are also meaningful. A score of 0.0 represents the lowest level of functioning for an attribute (e.g., “unable to control or move arms and legs” for the HUI2 mobility attribute); a score of 1.0 represents full functionality for an attribute.
Preference scores for the SF-6D can be derived from selected items of the 36-Item Short-Form Health Survey (SF-36). The SF-36 measures generic non–preference-based HRQOL by assessing eight domains: physical functioning, role limitations because of physical functioning, bodily pain, general health perceptions, vitality, social functioning, role limitations because of emotional problems, and mental health. The SF-6D has six domains: physical functioning, role participation, social functioning, pain, mental health, and vitality (23). It describes a total of 18,000 unique health states; preference scores for these states range from 0.296 to 1.0. We calculated preference scores using a scoring rule derived from a representative sample of 611 persons from the general population of the United Kingdom (23).
Data collection
FT was administered at baseline, quarterly during year one, and semiannually in years two through ten. The HUI2, HUI3, and the SF-36 questionnaires were administered at baseline, quarterly during year one, semiannually during years two through four, and annually in years five through ten. The more frequent data collection for all four instruments during the first years was designed to capture possible short-term effects of the ILI on preference scores. The continuing more frequent administration of the FT during later years was due to its minimal response burden.
At baseline, questionnaires were completed during a clinic visit and reviewed by staff for completeness. Thereafter, annually administered self-report questionnaires were also collected at clinic visits and reviewed by staff. For semiannually and quarterly administered questionnaires or if participants were unable to attend annual visits, questionnaire responses were collected by telephone interview. Data collection staffs were masked to intervention assignment.
Statistical analyses
Analyses included all randomized participants according to intervention assignment (i.e., by intention to treat) and all data collected during the first nine years of the intervention phase of the trial (we excluded data collected thereafter because later follow-up assessments spanned the post-intervention phase of the trial and had large amounts of missing data). In our primary analysis, we assessed whether the average preference scores during follow-up differed between the ILI and DSE groups using linear mixed effects models with fixed effect covariate adjustment for clinic assignment (the randomization stratification variable), follow-up time, scheduled mode of data collection (in person or by phone call), and baseline preference scores (24)and random effects for individuals (24). Compound symmetry was assumed for intra-subject longitudinal correlations; restricted maximum likelihood was used to fit models, which provided a measure of robustness with respect to missing data (25).
We conducted three secondary analyses. First, we assessed whether intervention effects differed in subgroups defined by sex, history of CVD, and race and ethnicity. These subgroup analyses had been pre-specified for the Look AHEAD primary outcome, major CVD events, but not for other outcomes in the trial. We also compared the scores for subgroups based on age and baseline BMI. Tests of interaction were used to assess the consistency of differences in preference scores between the intervention and control groups for each of the five subgroups. Second, we assessed whether the intervention effects differed between domain scores from HUI2 and HUI3 responses using linear mixed models similar to the ones we used in the primary analysis. Third, we assessed whether the between-group differences in average preference scores were homogeneous over the nine years of follow-up using tests for group by time interactions. Statistical significance was defined as (unadjusted) p≤0.05 for all comparisons. All analyses were performed using SAS version 9.4 (26).
Results
Over nine years, 6.2% of ILI and 6.5% of DSE participants (p=0.62) were lost to follow-up and 6.8% of ILI and 7.8% DSE participants (p=0.15) died. Among active participants, data collection rates were 93% for FT, 83% for HUI2, 79% for HUI3 and 92% for SF-6D. There were no differences in any baseline characteristics between those who completed and those who did not complete the questionnaires. Collectively, these individuals provided 45,832 person-years of follow-up data for the FT, 42,613 for the HUI2, 42,005 for the HUI3, and 43,826 for the SF-6D.
Baseline characteristics
Table 1 presents the characteristics of the 5145 participants at enrollment. The average age was 59 years and average BMI was 36 kg/m2, 14% had a history of CVD, and the average duration of diabetes at the time of enrollment was about seven years and the average HbA1c was 7.3%. The average baseline preference scores were 0.742 for FT, 0.820 for HUI2, 0.813 for HUI3, and 0.782 for SF-6D. None of these characteristics differed significantly between groups.
Table 1. Baseline characteristics of the look ahead study participants by intervention arm.
| Baseline characteristics | DSE | ILI | p-value |
|---|---|---|---|
| N | 2575 | 2570 | |
| Age in years, (SD) | 58.9 (6.9) | 58.6 (6.8) | 0.12 |
| Sex (%) | |||
| Female | 59.7 | 59.4 | 0.82 |
| Race/ethnicity (%) | 0.98 | ||
| Black | 15.7 | 15.6 | |
| Hispanic | 13.2 | 13.2 | |
| American Indian | 5.0 | 5.1 | |
| White | 63.3 | 63.1 | |
| Other/Mixed | 2.8 | 3.1 | |
| Education level (%) | 0.61 | ||
| High school or less | 20.5 | 20.2 | |
| Post high school | 38.6 | 37.5 | |
| College graduate | 40.9 | 42.3 | |
| BMI (kg/m2) (SD) | 36.0 (5.8) | 35.9 (6.0) | 0.53 |
| History of cardiovascular disease (%) | 13.5 | 14.2 | 0.45 |
| Duration of diabetes in years, (SD) | 6.9 (6.4) | 6.8 (6.7) | 0.64 |
| Hemoglobin A1c (%) | 7.3 (1.2) | 7.3(1.14) | 0.06 |
| Hypertension (%) | 83.0 | 83.9 | 0.38 |
| Medication use (%) | |||
| Antihypertensive | 72.2 | 72.8 | 0.91 |
| Diabetes | 86.8 | 86.4 | 0.64 |
| Lipid | 49.6 | 49.8 | 0.70 |
| Preference based quality of Life score (SD) | |||
| Feeling Thermometer | 0.745 (0.154) | 0.739 (0.164) | 0.16 |
| HUI2 | 0.821 (0.157) | 0.818 (0.159) | 0.55 |
| HUI3 | 0.813 (0.193) | 0.812 (0.194) | 0.90 |
| SF-6D | 0.784 (0.122) | 0.782 (0.123) | 0.58 |
DSE Diabetes support and education; ILI intensive lifestyle intervention
Preference-based quality of life scores
ILI participants' mean FT and SF-6D scores over nine years of follow-up were significantly higher than DSE participants' scores (0.019, 95% CI, 0.015 to 0.024, p<0.001 for FT and 0.011, 95% CI, 0.006 to 0.014, p<0.001 for SF-6D) (Table 2). No significant differences were observed between scores for the two groups for the HUI2 or the HUI3 (0.004, 95% CI, -0.003 to 0.010, p=0.23 for the HUI2 and 0.004, 95% CI, -0.004 to 0.012, p=0.36 for the HUI3). There were no significant between-group differences with respect to any of the four preference-based quality-of-life measurements for subgroups defined by age, baseline BMI, sex, history of CVD, and race and ethnicity (Figures 1A to 1D). Among the 14 domain scores from the two HUI instruments, compared to DSE participants, ILI participants had marginally higher HUI2 mobility (0.002, p<0.01) and cognition (0.001, p=0.01) scores and marginally higher HUI3 ambulation scores (0.002, p<0.01) than DSE participants. No significant differences were observed in any of the other domain scores by treatment assignment (Appendix Table 1).
Table 2. Mean (se) preference-based quality of life scores over the intervention phase of the trial by intervention assignment.
| Preference scores | DSEmean (SE) | ILImean (SE) | ILI - DSE(95% CI) | p-value |
|---|---|---|---|---|
| Feeling thermometer | 0.769(0.002) | 0.788(0.002) | 0.019(0.015, 0.024) | <.001 |
| Health utility index 2 | 0.789(0.002) | 0.793(0.002) | 0.004(–0.003, 0.010) | 0.23 |
| Health utility index 3 | 0.779(0.003) | 0.783(0.003) | 0.004(–0.004, 0.012) | 0.36 |
| SF-6D | 0.763(0.001) | 0.774(0.001) | 0.011(0.006, 0.014) | <.001 |
DSE Diabetes Support and Education; ILI Intensive Lifestyle Intervention
Figure 1A-1D. Differences in mean (95%ci) preference scores between dse and ili by subgroup.


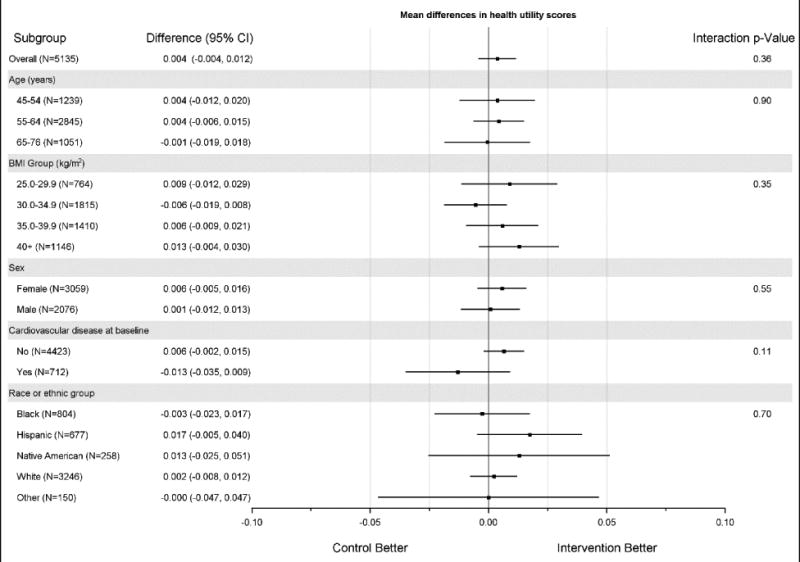

Figure 1A. Differences in mean (95%ci) feeling thermometer scores between dse and ili by subgroup; Figure 1B. Differences in mean (95%ci) health utility index 2 scores between dse and ili by subgroup; Figure 1C. Differences in mean (95%ci) health utility index 3 scores between dse and ili by subgroup; Figure 1D. Differences in mean (95%ci) sf-6d scores between dse and ili by subgroup
As indicated by plots of the treatment effect over the first nine years of the study (Figures 2A to 2D), in year one, mean preference scores for all four instruments were significantly greater for participants in the ILI group than for those in the DSE group. Thereafter, the increases generally were small for all instruments but remained statistically significant for the FT and SF-6D, while failing to remain significant for the HUI2 and HUI3.
Figure 2A-2D. Average preference scores by intervention assignment and follow-up time.

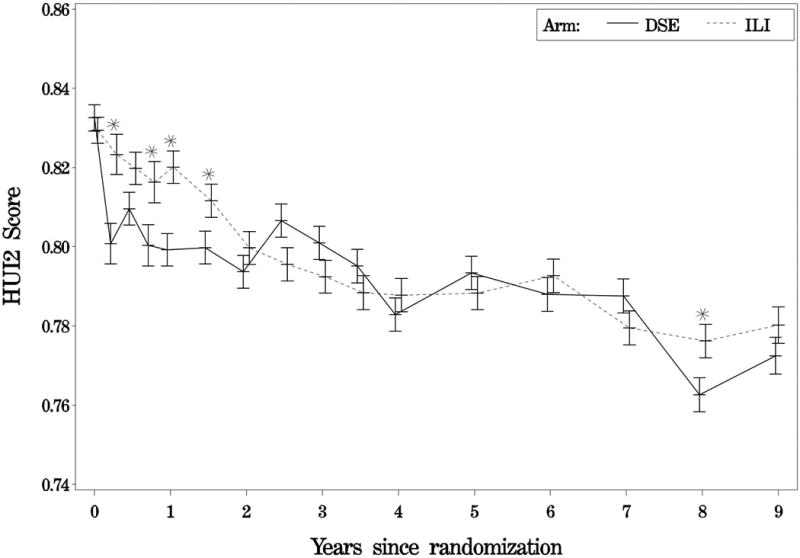
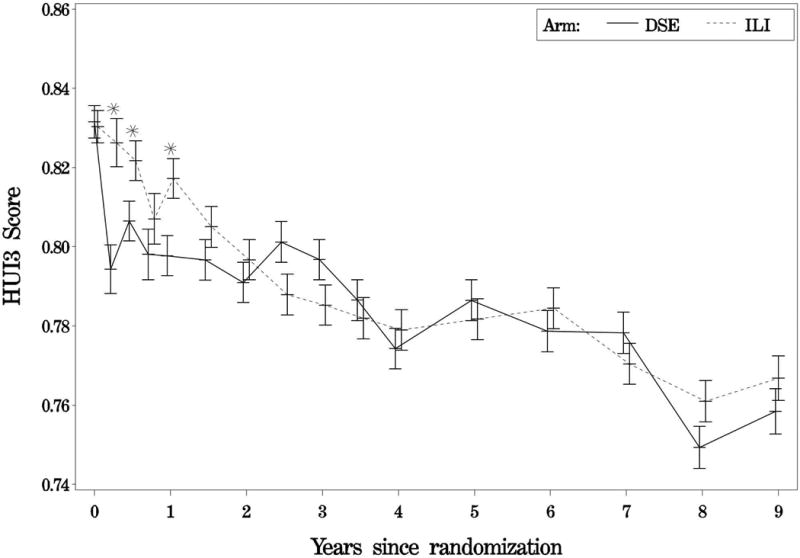

Figure 2A. Average feeling thermometer scores by intervention assignment and follow-up time; Figure 2B. Average health utility index 2 scores by intervention assignment and follow-up time; Figure 2C. Average health utility index 3 scores by intervention assignment and follow-up time; Figure2D. Average sf-6d scores by intervention assignment and follow-up time; solid lines represent the diabetes support and education group; dashed lines represent the intensive lifestyle intervention group.
Discussion
During the first year of the study, we observed statistically significant higher preference-based HRQOL scores for participants in the ILI group compared to DSE for all four instruments, with increases ranging from 0.01 to 0.04 (p-values <0.01). Evidence for longer-term improvements was inconsistent. For both the FT and SF-6D, smaller, statistically significant improvements were observed for most or all of the remaining eight years; for the HUI2 and HUI3, longer term effects were not statistically significant. The initially large effects in HRQOL that diminish over time are consistent with the larger weight loss and greater compliance with the intervention seen in the first year of Look AHEAD followed by weight regain and diminished compliance in later years (27).
Systematic reviews of the effectiveness of interventions for reducing bodyweight on HRQOL have shown mixed evidence. Our results strengthen the evidence for positive short-term effects. While evidence for longer term effects is less clear, our finding of long-term improvement in HRQOL, as measured by SF-6D, is similar to the finding of long-term improvement (3.2 years) reported by the Diabetes Prevention Program (28).
We observed little evidence of heterogeneity in the treatment effect on HRQOL across subgroups defined by age, BMI, sex, history of CVD, and race and ethnicity. This finding generally matched that of heterogeneity tests for other Look AHEAD outcomes (5), but the intervention was found to reduce total health care costs for individuals with no history of CVD, while having no benefit for those with a CVD history (11).
Although the HUI2's and HUI3's overall scores were not statistically significant over the nine-year study period, their domain scores did indicate that the ILI participants experienced small improvements in the cognition, mobility, and ambulation domains. These results were consistent with our earlier findings that the intensive lifestyle intervention improved physical functioning and mobility(27), but not with the lack of effect we have reported for cognitive function (29). ILI participants had more weight loss and better fitness, which might contribute to higher preference scores in the mobility and ambulation domains (27, 30).
Expert panel on cost-effectiveness analysis has recommended that QALYs be constructed using preference-based scores derived from the general public (e.g., those derived by use of instruments like the HUI2, HUI3, and SF-6D) (14). QALYS constructed by use of preference-based scores derived from patients (e.g., the FT) are to be used in sensitivity analysis. We used both the HUI2 and HUI3 because the 40-item data collection instrument allowed us to calculate both scores. The original study design included collecting generic HRQOL by use of the SF-36. When the SF-6D preference scoring algorithm for the SF-36 was published in 2002, we added the SF-6D to our set of preference score instruments.
All four instruments have been used in large numbers of studies for a wide range of health conditions and diseases. They correlate with one another and with factors considered to affect HRQOL (i.e., convergent validity criteria, such as severity of illness, pain, mood) (31). However, their scores are not interchangeable (15, 16, 32). The FT is easy to administer but is generally considered the least informative of the direct methods for assessing preferences (31). While we found discordant longer-term results among the four measures, it is unclear which instrument is most informative.
Several studies have reported a minimally important difference (MID) of 0.035 for HRQOL as assessed using the SF-6D (33, 34). One study reported MID of between 0.061 and 0.074 using the feeling thermometer(35). Reference standards for the SF-6D included the change in items of the SF-36 and other quality-of-life scores, such as those from the Health Assessment Questionnaire Disability Index (34); those for the FT included the Chronic Respiratory Questionnaire(35). In none of the cases was the MID derived by comparing the preferences scores to a life/death scale, which is what the scores are meant to be measuring. Whether or not these MIDs are appropriate, the ILI preference score increases did not reach the MID for either the SF-6D or FT.
However, for economic measures such as preference scores, the importance of changes in scores may be better judged by the cost of obtaining the changes, rather than by distribution-based (e.g., a half a standard deviation or one standard error) (36) or anchor-based (e.g., comparisons with a reference standard) considerations (34, 35). For example, for many people, score changes associated with a simple headache are important enough to justify out-of-pocket expenditures for analgesics. We observed an average improvement per year for the SF-6D of 0.011, which translates into a gain of 0.099 (9*0.011) undiscounted QALYs over 9 years of observation; average improvement per year for the FT was 0.019, which translates into a gain of 0.171 undiscounted QALYs. If these estimates truly bracket the effect of the intervention, and if we consider each additional QALY to be worth $50,000 (in the US, generally thought to be the low end of the worth of a QALY) (37), our findings would justify (undiscounted) net intervention costs (intervention costs less cost offsets due to the intervention) between $4950 ($4950/0.099= $50,000) and $8550 ($8550/0.171= $50,000). If we instead assume that the HUI2/HUI3 scores truly reflect the intervention effect, the amount justified would be substantially lower. However, because of the improvement in HRQOL is below the MID, justification for the intensive lifestyle intervention may also depend on benefits measured by other clinical outcomes, cost of intervention, and medical costs saved resulting from the intervention.
Regardless of the instrument we used, the long-term annual improvements in HRQOL resulting from the ILI were small and were significant only for the FT and SF-6D. The (lack of) magnitude of the effect might be due to effective clinical management of CVD risk factors in both study arms, which may limit the ability of the ILI to affect long-term HRQOL. The mixed evidence about significance might be due to the fact that the intervention does not improve health-related quality of life beyond year one. Alternatively, although the four instruments we used are routinely employed to evaluate the effect of a wide range of interventions on HRQOL, it might be due to the fact that the HUI2 and HUI3 are not sensitive enough to capture the improvement in HRQOL resulting from the intervention we tested. However, after reviewing 37 studies that compared responses to the HUI2, HUI3 and SF-6D, Glick et al. found limited evidence suggesting that these instruments systematically differ in their responsiveness (31).
Look AHEAD had a number of strengths. It is the largest study and the one with the longest follow-up to examine how preference scores may be affected by a lifestyle intervention to reduce bodyweight in individuals with overweight or obesity and type 2 diabetes. Second, it used multiple preference-based measures to identify the effect of ILI, recognizing that, although the measures may differ from one another, there is little to no evidence that one measure is superior to the others.
Look AHEAD also had several limitations. First, although we controlled for it in our analysis, we systematically varied the methods of administration (self-report or phone interview), which may have affected our assessment of the magnitude of changes in HRQOL observed in our study (38). Second, the HUI2 and HUI3 scoring algorithms were derived from general populations from Canada, not from a U.S. population, whereas for the SF-6D we used a UK scoring algorithm. If preference scores from the U.S. population differed from those from Canadian and U.K. populations, our estimated impact of ILI on HRQOL may be biased. At the same time, we are unaware of any study that documents significant differences in preference scores between the U.S., Canada, and the U.K. Finally, while Look AHEAD study participants had a similar broad age distribution as persons with type 2 diabetes in the United States, findings from this study may not be completely generalizable to the US because of the study exclusion criteria.
In summary, our study demonstrated that an intensive lifestyle intervention program designed to reduce bodyweight among individuals with overweight or obesity and type 2 diabetes improve HRQOL in the short term, but the evidence for longer-term improvement is unclear. These data, combined with mortality data and cost outcomes of the intervention, will be combined to assess the cost-effectiveness of the lifestyle intervention. Whether or not the lifestyle intervention is a good use of health care resources and should be widely adopted ultimately depends on the cost-effectiveness of the intervention.
Supplementary Material
What is already known?
Effects of lifestyle interventions aimed at bodyweight reduction on health-related quality of life (HRQO-L) have been evaluated in short-term clinical trials.
Weight reduction may be able to improve HRQOL as measured by non-preference HRQOL instruments in the short-term.
What does this study add?
Our study examined how lifestyle interventions aimed at bodyweight reduction would change HRQOL measured by preference-based instruments, in the long-term, and among persons with diabetes.
Intensive lifestyle intervention aimed at reducing bodyweight among persons with overweight or obesity and type 2 diabetes can improve overall health-related quality of life in the short term, but its long-term effect is unclear.
Acknowledgments
Funding: This study is supported by the Department of Health and Human Services through the following cooperative agreements from the National Institutes of Health: DK57136, DK57149, DK56990, DK57177, DK57171, DK57151, DK57182, DK57131, DK57002, DK57078, DK57154, DK57178, DK57219, DK57008, DK57135, and DK56992. The following federal agencies have contributed support: National Institute of Diabetes and Digestive and Kidney Diseases; National Heart, Lung, and Blood Institute; National Institute of Nursing Research; National Center on Minority Health and Health Disparities; Office of Research on Women's Health; the Centers for Disease Control and Prevention; and the Department of Veterans Affairs. This research was supported in part by the Intramural Research Program of the National Institute of Diabetes and Digestive and Kidney Diseases. The Indian Health Service (I.H.S.) provided personnel, medical oversight, and use of facilities. The opinions expressed in this paper are those of the authors and do not necessarily reflect the views of the I.H.S. or other funding sources.
Additional support was received from The Johns Hopkins Medical Institutions Bayview General Clinical Research Center (M01RR02719); the Massachusetts General Hospital Mallinckrodt General Clinical Research Center and the Massachusetts Institute of Technology General Clinical Research Center (M01RR01066); the University of Colorado Health Sciences Center General Clinical Research Center (M01RR00051) and Clinical Nutrition Research Unit (P30 DK48520); the University of Tennessee at Memphis General Clinical Research Center (M01RR0021140); the University of Pittsburgh General Clinical Research Center (GCRC) (M01RR000056), the Clinical Translational Research Center (CTRC) funded by the Clinical & Translational Science Award (UL1 RR 024153) and NIH grant (DK 046204); and the Frederic C. Bartter General Clinical Research Center (M01RR01346)
The following organizations have committed to make major contributions to Look AHEAD: FedEx Corporation; Health Management Resources; LifeScan, Inc., a Johnson & Johnson Company; OPTIFAST® of Nestle HealthCare Nutrition, Inc.; Hoffmann-La Roche Inc.; Abbott Nutrition; and Slim-Fast Brand of Unilever North America
Footnotes
Disclosure: M.A.E. serves on monitoring boards for Terumo Medical Corporation and the KOWA Research Institute. He serves on a Steering Committee for Boehringer Ingelheim Pharmaceuticals and has recently served on an advisory committee for Takeda Global Research. H.A.G. has twice been a sponsored lecturer by Merck pharmaceuticals. No other authors report potential conflicts.
The contents of this paper are solely the responsibility of the authors and do not necessarily represent the official positions of the Centers for Disease Control and Prevention.
References
- 1.Kushner RF, Foster GD. Obesity and quality of life. Nutrition. 2000;16(10):947–52. doi: 10.1016/s0899-9007(00)00404-4. [DOI] [PubMed] [Google Scholar]
- 2.Maciejewski ML, Patrick DL, Williamson DF. A structured review of randomized controlled trials of weight loss showed little improvement in health-related quality of life. J Clin Epidemiol. 2005;58(6):568–78. doi: 10.1016/j.jclinepi.2004.10.015. [DOI] [PubMed] [Google Scholar]
- 3.Warkentin LM, Das D, Majumdar SR, Johnson JA, Padwal RS. The effect of weight loss on health-related quality of life: systematic review and meta-analysis of randomized trials. Obes Rev. 2014;15(3):169–82. doi: 10.1111/obr.12113. [DOI] [PubMed] [Google Scholar]
- 4.Wadden TA, West DS, Delahanty L, et al. The Look AHEAD study: a description of the lifestyle intervention and the evidence supporting it. Obesity (Silver Spring) 2006;14(5):737–52. doi: 10.1038/oby.2006.84. [DOI] [PMC free article] [PubMed] [Google Scholar]
- 5.Wing RR, Bolin P, Brancati FL, et al. Cardiovascular effects of intensive lifestyle intervention in type 2 diabetes. N Engl J Med. 2013;369(2):145–54. doi: 10.1056/NEJMoa1212914. [DOI] [PMC free article] [PubMed] [Google Scholar]
- 6.Kuna ST, Reboussin DM, Borradaile KE, et al. Long-term effect of weight loss on obstructive sleep apnea severity in obese patients with type 2 diabetes. Sleep. 2013;36(5):641–649A. doi: 10.5665/sleep.2618. [DOI] [PMC free article] [PubMed] [Google Scholar]
- 7.Phelan S, Kanaya AM, Subak LL, et al. Weight loss prevents urinary incontinence in women with type 2 diabetes: results from the Look AHEAD trial. J Urol. 2012;187(3):939–44. doi: 10.1016/j.juro.2011.10.139. [DOI] [PMC free article] [PubMed] [Google Scholar]
- 8.Wing RR, Rosen RC, Fava JL, et al. Effects of weight loss intervention on erectile function in older men with type 2 diabetes in the Look AHEAD trial. J Sex Med. 2010;7(1 Pt 1):156–65. doi: 10.1111/j.1743-6109.2009.01458.x. [DOI] [PMC free article] [PubMed] [Google Scholar]
- 9.Knowler WC, Bahnson JL, Bantle JP, Lewis CE. Diabetic kidneys do deserve a lifestyle change. Lancet Diabetes Endocrinol. 2014;2(10):776. doi: 10.1016/S2213-8587(14)70204-9. [DOI] [PMC free article] [PubMed] [Google Scholar]
- 10.Gregg EW, Chen H, Wagenknecht LE, et al. Association of an intensive lifestyle intervention with remission of type 2 diabetes. JAMA. 2012;308(23):2489–96. doi: 10.1001/jama.2012.67929. [DOI] [PMC free article] [PubMed] [Google Scholar]
- 11.Espeland MA, Glick HA, Bertoni A, et al. Impact of an intensive lifestyle intervention on use and cost of medical services among overweight and obese adults with type 2 diabetes: the action for health in diabetes. Diabetes Care. 2014;37(9):2548–56. doi: 10.2337/dc14-0093. [DOI] [PMC free article] [PubMed] [Google Scholar]
- 12.Ryan DH, Espeland MA, Foster GD, et al. Look AHEAD (Action for Health in Diabetes): design and methods for a clinical trial of weight loss for the prevention of cardiovascular disease in type 2 diabetes. Control Clin Trials. 2003;24(5):610–28. doi: 10.1016/s0197-2456(03)00064-3. [DOI] [PubMed] [Google Scholar]
- 13.Wesche-Thobaben JA. The development and description of the comparison group in the Look AHEAD trial. Clin Trials. 2011;8(3):320–9. doi: 10.1177/1740774511405858. [DOI] [PMC free article] [PubMed] [Google Scholar]
- 14.Gold MR, Siegel JE, Russell LB, Weinstein MC. Cost-Effectiveness in Health and Medicine. Oxford; Oxford University Press; 1996. (eds) [Google Scholar]
- 15.Luo N, Johnson JA, Shaw JW, Feeny D, Coons SJ. Self-reported health status of the general adult U.S. population as assessed by the EQ-5D and Health Utilities Index. Med Care. 2005;43(11):1078–86. doi: 10.1097/01.mlr.0000182493.57090.c1. [DOI] [PubMed] [Google Scholar]
- 16.Feeny D, Spritzer K, Hays RD, et al. Agreement about identifying patients who change over time: cautionary results in cataract and heart failure patients. Med Decis Making. 2012;32(2):273–86. doi: 10.1177/0272989X11418671. [DOI] [PMC free article] [PubMed] [Google Scholar]
- 17.Torrance GW, Feeny D, Furlong W. Visual analog scales: do they have a role in the measurement of preferences for health states? Med Decis Making. 2001;21(4):329–34. doi: 10.1177/0272989X0102100408. [DOI] [PubMed] [Google Scholar]
- 18.Torrance GW, Feeny DH, Furlong WJ, Barr RD, Zhang Y, Wang Q. Multiattribute utility function for a comprehensive health status classification system. Health Utilities Index Mark 2. Med Care. 1996;34(7):702–22. doi: 10.1097/00005650-199607000-00004. [DOI] [PubMed] [Google Scholar]
- 19.Feeny D, Furlong W, Torrance GW, et al. Multiattribute and single-attribute utility functions for the health utilities index mark 3 system. Med Care. 2002;40(2):113–28. doi: 10.1097/00005650-200202000-00006. [DOI] [PubMed] [Google Scholar]
- 20.Brazier J, Roberts J, Deverill M. The estimation of a preference-based measure of health from the SF-36. J Health Econ. 2002;21(2):271–92. doi: 10.1016/s0167-6296(01)00130-8. [DOI] [PubMed] [Google Scholar]
- 21.2013 http://www.euroqol.org/fileadmin/user_upload/Documenten/PDF/User_Guide_v2_March_2009.pdf.
- 22.Horsman J, Furlong W, Feeny D, Torrance G. The Health Utilities Index (HUI): concepts, measurement properties and applications. Health Qual Life Outcomes. 2003;1:54. doi: 10.1186/1477-7525-1-54. [DOI] [PMC free article] [PubMed] [Google Scholar]
- 23.Brazier JE, Fukuhara S, Roberts J, et al. Estimating a preference-based index from the Japanese SF-36. J Clin Epidemiol. 2009;62(12):1323–31. doi: 10.1016/j.jclinepi.2009.01.022. [DOI] [PubMed] [Google Scholar]
- 24.Manca A, Hawkins N, Sculpher MJ. Estimating mean QALYs in trial-based cost-effectiveness analysis: the importance of controlling for baseline utility. Health Econ. 2005;14(5):487–96. doi: 10.1002/hec.944. [DOI] [PubMed] [Google Scholar]
- 25.Allison PD. Missing Data. Thousand Oaks, CA: Sage Publications; 2002. [Google Scholar]
- 26.SAS Institute Inc. Base SAS® 9.4 Procedures Guide:Statistical Procedures. Cary, NC: SAS Institute Inc; 2013. [Google Scholar]
- 27.Rejeski WJ, Ip EH, Bertoni AG, et al. Lifestyle change and mobility in obese adults with type 2 diabetes. N Engl J Med. 2012;366(13):1209–17. doi: 10.1056/NEJMoa1110294. [DOI] [PMC free article] [PubMed] [Google Scholar]
- 28.Florez H, Pan Q, Ackermann RT, et al. Impact of lifestyle intervention and metformin on health-related quality of life: the diabetes prevention program randomized trial. J Gen Intern Med. 2012;27(12):1594–601. doi: 10.1007/s11606-012-2122-5. [DOI] [PMC free article] [PubMed] [Google Scholar]
- 29.Espeland MA, Rapp SR, Bray GA, et al. Long-term impact of behavioral weight loss intervention on cognitive function. J Gerontol A Biol Sci Med Sci. 2014;69(9):1101–8. doi: 10.1093/gerona/glu031. [DOI] [PMC free article] [PubMed] [Google Scholar]
- 30.Jakicic JM, Jaramillo SA, Balasubramanyam A, et al. Effect of a lifestyle intervention on change in cardiorespiratory fitness in adults with type 2 diabetes: results from the Look AHEAD Study. Int J Obes (Lond) 2009;33(3):305–16. doi: 10.1038/ijo.2008.280. [DOI] [PMC free article] [PubMed] [Google Scholar]
- 31.Glick HA, Doshi JA, Sonnad SS, Polsky D. Economic Evaluation in Clinical Trials. Second Edition. Oxford; Oxford University Press; 2014. [Google Scholar]
- 32.Coteur G, Feagan B, Keininger DL, Kosinski M. Evaluation of the meaningfulness of health-related quality of life improvements as assessed by the SF-36 and the EQ-5D VAS in patients with active Crohn's disease. Aliment Pharmacol Ther. 2009;29(9):1032–41. doi: 10.1111/j.1365-2036.2009.03966.x. [DOI] [PubMed] [Google Scholar]
- 33.Gandhi PK, Ried LD, Bibbey A, Huang IC. SF-6D utility index as measure of minimally important difference in health status change. J Am Pharm Assoc (2003 ) 2012;52(1):34–42. doi: 10.1331/JAPhA.2012.10114. [DOI] [PubMed] [Google Scholar]
- 34.Khanna D, Furst DE, Wong WK, et al. Reliability, validity, and minimally important differences of the SF-6D in systemic sclerosis. Qual Life Res. 2007;16(6):1083–92. doi: 10.1007/s11136-007-9207-3. [DOI] [PubMed] [Google Scholar]
- 35.Schunemann HJ, Griffith L, Jaeschke R, Goldstein R, Stubbing D, Guyatt GH. Evaluation of the minimal important difference for the feeling thermometer and the St. George's Respiratory Questionnaire in patients with chronic airflow obstruction. J Clin Epidemiol. 2003;56(12):1170–6. doi: 10.1016/s0895-4356(03)00115-x. [DOI] [PubMed] [Google Scholar]
- 36.Norman GR, Sloan JA, Wyrwich KW. The truly remarkable universality of half a standard deviation: confirmation through another look. Expert Rev Pharmacoecon Outcomes Res. 2004;4(5):581–5. doi: 10.1586/14737167.4.5.581. [DOI] [PubMed] [Google Scholar]
- 37.Grosse SD. Assessing cost-effectiveness in healthcare: history of the $50,000 per QALY threshold. Expert Rev Pharmacoecon Outcomes Res. 2008;8(2):165–78. doi: 10.1586/14737167.8.2.165. [DOI] [PubMed] [Google Scholar]
- 38.Hanmer J, Hays RD, Fryback DG. Mode of administration is important in US national estimates of health-related quality of life. Med Care. 2007;45(12):1171–9. doi: 10.1097/MLR.0b013e3181354828. [DOI] [PubMed] [Google Scholar]
Associated Data
This section collects any data citations, data availability statements, or supplementary materials included in this article.